
ABSTRACT
Geographical traceability is important to consumer protection and quality control of edible mushrooms. In this work, Fourier transform infrared (FT-IR) spectroscopy, ultraviolet (UV) spectroscopy, and inductively coupled plasma-atomic emission spectrometry were used for traceability of 312 mushroom samples from eight different geographical origins in combination with multivariate statistical analysis. Initially, FT-IR, UV spectra, and 14 elements of 312 samples obtained from 8 geographical origins were analyzed, respectively. Meanwhile, the principal components of three techniques were extracted by principal components analysis for data fusion. Finally, classification models were established in the basis of UV, FT-IR, elements, and fusion datasets combined with support vector machine (SVM). Compared with individual technology, data fusion of multi-technique can obviously promote the classification performance in SVM models for geographical origins traceability. Especially, the accuracy of prediction in SVM model by data fusion of three instruments was 99.04%, which was higher than single technique and data fusion of two spectroscopies techniques. This result indicated that data fusion strategy combined with SVM can provide high synergic effect for geographical origins traceability of Boletaceae mushrooms. The more information is fused, the better performance of the model is. This method may be applied for quality control and evaluation of analogous food.
Introduction
Wild-grown edible mushrooms are a popular and favorite delicacy in Turkey, Poland, China, and so on.[Citation1–Citation3] Recently, the consumption of wild edible mushrooms increased rapidly, not only caused by the unique taste and texture but also for their chemical and nutritional properties. Edible mushrooms are generally considered as a valuable health food, due to their poor calories and fats and abundant vitamins, proteins, dietary fiber, and minerals.[Citation4,Citation5] Except the nutritious value, edible mushrooms have potential medicinal value, such as increasing immunity, depressing blood-fat, reducing cholesterol, and antineoplastic function, which are caused by terpenoids, antioxidants, and other active substances.[Citation6,Citation7] As far as we know, many habitat factors such as rainfall, air temperature, and altitude may lead to the change of nutritional components and the concentration of heavy metals. As previously studied by Lu et al.,[Citation8] the content of ganoderic acid A and B, polysaccharide, and triterpenoids had variations in Ganoderma lucidum because of different regions. Furthermore, there are significant differences in the content of heavy metal elements such as Cd, Ag, and Hg in edible mushroom from different geographical regions.[Citation9,Citation10] In addition, some minerals, such as K, P, Mg, Ca, Na, Cu, and Zn, had important roles to play in biological systems but also cofactors of a wide range of enzymes.[Citation11] However, excessive intake of trace minerals (such as Cr, Ni) can exhibit toxic effects.[Citation12] Hence, the geographical origins from which the wild-grown edible mushrooms are collected are important if the food are to be of good qualities, and an appropriate technology of geographical origins traceability of mushrooms is good for the stable development of edible fungi market.
Nowadays, many analytical techniques were used to research the differences and assess the quality of food, which were collected from different geographical origins. For example, Fourier transform infrared (FT-IR) spectroscopy for differential identification of Wolfiporia extensa from different places,[Citation13] Raman spectroscopy was used for milk powder characterization,[Citation14] cold-vapor atomic absorption spectroscopy (CV-AAS) was applied for assessing mushrooms which have been collected from Yunnan highlands and eastern Tibetan plateau,[Citation15] ultraviolet (UV) spectroscopy for discrimination of whisky brands and counterfeit,[Citation16] and inductively coupled plasma-atomic emission spectrometry (ICP-AES) has been used for Boletus tomentipes assessment from different sites.[Citation17] However, single technique would still have some imperfection to provide a reliable result. For instance, FT-IR, which fails to confirm the specific chemical component and their contents[Citation18]; Raman spectroscopy is influenced easily by intrinsic fluorescence, is unfit to analysis complex compound with low analyte concentration.[Citation19] Compared with individual techniques, data fusion can provide a more complete data interpretation. The main aim of the data fusion was to improve the models by enhancing the synergy between the fused techniques and using complementary inputs.[Citation20] Fusing complementary technologies has become one of the most reliable, effective, and powerful systematic approaches to determine quality of food. For the past few years, data fusion strategy combined with multivariate statistical analysis has been applied a lot in quality evaluation of edible oil, beverage, food, and so on. For example, Dankowska[Citation21] used data fusion of fluorescence and UV spectroscopies for the detection of cocoa butter adulterated with cocoa butter equivalents. Pizarro et al.[Citation22] gave a synergistic effect to classify extra virgin olive oils from different sites of Spain by fusing visible fingerprints and physical–chemical parameters. As reported by Wang et al.,[Citation23] an approach based on data fusion of near infrared and ultraviolet–visible (UV–vis) spectroscopies with the aid of chemometric algorithms was used for discriminating successfully five varieties of green tea. These results showed that data fusion could show correlations between the multiple kinds of variables, indicating that data fusion strategy of complementary techniques was a powerful tool for identification and quality evaluation of food.
In China, Yunnan Province has a land of immense scale and abundant of edible mushrooms resources. Two-fifths of edible mushrooms (880 species) in the world have been identified in Yunnan Province.[Citation24] However, there are a little report about evaluation of edible mushrooms from different geographical origins. In this work, the main goal was to establish an effective method for geographical origins traceability of Boletaceae mushrooms from eight geographical origins in Yunnan Province, China. FT-IR, UV, and ICP-AES were used, jointly and individually. And then, compared the classification results and selected the optimal analytical method. This work can provide a reference for further quality management of mushrooms market.
Materials and methods
Samples preparation
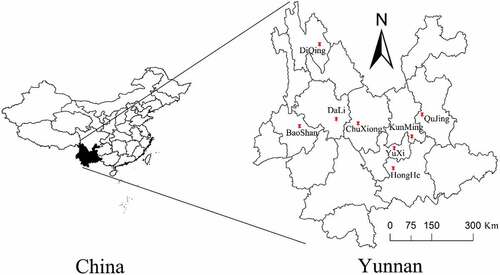
The study included 312 samples of Boletaceae mushrooms. Fruiting bodies were collected from eight geographical origins in August and September in Yunnan Province, China (). The detailed information of Boletaceae mushrooms is shown in . These samples were thoroughly cleaned by soft brush and dried in drying oven at 55°C for 48 h until the samples reached a constant weight. And then, all of the samples were crushed in the laboratory and the samples powder was sifted through nylon sieve in 80 mesh. In the last step, the powder was stored in zip lock bags and preserved in the dry and room temperature conditions for next step analysis.
Table 1. Information of mushroom samples
Figure 1. Geographical origins of Boletaceae mushrooms
Instruments and reagents
FT-IR spectroscopy spectrometer (PerkinElmer, Norwalk, CT, USA), which equipped with a DTGS detector, was used to obtain FT-IR spectra for wavenumbers in the range of 4000–400 cm−1 and 16 scans per sample with resolution of 4 cm−1. The UV–vis spectrophotometer (Shimadzu, Tokyo, Japan) was used to obtain UV spectra from 200 to 600 nm using a 1-nm slit width. It was equipped with a sample quartz cuvette and a blank quartz cuvette. All the mineral elements of samples were determined using ICPE-9000, which was produced by Shimadzu, Japan. A pulverizer (FW-100), which was purchased from Tianjin Huaxin Instrument Factory in China, was used to powder the samples of Boletaceae mushrooms. The tablet press (YP-2), which was purchased from Shanghai Shanyue Instrument Inc. in China, was used for pressing tablets of samples, and the electronic balance (XS125A) was used to weigh accurately.
Nitric acid solution (65%) was of guaranteed reagent grade, KBr (Purchased from Tianjin Fengchuan Fine Chemical Research Institute, China), chloroform (purchased from Yunnan Yangling Industrial Development Zone Shandian Medicine Co. Ltd., China), and hydrogen peroxide (30%) were of analytical reagent grade.
Data acquisition
In order to obtain FT-IR spectral data, 1.0 ± 0.2 mg sample powder and 100.0 ± 2.0 mg KBr powder were milled and blended uniformly in agate mortar. Then, the mixture powder was pressed with the pressure of 10 MPa for obtaining FT-IR information. After preheated for 30 min, FT-IR spectrometer was applied for every mushroom spectrum. Before the sample tablet was tested, the pure dried KBr tablet was scanned for subtracting carbon dioxide and water in the atmosphere. At the temperature of 25°C and relative humidity of 30% conditions, the experiment was completed. Each sample was determined three times and took the average for next step analysis.
For UV spectral acquisition, 0.1 g sample powder of each sample dissolved with 10 mL chloroform solvent. The mixture solvent was ultrasonic extracted (55 kHz) in water bath about 30°C for 30 min. Then, the filtrate was stored in test tubes for the next step. After UV spectrometer preheated for 0.5 h, background was scanned first by detecting the chloroform solvent. Each sample was detected three times and took the average as the finally result.
For testing the concentration of mineral elements, 0.3 g of dried sample powder was accurately weighted and put into the high-pressure digestion with 6 mL HNO3 (65%), 3 mL H2O2 (30%), and 1 mL ultrapure water. Then, the mixture was digested in Ethos One (Milestone, Italy) microwave closed system for 2 h. At last, the digestive solution was filtrated and diluted to 25 mL using ultrapure water and prepared for instrumental analysis. The tea standard reference material GBW07605 (tea leaves were produced by the Institute of Geophysical and Geochemical Exploration in Beijing, China) was applied for verifying precision and accuracy of the analytical method. The result showed that discrepancies between determined and certified contents were all below 10%, and the recovery rate was between 91% and 106%. In this experiment, all glassware was moistened by 60% HNO3 first and then rinsed with deionized water to prevent contamination.
Data analysis
As far as we known, spectroscopic techniques not only collect useful chemical information but also collect interference information, which was caused by scatter, background disturbance, solvent perturbation, and so on. Therefore, several preprocess methods were used to optimize datasets, such as second derivative (SD) and multiplicative scatter correction (MSC). SD is a common method to eliminate the overlap peaks and baseline shifts.[Citation25] MSC is used to segregate the informative absorbance of the analyte and the scattering signal in the spectral data.[Citation26] After selecting the best preprocess method, the optimize datasets of FT-IR and UV were used to the further analysis.
The goal of data fusion is to find out if there are any potentialities in the existing data that could be useful for classification. In order to find the optimal method for evaluation of Boletaceae mushrooms from eight geographical origins, mid-level data fusion strategy was applied for data mining. Mid-level data fusion (also called feature level data fusion) selected feature factors which represented the main information of samples from different technique to compose a new data matrix.[Citation27] Obviously, it is important that extracted feature factors from each instrument. The most common approaches to reduce dimension and select feature factors are principal components analysis (PCA) and partial least squares discrimination analysis.[Citation28] The goal is to screen the optimal feature factors that represent the main sample information for identification of Boletaceae mushrooms from different geographical origins. As it’s easy to be used and usually was applied prior to any other more complex classification,[Citation29] PCA was applied to extract principal components and then fused many principal components obtained independently from the signals of each instrument.
To establish the classification model for identification of different origins Boletaceae mushrooms, 208 samples, accounting for two-thirds of all samples, were selected as training set and other 104 samples as test set using the classic selection algorithm of Kennard-Stone[Citation30] in FT-IR, UV, ICP-AES, and fusion datasets. Based on different datasets, a growing popularity method of support vector machine (SVM) was applied as chemometrics methods to establish discrimination models. As a supervised pattern recognition method, SVM is able to analyze nonlinear cases even with small datasets.[Citation31] SVM was widely used in food for classification and regression, such as Bougrini et al.[Citation32] showed an effective method to detect adulteration in argan oil using electronic nose and electronic tongue combined with SVM. Devos et al.[Citation33] found that spectroscopic technology combined with SVM can be used easily to discriminate olive oil from different regions. In this work, SVM was used to establish classification models on the basis on individual instrument and data fusion for discrimination of Boletaceae mushrooms from eight geographical origins. In this work, OMNIC (Version 8.2, Thermo Fisher Scientific Inc., USA) and UV Probe (Version 2.34, Shimadzu International Trade Co., Ltd.) were used to analyze FT-IR and UV spectra, respectively. PCA and SVM were performed using MATLAB (version R2014a, MathWorks, USA).
Results and discussion
Chemical assignments of absorption peaks in FT-IR and UV spectra
All of 312 raw FT-IR spectra of Boletaceae mushrooms from different collection sites are shown in . These spectra present observations of several characteristics, which are similar spectral absorption peaks. These absorption peaks were reported in previous studies.[Citation34–Citation36] Around the bands of 3294 cm−1 is mainly attributed to the stretching vibration of O–H, which may be caused by water, triterpene, polysaccharide, and sterol. In addition, the peak at 2930 cm−1 is –CH2 vibration of lipoids and the peak at 1403 cm−1 is caused by CH2=CH–CH3 of triterpene compounds. The peaks at around 1647 cm−1 attributed to the C–N stretching and C=O stretching vibrations, indicating the presence of protein components. What’s more, the C–C stretching around at 1079 and 1025 cm−1 probably indicates the structures in chitin, a major structural polysaccharide in mushrooms. Furthermore, the region of 900–400 cm−1 is mainly assigned as β-d-glucan, the pyranose form of glucose, triterpenes, and so on.
Figure 2. Spectra of Boletaceae mushrooms:
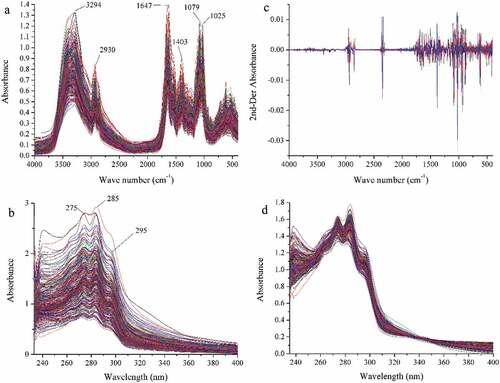
A total of 312 UV spectra of mushroom samples were collected. Because of the serious noise at the region of 200–235 nm, no characteristic adsorption peaks at 400–600 nm, and the main peaks focus on 235–400 nm. The region of 235–400 nm can provide the main information of samples. As can be seen from the raw UV spectra in , the distinct characteristic absorption peaks appear at 275, 285, and 295 nm. These peaks are attributed to polysaccharide and protein, and those compounds are closely related to antioxidant properties of mushrooms.[Citation37,Citation38] In general, there are no significant spectral differences among the Boletaceae mushrooms from different geographical origins by visual inspection. And this result showed the existence of similar chemical components in these samples.
In order to reduce the interferential information, SD and MSC were applied to preprocess FT-IR and UV spectral data, respectively. represent the raw FT-IR and UV spectra, ) for the preprocessed FT-IR and UV spectra, respectively. Comparing the result of raw spectra and preprocessed spectra, the spectral resolution has been improved obviously and the noise has been attenuated dramatically. Hence, the preprocessed spectral data were applied to achieve identification and evaluation aim.
Elemental analysis
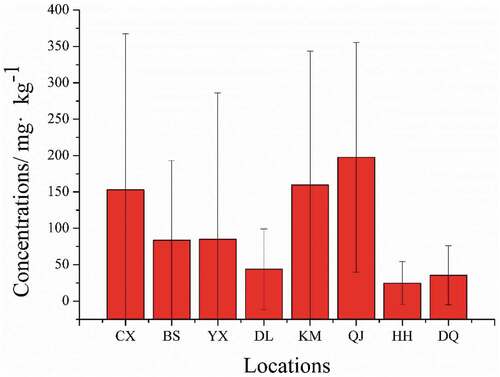
As shown in , the element contents in fruiting bodies of Boletaceae mushrooms are presented. Mushrooms can be considered as rich in P, K, Na, Ca, and Mg, as well as trace elements such as Cu and Zn. Furthermore, the concentrations of K, P, Mg, and Ca are higher than that of Zn and Cu, which is same as reported by Kalač.[Citation39] In particular, the concentration of K was determined at the range of 9897.08–12,919.64 mg kg−1, which is in accordance with the previous studies.[Citation40] P, an essential element for people, almost takes into all physiological chemical reactions, like forming the bones, teeth, and nucleic acid, maintaining balance of metabolism, and regulating acid-base balance.[Citation41] The concentration of P was found at the range of 4324.43–5907.53 mg kg−1, which can suit human demand in life. The concentration of Zn was found at the range of 92.13–122.14 mg kg−1, this result was in accordance with the range of edible wild-grown mushrooms in the previous study (45.00–188.00 mg kg−1).[Citation42] Furthermore, there are significant differences in the concentrations of elements from different origins. As can be seen in , the differences of contents of Cr in eight locations were significant, in which the minimum and maximum values are 24.81 mg kg−1 in HongHe and 197.70 mg kg−1 in QuJing, respectively. As far as we know, mushrooms have a very effective mechanism against heavy metal accumulation from the environment. Hence, the high concentration of Cr suggested that some Boletaceae mushrooms may grow in polluted sites.
Table 2. The results of mineral concentrations determined in eight origins mushrooms. (mean ± SD, mg kg−1)
Figure 3. Cr concentration of Boletaceae mushrooms from different locations
Number of principal components
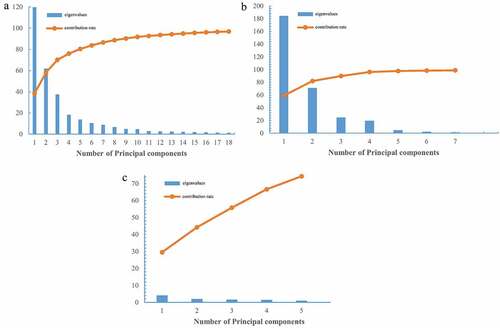
PCA is a common statistical method, which was widely used in data dimension reduction and pattern recognition.[Citation43] In this paper, PCA was used to extract the feature variables for identification of Boletaceae mushrooms from different origins. The eigenvalues and accumulative contribution rate of the first several principal components were used to evaluate the good potential for representative of sample information. According to the Kaiser criterion,[Citation44] those principal components, the eigenvalues, were higher than one and can provide more effective information for discrimination. Hence, the first 18 principal components of FT-IR, the first 7 principal components of UV, and the first 5 principal components of element were chosen. Moreover, the higher the accumulative contribution rate is, the more information it represents. The results of PCA of FT-IR, UV, and element datasets are in , respectively. As we can see in , the accumulative contribution of the first 18 principal components of FT-IR is 96.85%, the accumulative contribution of the first 7 principal components of UV is 98.90%, and the accumulative contribution of the first 5 principal components of element dataset is 74.31%. Therefore, these principal components can represent the main information of Boletaceae mushroom samples and can be used to complete the mid-level data fusion for further analysis.
Figure 4. The eigenvalues and contribution rate of first several principal components:
Geographical origins traceability of Boletaceae mushrooms
In the present study, FT-IR, UV, and ICP-AES combined with multivariate statistical analysis were applied for geographical origins traceability, individually and jointly. SVM is an excellent analytical method for discriminant analysis of complex data. Four parameters, kernel function parameter (g), penalty parameter (c), the accuracy of sevenfold cross validation, and the test set were used to evaluate the performance of discrimination model. These parameters can represent the reliability of the classification model. For example, the g is closely related to the classification accuracy, and c is the error term. Hence, the lower the c is, the more robust the discriminant model is. The accuracy of cross validation (sevenfold) and the test set represents the stability and predictive ability of classification models, respectively.
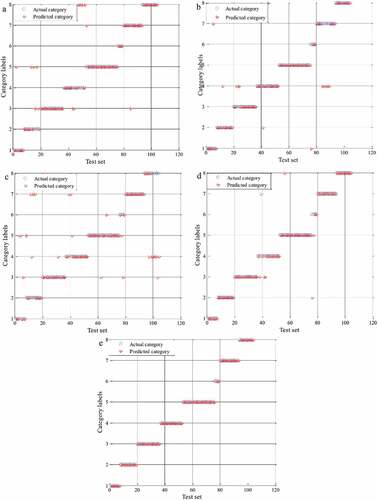
The SVM models of Boletaceae mushrooms from different origins on basis of multiple data matrixes are shown in . – represent the classification models on the basis of FT-IR, UV, ICP-AES, data fusion of FT-IR, and UV, and data fusion of FT-IR, UV, ICP-AES, respectively. As we can see, the classification models of data fusion ( ) have the higher accuracy of the test set than single instrument (). Especially, the SVM model of data fusion of three instruments only has one classification error. Moreover, the result of classification model of FT-IR is similar with the classification model of UV, whereas the classification model of ICP-AES has the most classification errors. For taking a full consideration, all parameters of classification models have been exhibited in . As we can see, the largest value of penalty parameter is FT-IR (2352.5342), followed by single UV (147.033), data fusion of FT-IR and UV (5.278), single ICP-AES (3.0314), and data fusion of three instruments (3.0314). This result showed that single FT-IR or UV has large error, which made the classification models of FT-IR and UV unreliable. In the classification models of single instrument, the accuracy of the test set of ICP-AES (76.92%) is lowest and the accuracy of the test set of FT-IR (85.58%) is approximately equal to UV (86.54%). Furthermore, the cross-validation accuracy of FT-IR is 77.40%, which is higher than another single instrument. It suggested that FT-IR is a rapid and reliable method for identification. As reported by Li et al.,[Citation13] FT-IR spectroscopy combined with multivariate data analysis were applied for identification of different regional W. extensa sclerotia samples. In addition, the penalty parameter c of data fusion of FT-IR and UV is larger than ICP-AES, but cross validation and the test set accuracy of FT-IR and UV data fusion are higher than that of ICP-AES, respectively. From the above, the classification model performance of data fusion is better than single instrument. This result is consistent with our previous study[Citation45] that data fusion strategy, as an simple and reliable technology, has good performance for geographical origins traceability. Meanwhile, the accuracy of cross validation and the test set of data fusion of three instruments are 84.62% and 99.04%, respectively. The penalty parameter (c) is 3.0314. Compared with data fusion of two instruments, the classification models of data fusion of three instruments have a higher predicted accuracy. It indicated that the more information is fused, the better performance of the model is. Moreover, we inferred that the difference of species may provide the difficulties for geographical origins traceability of Boletaceae. This factor may be the reason that the predicted accuracy of classification model was less than 100%.
Table 3. The results of SVM models on different data sources
Figure 5. The plot of actual and predicted category of test samples by SVM:
Conclusion
In this paper, FT-IR, UV, and ICP-AES were applied for geographical origins traceability, individually and jointly. PCA was used to reduce dimensionality and extract the feature variables. SVM was applied to establish discriminant models for geographical origins traceability of Boletaceae mushrooms. Subsequently, compared the classification performance of each single and data fusion strategies. Comparatively, data fusion strategy, combined with SVM, has better performance of classification models than single technique. In particular, data fusion of three instruments was proved as the best discriminant strategy with the accuracy of 84.62% in cross validation, the accuracy of 99.04% in the test set, and the penalty parameter is 3.0314. It indicated that the more information is fused, the better performance of the model is. In conclusion, this work demonstrated that data fusion strategy from multiple sources combine with SVM could improve the performance of models for geographical origin traceability. Therefore, data fusion combine with multivariate statistical analysis may provide a reliable method for food traceability and quality control.
Additional information
Funding
References
- Turkekul, I.; Elmastas, M.; Tüzen, M. Determination of Iron, Copper, Manganese, Zinc, Lead, and Cadmium in Mushroom Samples from Tokat, Turkey. Food Chem. 2004, 84(3), 389–392. DOI: 10.1016/S0308-8146(03)00245-0.
- Frankowska, A.; Ziółkowska, J.; Bielawski, L.; Falandysz, J. Profile and Bioconcentration of Minerals by King Bolete (Boletus Edulis) from the Płocka Dale in Poland. Food Addit. Contam. Part B. 2010, 3(1), 1–6. DOI: 10.1080/19440040903505232.
- Wang, X.; Liu, H.; Zhang, J.; Li, T.; Wang, Y. Evaluation of Heavy Metal Concentrations of Edible Wild-Grown Mushrooms from China. J. Environ. Sci. Health Part B. 2017, 52(3), 178–183. DOI: 10.1080/03601234.2017.1261545.
- Ulziijargal, E.; Mau, J. L. Nutrient Compositions of Culinary-Medicinal Mushroom Fruiting Bodies and Mycelia. Int. J. Med. Mushrooms. 2011, 13(4), 343–349.
- Wang, X. M.; Zhang, J.; Wu, L. H.; Zhao, Y. L.; Li, T.; Li, J. Q.; Wang, Y. Z.; Liu, H. G. A Mini-Review of Chemical Composition and Nutritional Value of Edible Wild-Grown Mushroom from China. Food Chem. 2014, 151, 279–285. DOI: 10.1016/j.foodchem.2013.11.062.
- Lau, B. F.; Abdullah, N. Bioprospecting of Lentinus Squarrosulus Mont., An Underutilized Wild Edible Mushroom, as A Potential Source of Functional Ingredients: A Review. Trends Food Sci. Technol. 2017, 61, 116–131. DOI: 10.1016/j.tifs.2016.11.017.
- Elmastas, M.; Isildak, O.; Turkekul, I.; Temur, N. Determination of Antioxidant Activity and Antioxidant Compounds in Wild Edible Mushrooms. J. Food Compost. Anal. 2007, 20(3), 337–345. DOI: 10.1016/j.jfca.2006.07.003.
- Lu, J.; Qin, J. Z.; Chen, P.; Chen, X.; Zhang, Y. Z.; Zhao, S. J. Quality Difference Study of Six Varieties of Ganoderma Lucidum with Different Origins. Front. Pharmacol. 2012, 3, 3321521. DOI: 10.3389/fphar.2012.00057.
- Kojta, A. K.; Falandysz, J. Metallic Elements (Ca, Hg, Fe, K, Mg, Mn, Na, Zn) in the Fruiting Bodies of Boletus Badius. Food Chem. 2016, 200, 206–214. DOI: 10.1016/j.foodchem.2016.01.006.
- Zhang, J.; Li, T.; Yang, Y. L.; Liu, H. G.; Wang, Y. Z. Arsenic Concentrations and Associated Health Risks in Laccaria Mushrooms from Yunnan (SW China). Biol. Trace Elem. Res. 2015, 164(2), 261–266. DOI: 10.1007/s12011-014-0213-3.
- Falandysz, J.; Borovička, J. Macro and Trace Mineral Constituents and Radionuclides in Mushrooms: Health Benefits and Risks. Appl. Microbiol. Biotechnol. 2013, 97(2), 477–501. DOI: 10.1007/s00253-012-4552-8.
- Zhu, F.; Qu, L.; Fan, W.; Qiao, M.; Hao, H.; Wang, X. Assessment of Heavy Metals in Some Wild Edible Mushrooms Collected from Yunnan Province, China. Environ. Monit. Assess. 2011, 179(1), 191–199. DOI: 10.1007/s10661-010-1728-5.
- Li, Y.; Zhang, J.; Zhao, Y.; Liu, H.; Wang, Y.; Jin, H. Exploring Geographical Differentiation of the Hoelen Medicinal Mushroom, Wolfiporia Extensa (Agaricomycetes), Using Fourier-Transform Infrared Spectroscopy Combined with Multivariate Analysis. Int. J. Med. Mushrooms. 2016, 18(8), 721–731. DOI: 10.1615/IntJMedMushrooms.v18.i8.80.
- Júnior, P. H. R.; de Sá Oliveira, K.; de Almeida, C. E. R.; De Oliveira, L. F. C.; Stephani, R.; Da Silva Pinto, M.; De Carvalho, A. F.; Perrone, Í. T. FT-Raman and Chemometric Tools for Rapid Determination of Quality Parameters in Milk Powder: Classification of Samples for the Presence of Lactose and Fraud Detection by Addition of Maltodextrin. Food Chem. 2016, 196, 584–588. DOI: 10.1016/j.foodchem.2015.09.055.
- Falandysz, J.; Saba, M.; Liu, H. G.; Li, T.; Wang, J. P.; Wiejak, A.; Zhang, J.; Wang, Y. Z.; Zhang, D. Mercury in Forest Mushrooms and Topsoil from the Yunnan Highlands and the Subalpine Region of the Minya Konka Summit in the Eastern Tibetan Plateau. Environ. Sci. Pollut. Res. 2016, 23(23), 23730–23741. DOI: 10.1007/s11356-016-7580-6.
- Wiśniewska, P.; Boqué, R.; Borràs, E.; Busto, O.; Wardencki, W.; Namieśnik, J.; Dymerski, T. Authentication of Whisky Due to its Botanical Origin and Way of Production by Instrumental Analysis and Multivariate Classification Methods. Spectrochim. Acta Part A. 2017, 173, 849–853. DOI: 10.1016/j.saa.2016.10.042.
- Wang, X. M.; Zhang, J.; Li, T.; Li, J. Q.; Wang, Y. Z.; Liu, H. G. ICP-AES Determination of Mineral Content in Boletus Tomentipes Collected from Different Sites of China. Spectrosc. Spectral Anal. 2015, 35(5), 1398–1403.
- Li, Y.; Zhang, J.; Li, T.; Liu, H.; Wang, Y. A Comprehensive and Comparative Study of Wolfiporia Extensa Cultivation Regions by Fourier Transform Infrared Spectroscopy and Ultra-Fast Liquid Chromatography. PLOS One. 2016, 11(12), e0168998. DOI: 10.1371/journal.pone.0168998.
- Buckley, K.; Ryder, A. G. Applications of Raman Spectroscopy in Biopharmaceutical Manufacturing: A Short Review. Appl. Spectrosc. 2017, 71(6), 1085–1116. DOI: 10.1177/0003702817703270.
- Borràs, E.; Ferré, J.; Boqué, R.; Mestres, M.; Aceña, L.; Busto, O. Data Fusion Methodologies for Food and Beverage Authentication and Quality Assessment–A Review. Anal. Chim. Acta. 2015, 891, 1–14. DOI: 10.1016/j.aca.2015.04.042.
- Dankowska, A. Data Fusion of Fluorescence and UV Spectroscopies Improves the Detection of Cocoa Butter Adulteration. Eur. J. Lipid Sci. Technol. 2017, 119, 1600268. DOI: 10.1002/ejlt.v119.8.
- Pizarro, C.; Rodríguez-Tecedor, S.; Pérez-del-Notario, N.; Esteban-Díez, I.; González-Sáiz, J. M. Classification of Spanish Extra Virgin Olive Oils by Data Fusion of Visible Spectroscopic Fingerprints and Chemical Descriptors. Food Chem. 2013, 138(2), 915–922. DOI: 10.1016/j.foodchem.2012.11.087.
- Wang, X.; Huang, J.; Fan, W.; Lu, H. Identification of Green Tea Varieties and Fast Quantification of Total Polyphenols by Near-Infrared Spectroscopy and Ultraviolet-Visible Spectroscopy with Chemometric Algorithms. Anal. Methods. 2015, 7(2), 787–792. DOI: 10.1039/C4AY02106A.
- Wu, S. R.; Luo, X. L.; Liu, B.; Gui, M. Y. Analyse and Advise to Research and Development of Wild Edible Fungi. Food Sci. Technol. 2010, 35(4), 100–103.
- Roy, I. G. On Computing First and Second Order Derivative Spectra. J. Comput. Phys. 2015, 295, 307–321. DOI: 10.1016/j.jcp.2015.04.015.
- Chen, H.; Song, Q.; Tang, G.; Feng, Q.; Lin, L. The Combined Optimization of Savitzky-Golay Smoothing and Multiplicative Scatter Correction for FT-NIR PLS Models. ISRN Spectrosc. 2013, 2013, 642190. DOI: 10.1155/2013/642190.
- Biancolillo, A.; Bucci, R.; Magrì, A. L.; Magrì, A. D.; Marini, F. Data-Fusion for Multiplatform Characterization of an Italian Craft Beer Aimed at its Authentication. Anal. Chim. Acta. 2014, 820, 23–31. DOI: 10.1016/j.aca.2014.02.024.
- Vera, L.; Aceña, L.; Boqué, R.; Guasch, J.; Mestres, M.; Busto, O. Application of an Electronic Tongue Based on FT-MIR to Emulate the Gustative Mouthfeel “Tannin Amount” in Red Wines. Anal. Bioanal. Chem. 2010, 397(7), 3043–3049. DOI: 10.1007/s00216-010-3852-z.
- Šamec, D.; Maretić, M.; Lugarić, I.; Mešić, A.; Salopek-Sondi, B.; Duralija, B. Assessment of the Differences in the Physical, Chemical and Phytochemical Properties of Four Strawberry Cultivars Using Principal Component Analysis. Food Chem. 2016, 194, 828–834. DOI: 10.1016/j.foodchem.2015.08.095.
- Saptoro, A.; Tadé, M. O.; Vuthaluru, H. A Modified Kennard-Stone Algorithm for Optimal Division of Data for Developing Artificial Neural Network Models. Chem. Prod. Process Model. 2012, 7(1), 1–14. DOI: 10.1515/1934-2659.1645.
- Pouladzadeh, P.; Shirmohammadi, S.; Bakirov, A.; Bulut, A.; Yassine, A. Cloud-Based SVM for Food Categorization. Multimedia Tools Appl. 2015, 74(14), 5243–5260. DOI: 10.1007/s11042-014-2116-x.
- Bougrini, M.; Tahri, K.; Haddi, Z.; Saidi, T.; El Bari, N.; Bouchikhi, B. Detection of Adulteration in Argan Oil by Using an Electronic Nose and a Voltammetric Electronic Tongue. J. Sens. 2014, 2014, 1–10. DOI: 10.1155/2014/245831.
- Devos, O.; Downey, G.; Duponchel, L. Simultaneous Data Pre-Processing and SVM Classification Model Selection Based on a Parallel Genetic Algorithm Applied to Spectroscopic Data of Olive Oils. Food Chem. 2014, 148, 124–130. DOI: 10.1016/j.foodchem.2013.10.020.
- Choong, Y. K.; Xu, C. H.; Lan, J.; Chen, X. D.; Jamal, J. A. Identification of Geographical Origin of Lignosus Samples using Fourier Transform Infrared and Two-Dimensional Infrared Correlation Spectroscopy. J. Mol. Struct. 2014, 1069, 188–195. DOI: 10.1016/j.molstruc.2014.04.001.
- Zhu, Y.; Tan, A. T. L. Discrimination of Wild-Grown and Cultivated Ganoderma Lucidum by Fourier Transform Infrared Spectroscopy and Chemometric Methods. Am. J. Anal. Chem. 2015, 6(05), 480–491. DOI: 10.4236/ajac.2015.65047.
- O’Gorman, A.; Downey, G.; Gowen, A. A.; Barry-Ryan, C.; Frias, J. M. Use of Fourier Transform Infrared Spectroscopy and Chemometric Data Analysis to Evaluate Damage and Age in Mushrooms (Agaricus Bisporus) Grown in Ireland. J. Agric. Food Chem. 2010, 58(13), 7770–7776. DOI: 10.1021/jf101123a.
- Gonzaga, M. L. C.; Ricardo, N. M.; Heatley, F.; Soares, S. D. A. Isolation and Characterization of Polysaccharides from Agaricus Blazei Murill. Carbohydr. Polym. 2005, 60(1), 43–49. DOI: 10.1016/j.carbpol.2004.11.022.
- Anghileri, A.; Lantto, R.; Kruus, K.; Arosio, C.; Freddi, G. Tyrosinase-Catalyzed Grafting of Sericin Peptides onto Chitosan and Production of Protein–Polysaccharide Bioconjugates. J. Biotechnol. 2007, 127(3), 508–519. DOI: 10.1016/j.jbiotec.2006.07.021.
- Kalač, P. Trace Element Contents in European Species of Wild Growing Edible Mushrooms: A Review for the Period 2000–2009. Food Chem. 2010, 122(1), 2–15. DOI: 10.1016/j.foodchem.2010.02.045.
- Jarzyńska, G.; Chojnacka, A.; Dryżałowska, A.; Nnorom, I. C.; Falandysz, J. Concentrations and Bioconcentration Factors of Minerals in Yellow-Cracking Bolete (Xerocomus Subtomentosus) Mushroom Collected in Noteć Forest, Poland. J. Food Sci. 2012, 77(9), H202–H206. DOI: 10.1111/j.1750-3841.2012.02876.x.
- Wang, X. M.; Zhang, J.; Li, T.; Li, J. Q.; Wang, Y. Z.; Liu, H. G. Variations in Element Levels Accumulated in Different Parts of Boletus Edulis Collected from Central Yunnan Province, China. J. Chem. 2015, 2015, 1–7. DOI: 10.1155/2015/372152.
- Tüzen, M. Determination of Heavy Metals in Soil, Mushroom and Plant Samples by Atomic Absorption Spectrometry. Microchem. J. 2003, 74(3), 289–297. DOI: 10.1016/S0026-265X(03)00035-3.
- Qureshi, N. A.; Suthar, V.; Magsi, H.; Sheikh, M. J.; Pathan, M.; Qureshi, B. Application of Principal Component Analysis (PCA) to Medical Data. Indian J. Sci. Technol. 2017, 10(20), 1–9. DOI: 10.17485/ijst/2017/v10i20/91294.
- Kaiser, H. F. The Application of Electronic Computers to Factor Analysis. Educ. Psychol. Meas. 1960, 20(1), 141–151.
- Yao, S.; Li, T.; Liu, H. G.; Li, J. Q.; Wang, Y. Z. Geographic Characterization of Leccinum Rugosiceps by Ultraviolet and Infrared Spectral Fusion. Anal. Lett. 2017, 50(14), 2257–2269. DOI: 10.1080/00032719.2017.1279172.