
ABSTRACT
Pingwu Fuzhuan brick tea (PWT), a distinctive post-fermentation tea originated from Pingwu region of Sichuan province in China, is a popular “western road” border-selling tea. In this study, we investigated characteristics and chemical compositions of PWT, together with comparing its physicochemical properties with other regions of Fuzhuan brick teas (FBTs). Firstly, inductively coupled plasma mass spectrometry (ICP-MS) was used to determine the geographical origin of FBTs, and the profiles of mineral elements were subjected to principal component analysis (PCA) to evaluate the differences among FBTs. Results from ICP-MS showed that the compositions of mineral elements from PWT, Hunan FBT (HNT), Shaanxi FBT (SNT), and Guizhou FBT (GZT) were distinctly different. The four different types of FBTs were clearly distinguished according to the results of PCA. Furthermore, all FBT samples were assessed for physicochemical properties and heatmap method was applied to data analysis. It was found that the total colour difference was highly distinct when compared PWT with HNT, SNT and GZT. Moreover, most of contents of biochemical compounds (gallic acid, catechins, free amino acids, alkaloids and volatile components) in PWT were lower compared to others except for total essential amino acids, GABA, aldehydes and acids.
Introduction
Tea has been the second popular non-alcoholic beverage behind water for a long history, which could be classified into six types based on the increasing degree of fermentation, including unfermented tea (green tea), slightly fermented tea (white tea), lightly fermented tea (yellow tea), semi-fermented tea (oolong tea), fully fermented tea (black tea) and post-fermented tea (dark tea).[Citation1,Citation2] Unlike semi-fermented and fully fermented teas produced by enzymatic oxidation process, post-fermented tea is a kind of microbial fermented tea in which a pile fermentation treatment allows microorganisms induce auto-oxidation and non-enzymatic auto-oxidation to complete the process.[Citation3] Microbial activities play an important role in the process of post-fermentation, which directly influence the quality and flavour of dark tea.[Citation4]
Dark tea, produced by older, coarse and rough leaves of camellia sinensis var. sinensis and C. sinensis var. assamica, is of great interest with health-promoting functions such as anti-hyperlipidemic, anti-obesity, antibacterial, antioxidant, and fat deposition inhibition and so on.[Citation2,Citation5] As a main kind of dark tea, Fuzhuan brick tea (FBT) is well-known as border-selling tea or border-tea, which is special to the ethnic minorities to drink. Moreover, FBT is one of the life necessities to the ethnic groups living in the border of south-western and north-western China where vegetables and fruits were scarce.[Citation3] In general, the manufacturing process of FBT includes steaming, piling, pressing, fungal fermentation and drying. The “golden flora” appeared on the surface and in the inside of FBT was produced by the dominant propagation of Eurotium spp. under the appropriate temperature and moisture conditions at the end of the fermentation stage. It has been reported that the “golden flora” formation is considered as the unique and key stage to produce the characteristic aroma and flavour of FBT.[Citation3,Citation6]
FBT is traditionally produced in Hunan, Sichuan, Shaanxi and Guizhou provinces of China. FBT obtained from Pingwu region of Sichuan province in China is regarded as the “western road” border-tea. As a unique kind of dark tea, FBT has attracted considerable research attention. Nevertheless, the previous study mainly focused on the variations of one or several biochemical components during FBT processing[Citation5,Citation7] and the comparison of difference between dark tea and other types of tea[Citation8,Citation9] and components purification.[Citation10] To date, few studies have been paying attention to identify the origin of different FBTs. In addition, the characteristic comparisons among Pingwu FBT (PWT) and other types of FBTs were also barely systematically investigated.
A series of studies have conducted on product traceability by analysing mineral elements.[Citation11] It is well established that volatile compounds, tea polyphenol, amino acids, caffeine contents of tea and colour difference of infusion are main factors to influence the tea quality.[Citation4,Citation12] In order to distinguish PWT from Hunan FBT (HNT), Shaanxi FBT (SNT) and Guizhou FBT (GZT), inductively coupled plasma mass spectrometers (ICP-MS) was applied to analyse minerals content and principal component analysis (PCA) was used to distinguish samples from other regions. Furthermore, biochemical compounds of four different types of FBTs were also determined to classify the characteristic of PWT with others in the present study.
Materials and methods
Materials and reagents
PWT, HNT, SNT and GZT were obtained from Pingwu Xuebaoding Cha Industry Development Co., Ltd (Pingwu county of Sichuan province, China), Hunan Shen’s tea manufacturing Co., Ltd (Anhua county of Hunan, China), Xianyang Jingwei Fu tea Co., Ltd (Qindu district of Xianyang city of Shaanxi province, China) and Guizhou Fanjin tea Industry Co., Ltd (Songtao county of Guizhou province, China), respectively. Twelve of tea samples of special grade were produced on April, 2014.
Nitric acid (65% w/w), hydrogen peroxide (30% w/w) and methanol for mobile phase were of analytical grade, guaranteed grade and HPLC grade respectively, respectively. Multi-element standard stock solution containing 27 mineral elements (10 mg/L of Li, Be, Na, Mg, Al, K, Ca, V, Cr, Mn, Fe, Co, Ni, Cu, Zn, Ga, As, Se, Rb, Sr, Ag, Cd, Cs, Ba, Tl, Pb and U), internal standard solution (10 mg/L of In) and tuning solution (1 μg/L of Ce, Co, Li, Mg, Tl and Y) were purchased from Agilent Technologies Inc (Cal, USA). Gallic acid (GA), epigallocatechin (EGC), catechin (C), epigallocatechin gallate (EGCG), epicatechin (EC), epicatechin gallate (ECG), caffeine, theobromine and theophylline were purchased from Sigma-Aldrich Co. (St. Louis, Mo, USA). A standard solution of 18 amino acids was obtained from Membrapure GmbH, (Berlin, Germany) and L-theanine (Thea) was provided by Shanghai Jinsui biotechnology Co., Ltd (Shanghai, China). All other chemicals and reagents used were of analytical grade.
Analysis of mineral elements
The treatment of FBT samples before mineral elements determination referred to previous methods with some modification.[Citation13] All poly tetra fluoroethylene (PTFE) digestion tubes and glassware were soaked in 10% HNO3 overnight and rinsed with ultrapure water. A total of 0.4 g of FBT samples, 5 mL of 65% nitric acid and 1 mL of 30% H2O2 were placed into PTFE digestion tube. Then, the samples were microwaved as following program: 120°C for 10 min, 160°C for 10 min and 180°C for 10 min. The mixtures were diluted to 10 mL with ultrapure water.
Data quantification was achieved with reference to matrix-matched. Multi-element standards containing 10 mg/L of 27 elements were dissolved in 5% HNO3 and calibration plots were constructed by plotting peak areas against the corresponding elements in the range of 0.2 μg/L to 10 mg/L. The quantification results were performed as μg/g FBT leaves. Argon (99.99%) and helium were used as ultrapure grade carrier. Elements measurements were performed using the inductively coupled argon plasma atomic emission spectroscopy method with an Agilent 7700× device (Agilent, Cal, USA). The general setting of 7700× system was as follows: RF power, 1550 W; reflected power, < 20 W; plasma gas flow, 10 L/min; auxiliary gas flow, 1 L/min; carrier gas, 1 L/min; dilution gas flow, 1 L/min, spray chamber temperature, 2°C; nebulizer pump, 0.3 r/s; integration time, 0.3 s. Samples were analysed five times in total. The parameter sitting of ICP-MS was conducted according to previous determination which also used the same instrument.[Citation14]
Analysis of GA, catechins and alkaloids
The preparation of samples and determination of GA, catechins, and alkaloids were performed as described previously with some modification.[Citation7,Citation9] The qualitative analysis of all samples was carried out by a Shimadzu LC-6AD apparatus with a Shimadzu CBM-20A Diode Array Detector, coupled the Inertisil ODS-4 column (5 μm, 4.6 mm × 250 mm, 30 °C; GL-science Inc., Tokyo). Tea samples (2.5 g) were extracted with 100 mL of methanol solution (70%, w/w) at room temperature for 24 h with continuous stirring. The solution filtered through 0.22 μm nylon membrane was used for HPLC analysis. Two solvents were applied for elution: mobile phase A – water/formic acid (100:0.1, v/v) and mobile phase B – methanol. Gradient elution condition was programmed as follows: 0–20% B from 0 to 20 min, 20%–25% B from 20 to 40 min, 25%–40% B from 40 to 45 min, 40%–45% B from 45 to 55 min, 45%–100% B from 55 to 60 min and kept at 100% B from 60 to 75 min. The flow rate was kept at 0.8 mL/min. The sample injection volume was 20 μL and the UV detection wavelength was set at 280 nm. The chromatographic peaks of the analytical samples were confirmed by comparing their retention time and UV spectra with those of standard compounds. Quantification of GA, catechins and alkaloids in tea samples was achieved by a calibration curve obtained with individual corresponding standard compound. The calibration plots were constructed with six concentration levels and results were shown as mg/g FBT leaves.
Determination of volatile components
The determination of volatile components with headspace solid-phase microextraction/gas chromatography-mass spectrometry (HS-SPME/GC-MS) was conducted according to previous report.[Citation15] Briefly, tea samples (1 g) were infused with 5 mL boiling water, stirred at 60°C for 30 min, and followed by extraction using a 50 μm of SPME fibre coated with DVB/CAR/PDMS (Supelco, Sigma Aldrich, St. Louis, Mo., USA) for 30 min. Volatile compounds analysis was performed using the gas chromatograph-mass spectrograph (GCMS-QP2010 SE, Shimadzu, Japan) at 70 eV over 35–400 amu. Compounds were separated with the RTX-5Sil MS capillary column (0.25 μm × 0.25 mm × 30 m) with helium (> 99.99%) as the carrier gas at 1.0 mL/min. The desorption condition was set at 240°C for 5 min and the temperature program was as follows: initially 40°C for 3 min, raised to 85°C at 3°C/min and held for 3 min, then increased to 160°C at 3°C/min, finally increased at 10°C/min to 240°C and held for 5 min. The temperature of the interface port from GC to MS and the iron source was 280°C and 230°C, respectively. The identification of volatile components was based on comparing retention indices (RI) with the published data in NIST 14 library search system and contents of volatile components (%) were shown as relative content.
Determination of free amino acids
Tea sample preparation was conducted according to the previous report.[Citation16] Analysis of free amino acids in tea samples was performed using an automatic amino-acid analyser (A300, Membrapure GmbH, Germany). The contents of free amino acids were determination by the peak area of multi-amino acids standards and performed as μg/g FBT leaves.
Analysis of colour difference of tea infusion
The colour analysis was conducted as described previously.[Citation17] Tea samples (2 g) were extracted with 100 mL of freshly boiling distilled water for 10 min. After centrifuged at 12000 r/min for 15 min, the supernatants were obtained and analysed by a spectrophotometer (CM-5, Konica Minolta Optics, Inc., Japan). The L*, a* and b* values of CIE-Lab space were determined using distilled water as control for errors diminishing.
Data analysis
All determinations were performed in triplicate and results were expressed as the mean value ± standard deviation (SD). Significant differences were calculated by Duncan’s test (p < .05) using SPSS 20.0 (SPSS Inc., Chicago, IL, USA). Principal component analysis (PCA) was performed to distinguish different regions of origin using SIMCA-P V14.1 software (Umetrics AB, Umea, Sweden). All data for heatmap was normalized using Z-scores and a heat map was generated using R (version 3.5.1) with heatmap package.
Results and discussion
Mineral elements content and PCA analysis
Minerals elements can be used to trace the geographical origin of teas.[Citation11] The calibration and content levels for 27 elements were shown in Table S1 and Table S2 (see supplementary materials), respectively. It was found that FBTs contained diverse elements over a wide concentration. The level of K (16809.47 μg/g) was the highest in FBT samples, whereas the lowest one is that of Ag (0.01 μg/g). Macro elements such as K, Mg, Al and Ca were all abundant in FBTs. Meanwhile, Mn and Fe, as micro elements, were also abundant in FBTs. The results were in accordance with the previous reports including green tea[Citation18], white tea[Citation13], black tea[Citation19] and dark tea[Citation11]. Furthermore, the concentrations of Cr, Cd and As in all tea samples were below the limited contents according to the reference of NY659-2003, and the Pb content was below the GB 2762–2017 “contaminant limit in food”. For PWT, the contents of Be, K, Cr, Cu, Zn, Se, Rb, Cd and U were almost at a lowest level of all samples or slightly higher (p > .05). The contents of Mg, Ca, V, Fe, Ni, Ga, As, Sr, Ag, Ba and Tl were almost at a highest level of all samples or slightly lower (p > .05). The contents of Li and Ag had no significant difference among all FBT samples.
In order to distinguish PWT from other three origins, PCA was used. PCA is a kind of unsupervised method, which can show reliable multivariable consequence in geographic origin traceability.[Citation7] It was obvious that PWT could be well distinguished from other regions of FBTs based on the concentrations of 27 mineral elements (). Tea samples from the same region clustered together. Meanwhile, the first principal component t[Citation1] and the second principal component t[Citation2] could display 0.414 and 0.281 of variation among tea samples, respectively. Tea samples changed along with the vector of t[Citation1] from left to right as PWT, GZT, HNT, SNT. Although tea samples could be performed well by t[Citation1], the otherness of FBT were still significant as the t.[Citation2] These consequences suggested that it was realizable to distinguish PWT tea from other regions FBTs by PCA.
Figure 1. Principal component analysis (PCA) model displaying separation related to origins based on 27 minerals. PWT, Pingwu Fuzhuan brick tea; HNT, Hunan Fuzhuan brick tea; SNT, Shaanxi Fuzhuan brick tea; GZT, Guizhou Fuzhuan brick tea. R2X[Citation1] refers to the fraction of explained variation in principal component 1 (t[Citation1]) and R2X[Citation2] the fraction of explains variation in PC2 (t[Citation2])
![Figure 1. Principal component analysis (PCA) model displaying separation related to origins based on 27 minerals. PWT, Pingwu Fuzhuan brick tea; HNT, Hunan Fuzhuan brick tea; SNT, Shaanxi Fuzhuan brick tea; GZT, Guizhou Fuzhuan brick tea. R2X[Citation1] refers to the fraction of explained variation in principal component 1 (t[Citation1]) and R2X[Citation2] the fraction of explains variation in PC2 (t[Citation2])](/cms/asset/1a8c346e-7df0-4e1a-8c99-f4e8dfc2e256/ljfp_a_1614951_f0001_oc.jpg)
Colour difference analysis of tea infusion
The colour factors L*, a* and b* represent lightness (black-white component), redness (+red to -green component) and yellowness (+yellow to -blue component), respectively.[Citation20] The L* value of FBTs ranged from 70.62 to 83.60 (). It was obvious that the L* value of PWT was slightly lower than that of GZT, but higher than those of HNT and SNT. The b* value of PWT were significantly (p < .05) lower compared to other FBT samples. The a* value of PWT was slightly higher than that of GZT, but lower than those of HNT and SNT. The colour factor TCD, applied to distinguish the visual perception of samples, can be analytically classified into three types: TCD < 1.5 means small difference, 1.5 < TCD < 3 means distinct and TCD > 3 means highly distinct.[Citation20] When the TCD value of PWT was set as a reference (TCD = 0), the TCD values of HNT, SNT and GZT were detected to be 18.52, 23.58 and 3.87, respectively. It was found that the total colour difference was highly distinct when compared PWT with HNT, SNT and GZT.
Table 1. Physicochemical properties of PWT, HNT, SNT and GZT
Analysis of GA and catechins
It has been reported that GA could be produced by the degradation of galloyl catechins and/or gallotannins. With the increasing degree of fermentation, GA continued to degrade to some simple phenols such as 2,5-dihydroxybenzoic acid, phloroglucinol and pyrogallol.[Citation5] As shown in , the content of GA in PWT was comparable to HNT (p > .05), but lower compared to SNT and GZT (p < .05).
Catechins with an astringency taste were the most abundant in green tea compared with other types of teas.[Citation8] During the fermentation process of FBT, catechins were degraded into the B ring fission catechins derivatives and polymerize into theaflavin derivatives with the effect of oxidative polymerization, which were induced by the microorganisms and the extracellular enzymes released by the microorganisms. This changes of catechins were able to reduce coarse astringency and darken the tea infusion colour, which improved the quality and taste of FBT.[Citation5] Catechins (EGC, C, EGCG, EC and ECG) have been regarded as the major phenols in all kinds of teas.[Citation8] The contents of five major catechins in FBT samples were determined with HPLC analysis (Fig. S1, see supplementary materials), and the results were shown in . EGC and EGCG have been reported to be the major catechins in the final FBT samples.[Citation5] The level of EGC in PWT (4.55 mg/g) was higher than in HNT (2.47 mg/g), but lower than in SNT (15.94 mg/g) and GZT (9.17 mg/g). EGCG ranged from 0.35 mg/g in HNT to 23.23 mg/g in SNT. The EGCG content of PWT was comparable to that of HNT (p > .05), but was significantly lower (p < .05) compared to SNT and GZT. The levels of C, EC and ECG in PWT were significantly lower than the corresponding levels in SNT and GZT (p < .05). These might be resulted from different raw leaves, manufacturing process, degree of fermentation and microorganism varieties. The contents of total catechins ranged from 4.55 to 54.78 mg/g in FBT samples, which were comparable to those from the previous reports.[Citation21]
Alkaloids analysis of FBT
The purine alkaloids in teas are typically represented by caffeine, theobromine and theophylline.[Citation22] Caffeine is a well-known stimulant and regarded as the main metabolite in teas.[Citation23] As shown in , caffeine was the most abundant alkaloid in FBTs ranging from 11.68 to 12.58 mg/g. In general, the content of caffeine in dark tea was lower than that in green tea, oolong tea and black tea.[Citation9] The probably reason is that the contents of caffeine increased at the early fermentation stage, and decreased gradually during the late fermentation stage due to the breeding of moulds.[Citation7] The contents differed significantly between the lowest levels of 12.56 mg/g in PWT and 11.68 mg/g in GZT with the highest level of 23.36 mg/g in SNT. However, HNT showed the moderate level of caffeine (16.85 mg/g). The caffeine content of these samples was also comparable to those from previous studies in FBT (27.51 mg/g) and pu-erh tea (30.92 mg/g).[Citation21] Like caffeine, theobromine also contributes to tea’s stimulant property and was regarded as the precursor of caffeine during the biosynthesis in tea.[Citation24] The contents of theobromine in PWT (0.15 mg/g) was equal to that in HNT (0.19 mg/g) and GZT (0.15 mg/g) (p > .05), and lower than that in SNT (0.51 mg/g) (p < .05). The similar pattern was followed by theophylline with lower levels ranging from 0.07 to 0.42 mg/g in four kinds of FBT samples. The theophylline contents of the four regions FBT followed by the order of SNT, GZT, PWT and HNT (p < .05). The theophylline content was also comparable to those from pu-erh tea with a lower level (0–2 mg/g).[Citation25]
Free amino acids analysis
In this study, free amino acids from PWT and other three regions FBTs were qualitatively and quantitatively analysed. As shown , significant differences in total free amino acids were observed among the four kinds of FBT (p < .05). SNT had the highest content of total free amino acids (2625.99 μg/g), followed by PWT (1480.33 μg/g), GZT (419.33 μg/g) and HNT (297.82 μg/g) with a significant difference (p < .05). Some studies showed that amino acids on pu-erh teas were more abundant than that in FBT.[Citation12,Citation16] However, there was a diverse result in another report.[Citation26] These could be attributed to the different tea varieties and fermentation process. The contents of total amino acids decreased sharply between the before and the after fermentation as a result of Maillard reaction and enzymatic conversion.[Citation16]
Table 2. Contents of amino acids in PWT, HNT, SNT and GZT (μg/g)
According to the chemical structure and biological activity, different amino acids commonly are divided to two groups of essential amino acids and non-essential amino acids. The total essential amino acids content in the four kinds of FBT ranged from 17.33 to 233.66 μg/g, and SNT had the highest total essential amino acids content (233.66 μg/g). PWT contained significantly (p < .05) higher level of total essential amino acids (217.33 μg/g) than HNT (17.33 μg/g) and GZT (29.66 μg/g), but a little lower compared to SNT (233.66 μg/g). The same pattern was observed for the total non-essential amino acids with levels ranging from 1001.00 μg/g in SNT to 166.82 μg/g in HNT. The total non-essential amino acids followed a similar trend with higher level in PWT (559.01 μg/g) compared to HNT and GZT (221.67 μg/g).
Amino acids play an important role in the taste of tea. Bitter amino acids contain Val, Ile, Leu, Phe, Trp, Lys and Tyr. Sweet amino acids are characterized by Thr, Pro, Ser, Gly and Ala. In addition, Asp, Asn, Glu and Thea belong to umami amino acids.[Citation27] Among essential amino acids, PWT had the highest level of Thr (101.00 μg/g). Val, Ile, Leu, Phe and Trp with higher levels in PWT compared to HNT and GZT, and were found in lower concentrations in PWT compared to SNT. The level of Lys in PWT was significantly lower compared to SNT (p < .05), but comparable to GZT (p > .05). The levels of Asp, Ser, Glu, Ala, Tyr and Arg in PWT were significantly lower than the corresponding levels in SNT (p > .05). It was noted that Asn was only detected in PWT and His was not detected in PWT but existed in SNT and GZT with a low concentration.
Thea was a unique amino acid that only existed in tea and contained more in unfermented teas with a brothy sweet umami taste. The previous work has reported that Thea counteracts the stimulatory of caffeine and has a positive effect on attention in human electroencephalography study.[Citation23] Thea was present in all of FBT samples ranging from 7.67 to 1169.00 μg/g, and SNT showed the highest content of Thea (). The level of Thea in PWT was detected to be 172.33 μg/g, which was higher than that in HNT (7.67 μg/g) and GZT (97.67 μg/g). This huge difference of Thea content in various regions can attribute to the difference of raw leaves and manufacturing process such as fermentation process, microorganism species and fermentation degree. Interestingly, the Thea content in PWT was much higher compared to pu-erh ripened tea samples with a range of 4–38 μg/g.[Citation28]
GABA, which is a major inhibitory neurotransmitter in the central nervous system, can be produced in fresh tea leaves under anaerobic conditions.[Citation29] GABA is primarily produced by microorganism and the biosynthesis of GABA is one step reaction of decarboxylating glutamate to GABA, catalysed by glutamate decarboxylase.[Citation30] In this study, PWT was found to show the most abundant GABA (531.67 μg/g), followed by SNT (222.33 μg/g), HNT (106.00 μg/g) and GZT (70.33 μg/g), respectively. Compared with previous studies on other types of tea, the level of GABA in PWT was much higher than pu-erh tea, green tea, black tea, oolong tea and white tea.[Citation29] The possible reasons were due to raw leaves and microorganism.
Volatile component
The complete list of identified aroma volatiles in four regions FBTs is presented in Table S4 (see supplementary materials). A total of 188 volatiles were detected from four regions FBTs containing 40 ketones, 29 aldehydes, 29 alcohols, 14 esters, 61 hydrocarbons, 4 phenols and methoxyphenols, 4 acids and others which can not be classified or identified in database (NIST 14 library). The ratio of every category in each tea sample was performed in . For PWT, its volatiles were consisted of 21.64% of ketones, 41.43% of aldehydes, 10.64% of alcohols, 1.86% of esters, 8.03% of hydrocarbons, 0.45% of acids and 15.95% of others, respectively. Aldehydes, ketones and alcohols were main constituents in all FBT samples and at 73.71% in PWT. The above result was similar to previous reports.[Citation31] In addition, another work on pu-erh tea showed that the levels of methoxyphenols, alcohols and aldehydes took up a signification proportion.[Citation32]
Figure 2. Volatile compositions in PWT, HNT, SNT and GZT. PWT, Pingwu Fuzhuan brick tea; HNT, Hunan Fuzhuan brick tea; SNT, Shaanxi Fuzhuan brick tea; GZT, Guizhou Fuzhuan brick tea
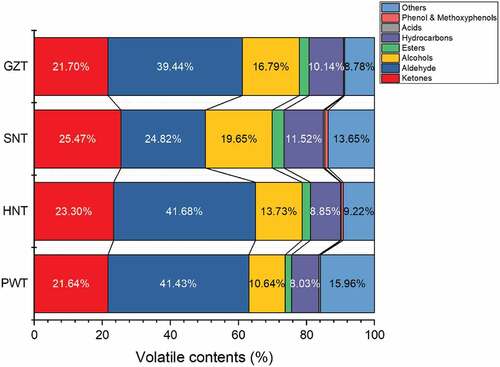
Aldehydes constitute the most dominant chemical group presented in the four kinds of FBT samples: PWT (41.43%), HNT (41.68%), GZT (39.44%) and SNT (24.82%). The proportion of aldehydes in PWT was comparable to HNT and was higher compared to SNT and GZT. The numbers of aldehydes in PWT (29) was more than HNT (27), SNT (23) and GZT (27). During the process of post-fermentation, aldehydes substitute was generated by oxidation and hydrolysis of fatty acids and decarboxylation and oxidative deamination of amino acids.[Citation31] Predominant aldehyde in PWT was found to (E,E)-2,4-heptadienal measured at 13.98%, followed by hexanal (5.58%), (E)-2-octenal (2.23%), 1-nonanal (3.04%), octanal (2.23%) and benzaldehyde (2.03%). Similar to the previous report,[Citation32] (E,E)-2,4-heptadienal at a favour of “grassy” was the most abundant compound among all of aroma volatiles in PWT and all other FBT samples. Levels of the other major aldehydes in HNT, SNT, and GZT were equal to PWT, and it was worth noting that the contents of these components in SNT were obviously lower than that in other FBT samples.
Second to aldehydes, ketones were also a vital group of aroma volatiles and had a similar proportion in four regions FBTs (3.25%–4.25%). Predominant ketones found in PWT were 3,5-Octadien-2-one measured at 3.56%, 6,10-dimethyl-5,9-undecadien-2-one measured at 2.71%, (E)-β-ionone measured 1.26% and α-ionone measured at 0.94%. The similar pattern was observed in the other FBT samples. It is well known that these ketones provide a floral, fruity and woody odour. It is worth noted that β-ionone can affect the flavour of teas with its low human odour perception thresholds.[Citation33] These ketones were likely to be converted by the oxidation and condensation of carotenoids and oxidative break down products of β-carotene with the activity of Eurotium spp. in manufacturing process.[Citation34]
The contents of alcohols in PWT (10.64%) were lower in comparison with HNT (13.73%), SNT (19.65%) and GZT (16.79%), and the most abundant compounds were linalool, linalool oxide and 2-ethylhexanol, which provide a floral flavour. Linalool and linalool oxide accounted for 1.775% and 0.93% of PWT volatile components, respectively, present at higher levels in HNT (2.18, 2.51%), SNT (7.42%, 2.65%) and GZT (4.16%, 2.89%). It was noted that linalool was present at higher level in these FBT samples than other alcohols, whereas the content of linalool was far lower compared to green tea[Citation35], oolong tea[Citation36] and black tea.[Citation37]
Heatmap analysis
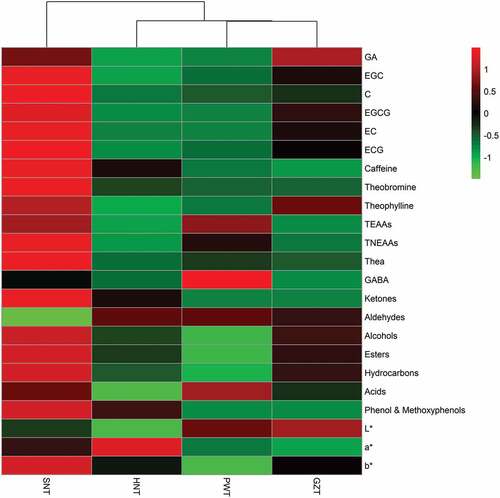
Heatmap was applied to provide intuitive visualization of the chemical compounds contrast in four regions FBTs. Prior to analyse by the R programming language, all data were centered and normalized by Z-score normalization. presented the results of 23 factors and illustrated the arrangements of the clusters of samples and compounds. The red colour in the figure represents a higher content than the mean value, while the green shows the opposite. By comparing the variation in colour intensity for the samples, it was found that the most contents of biochemical compounds in PWT were lower compared to HNT, SNT and GZT except total essential amino acids, GABA, aldehydes, acids and L* value.
Figure 3. Heatmap of the contents of 23 chemicals in FBTs. The colour of box represents the value of (x – μ)/SD; x, the constituent level in individual tea samples; μ, the average level of constituents in four FBT samples; SD, the standard deviations of constituents in four types of FBT samples
Conclusion
The case study comparatively evaluated the physiochemical properties of PWT relative to HNT, SNT and GZT. According to ICP-MS and PCA analysis, the four types of FBTs were objectively and successfully distinguished. Total colour difference was highly distinct among the FBT samples. The level of total catechins in PWT was significantly higher compared to HNT, but far lower than SNT and GZT. PWT had significantly lower levels of caffeine, theobromine and theophylline compared to the other FBTs. SNT had the highest content of total free amino acids, followed by PWT, GZT and HNT with a significant difference, meanwhile the same pattern was observed for Thea. Interestingly, PWT was found to possess the most abundant GABA. Results of HS-SPME/GC-MS indicated that the main volatiles were aldehydes, ketones and alcohols in all the FBT samples, and the major constituent was found to be (E,E)-2,4-heptadienal in PWT. Heatmap analysis visually showed the different characteristics of four kinds of FBTs. Our results may confirm the previous suggestions and observations on chemical differences of FBTs from different geographical origins.
Conflict of interest
The authors declare no conflict of interest currently.
Supplemental Material
Download MS Word (60.4 KB)Supplementary material
supplemental data for this article can be accessed here.
Additional information
Funding
References
- Li, Q.; Huang, J.; Li, Y.; Zhang, Y.; Luo, Y.; Chen, Y.; Lin, H.; Wang, K.; Liu, Z. Fungal Community Succession and Major Components Change during Manufacturing Process of Fu Brick Tea. Sci. Rep. 2017, 7(1), 6947. DOI: 10.1038/s41598-017-07098-8.
- Zheng, W.-J.; Wan, X.-C.; Bao, G.-H. Brick Dark Tea: A Review of the Manufacture, Chemical Constituents and Bioconversion of the Major Chemical Components during Fermentation. Phytochem. Rev. 2015, 14(3), 499–523. DOI: 10.1007/s11101-015-9402-8.
- Xu, A.; Wang, Y.; Wen, J.; Liu, P.; Liu, Z.; Li, Z. Fungal Community Associated with Fermentation and Storage of Fuzhuan Brick-Tea. Int. J. Food Microbiol. 2011, 146(1), 14–22. DOI: 10.1016/j.ijfoodmicro.2011.01.024.
- Lv, S.; Wu, Y.; Li, C.; Xu, Y.; Liu, L.; Meng, Q. Comparative Analysis of Pu-Erh and Fuzhuan Teas by Fully Automatic Headspace Solid-Phase Microextraction Coupled with Gas Chromatography-Mass Spectrometry and Chemometric Methods. J. Agric. Food Chem. 2014, 62(8), 1810–1818. DOI: 10.1021/jf405237u.
- Zhu, Y. F.; Chen, J. J.; Ji, X. M.; Hu, X.; Ling, T. J.; Zhang, Z. Z.; Bao, G. H.; Wan, X. C. Changes Of Major Tea Polyphenols And Production Of Four New B-Ring Fission Metabolites Of Catechins From Post-Fermented Jing-Wei Fu Brick Tea. Food Chem. 2015, 170, 110–117. DOI: 10.1016/j.foodchem.2014.08.075.
- Peng, Y.; Xiong, Z.; Li, J.; Huang, J. A.; Teng, C.; Gong, Y.; Liu, Z. Water Extract of the Fungi from Fuzhuan Brick Tea Improves the Beneficial Function on Inhibiting Fat Deposition. Int. J. Food Sci. Nutr. 2014, 65(5), 610–614. DOI: 10.3109/09637486.2014.898253.
- Xu, J.; Hu, F. L.; Wang, W.; Wan, X. C.; Bao, G. H. Investigation on Biochemical Compositional Changes during the Microbial Fermentation Process of Fu Brick Tea by LC-MS Based Metabolomics. Food Chem. 2015, 186, 176–184. DOI: 10.1016/j.foodchem.2014.12.045.
- Wang, K.; Liu, F.; Liu, Z.; Huang, J.; Xu, Z.; Li, Y.; Chen, J.; Gong, Y.; Yang, X. Comparison of Catechins and Volatile Compounds among Different Types of Tea Using High Performance Liquid Chromatograph and Gas Chromatograph Mass Spectrometer. Int. J. Food Sci. Technol. 2011, 46(7), 1406–1412. DOI: 10.1111/j.1365-2621.2011.02629.x.
- Zuo, Y. G.; Chen, H.; Deng, Y. W. Simultaneous Determination of Catechins, Caffeine and Gallic Acids in Green, Oolong, Black and Pu-Erh Teas Using HPLC with a Photodiode Array Detector. Talanta. 2002, 57, 307–316. DOI: 10.1016/S0039-9140(02)00030-9.
- Ling, T. J.; Wan, X. C.; Ling, W. W.; Zhang, Z. Z.; Xia, T.; Li, D. X.; Hou, R. Y. New Triterpenoids And Other Constituents From A Special Microbial-Fermented Tea-Fuzhuan Brick Tea. J. Agric. Food Chem. 2010, 58(8), 4945–4950. DOI: 10.1021/jf9043524.
- McKenzie, J. S.; Jurado, J. M.; de-Pablos, F. Characterisation of Tea Leaves according to Their Total Mineral Content by Means of Probabilistic Neural Networks. Food Chem. 2010, 123(3), 859–864. DOI: 10.1016/j.foodchem.2010.05.007.
- Liang, Y.; Zhang, L.; Lu, J. A Study on Chemical Estimation of Pu-Erh Tea Quality. J. Sci. Food Agric. 2005, 85(3), 381–390. DOI: 10.1002/(ISSN)1097-0010.
- Ye, X.; Jin, S.; Wang, D.; Zhao, F.; Yu, Y.; Zheng, D.; Ye, N. Identification of the Origin of White Tea Based on Mineral Element Content. Food Anal. Meth. 2016, 10(1), 191–199. DOI: 10.1007/s12161-016-0568-5.
- Mohd-Taufek, N.; Cartwright, D.; Davies, M.; Hewavitharana, A. K.; Koorts, P.; Shaw, P. N.; Sumner, R.; Lee, E.; Whitfield, K. The Simultaneous Analysis of Eight Essential Trace Elements in Human Milk by ICP-MS. Food Anal. Methods. 2016, 9, 2068–2075. DOI: 10.1007/s12161-015-0396-z.
- Guo, H.; Yang, X.; Zhou, H.; Luo, X.; Qin, P.; Li, J.; Ren, G. Comparison of Nutritional Composition, Aroma Compounds, and Biological Activities of Two Kinds of Tartary Buckwheat Tea. J. Food Sci. 2017, 82(7), 1735–1741. DOI: 10.1111/1750-3841.13772.
- Zhu, Y.; Luo, Y.; Wang, P.; Zhao, M.; Li, L.; Hu, X.; Chen, F. Simultaneous Determination of Free Amino Acids in Pu-Erh Tea and Their Changes during Fermentation. Food Chem. 2016, 194, 643–649. DOI: 10.1016/j.foodchem.2015.08.054.
- Jimenez-Zamora, A.; Delgado-Andrade, C.; Rufian-Henares, J. A. Antioxidant Capacity, Total Phenols and Color Profile during the Storage of Selected Plants Used for Infusion. Food Chem. 2016, 199, 339–346. DOI: 10.1016/j.foodchem.2015.12.019.
- Fernandez-Caceres, P. L.; Martin, M. J.; Pablos, F.; Gonzalez, A. G. Differentiation of Tea (Camellia Sinensis) Varieties and Their Geographical Origin according to Their Metal Content. J. Agric. Food Chem. 2001, 49(10), 4775–4779.
- Matsuura, H.; Hokura, A.; Katsuki, F.; Itoh, A.; Multielement Determination, H. H. And Speciation Of Major-to-Trace Elements In Black Tea Leaves By Icp-Aes And Icp-Ms With The Aid Of Size Exclusion Chromatography. Anal. Sci. 2001, 17(3), 391–398.
- Bellary, A. N.; Indiramma, A. R.; Prakash, M.; Baskaran, R.; Rastogi, N. K. Anthocyanin Infused Watermelon Rind and Its Stability during Storage. Innov. Food Sci. Emerg. Technol. 2016, 33, 554–562. DOI: 10.1016/j.ifset.2015.10.010.
- Lv, H. P.; Zhang, Y.; Shi, J.; Lin, Z. Phytochemical Profiles and Antioxidant Activities of Chinese Dark Teas Obtained by Different Processing Technologies. Food Res. Int. 2017, 100(Pt 3), 486–493. DOI: 10.1016/j.foodres.2016.10.024.
- Jeszka-Skowron, M.; Zgoła-Grześkowiak, A.; Frankowski, R. Cistus Incanus A Promising Herbal Tea Rich In Bioactive Compounds: Lc–Ms/Ms Determination Of Catechins, Flavonols, Phenolic Acids And alkaloids—A Comparison With Camellia Sinensis, Rooibos And Hoan Ngoc Herbal Tea. J. Food Compos. Anal. 2018, 74, 71–81. DOI: 10.1016/j.jfca.2018.09.003.
- Boros, K.; Jedlinszki, N.; Csupor, D. Theanine Caffeine Content of Infusions Prepared from Commercial Tea Samples. Pharmacogn. Mag. 2016, 12(45), 75–79. DOI: 10.4103/0973-1296.176061.
- Wang, X.; Wan, X.; Hu, S.; Pan, C. Study on the Increase Mechanism of the Caffeine Content during the Fermentation of Tea with Microorganisms. Food Chem. 2008, 107(3), 1086–1091. DOI: 10.1016/j.foodchem.2007.09.023.
- Qin, J. H.; Li, N.; Tu, P. F.; Ma, Z. Z.; Zhang, L. Change in Tea Polyphenol and Purine Alkaloid Composition during Solid-State Fungal Fermentation of Postfermented Tea. J. Agric. Food Chem. 2012, 60(5), 1213–1217. DOI: 10.1021/jf204844g.
- Horanni, R.; Engelhardt, U. H. Determination of Amino Acids in White, Green, Black, Oolong, Pu-Erh Teas and Tea Products. J. Food Compos. Anal. 2013, 31(1), 94–100. DOI: 10.1016/j.jfca.2013.03.005.
- Scharbert, S.; Hofmann, T. Molecular Definition of Black Tea Taste by Means of Quantitative Studies, Taste Reconstitution, and Omission Experiments. J. Agric. Food Chem. 2005, 53(13), 5377−5384. DOI: 10.1021/jf050294d.
- Chevallier, E.; Chekri, R.; Zinck, J.; Guérin, T.; Noël, L. Simultaneous Determination of 31 Elements in Foodstuffs by ICP-MS after Closed-Vessel Microwave Digestion: Method Validation Based on the Accuracy Profile. J. Food Compos. Anal. 2015, 41, 35–41. DOI: 10.1016/j.jfca.2014.12.024.
- Zhao, M.; Ma, Y.; Wei, Z. Z.; Yuan, W. X.; Li, Y. L.; Zhang, C. H.; Xue, X. T.; Zhou, H. J. Determination and Comparison of Gamma-Aminobutyric Acid (GABA) Content in Pu-Erh and Other Types of Chinese Tea. J. Agric. Food Chem. 2011, 59(8), 3641–3648. DOI: 10.1021/jf104601v.
- Dhakal, R.; Bajpai, V. K.; Baek, K. H. Production Of Gaba (γ - Aminobutyric Acid) By Microorganisms: A Revew. Braz. J. Microbiol. 2012, 1230–1241. doi:10.1590/S1517-83822012000400001.
- Xu, X.; Mo, H.; Yan, M.; Zhu, Y. Analysis of Characteristic Aroma of Fungal Fermented Fuzhuan Brick-Tea by Gas Chromatography/Mass Spectrophotometry. J. Sci. Food Agric. 2007, 87(8), 1502–1504. DOI: 10.1002/(ISSN)1097-0010.
- Cao, L.; Guo, X.; Liu, G.; Song, Y.; Ho, C. T.; Hou, R.; Zhang, L.; Wan, X. A Comparative Analysis for the Volatile Compounds of Various Chinese Dark Teas Using Combinatory Metabolomics and Fungal Solid-State Fermentation. J. Food Drug Anal. 2018, 26(1), 112–123. DOI: 10.1016/j.jfda.2016.11.020.
- Schuh, C.; Schieberle, P. Characterization of the Key Aroma Compounds in the Beverage Prepared from Darjeeling Black Tea: Quantitative Differences between Tea Leaves and Infusion. J. Agric. Food Chem. 2006, 54(3), 916–924. DOI: 10.1021/jf052495n.
- Wache, Y.; Bosser-DeRatuld, A.; Lhuguenot, J. C.; Belin, J. M. Effect of Cis/Trans Isomerism of β-Carotene on the Ratios of Volatile Compounds Produced During Oxidative Degradation. J. Agric. Food Chem. 2003, 51(7), 1984−1987. DOI: 10.1021/jf021000g.
- Lin, J.; Dai, Y.; Guo, Y. N.; Xu, H. R.; Wang, X. C. Volatile Profile Analysis and Quality Prediction of Longjing Tea (Camellia Sinensis) by HS-SPME/GC-MS. J. Zhejiang Univ-Sci. B. 2012, 13(12), 972–980. DOI: 10.1631/jzus.B1200086.
- Pripdeevech, P.; Machan, T. Fingerprint of Volatile Flavour Constituents and Antioxidant Activities of Teas from Thailand. Food Chem. 2011, 125(2), 797–802. DOI: 10.1016/j.foodchem.2010.09.074.
- Qin, Z.; Pang, X.; Chen, D.; Cheng, H.; Hu, X.; Wu, J. Evaluation of Chinese Tea by the Electronic Nose and Gas Chromatography–Mass Spectrometry: Correlation with Sensory Properties and Classification according to Grade Level. Food Res. Int. 2013, 53(2), 864–874. DOI: 10.1016/j.foodres.2013.02.005.