
 ?Mathematical formulae have been encoded as MathML and are displayed in this HTML version using MathJax in order to improve their display. Uncheck the box to turn MathJax off. This feature requires Javascript. Click on a formula to zoom.
ABSTRACT
This study aimed to analyze the effect of hydrogen peroxide decolorization on the structure and functional characteristics of tea meal protein to provide some theoretical basis for the utilization of tea meal protein. The changes in the protein structure and function before and after decolorization were evaluated by measuring denaturation temperature, surface hydrophobicity, and sulfhydryl content and by analyzing infrared spectrum, X-ray diffraction peak, and microstructure, etc. Results showed that decolorization with hydrogen peroxide increased the surface hydrophobicity, decreased the sulfhydryl content, and did not change the disulfide bond content. The treatment weakened the chemical bond strength but did not affect the basic skeleton structure. The microstructure as well as the position and intensity of the X-ray diffraction peak of the protein from Camellia oleracea seed cake remained the same before and after the treatment. The heat denaturation temperature also increased. Hydrogen peroxide did not change the isoelectric point; decreased the solubility, emulsifying properties, emulsion stability, foaming ability, and foam stability of the protein; and increased the oil and water holding capacities. Overall, decolorization with hydrogen peroxide did not significantly affect the protein structure but changed its functional properties.
Introduction
Camellia oleifera originates and is widely distributed in southern China.[Citation1] The seed is used to extract camellia oil, which is rich in unsaturated fatty acids and is used extensively as cooking oil and adjuvant medicine for burn injuries and stomach ache.[Citation2,Citation3] Defatted Camellia oleifera seed cake is a by-product of oil refinery of Camellia oleifera seeds and is traditionally used for animal feeds, detergent, organic fertilizers, or fuel. The defatted seed cake contains abundant bioactive compounds, such as polyphenols, saponins, proteins, and polysaccharides.[Citation4] The cake also contains 14–20% crude protein and 17 kinds of amino acids, 8 of which are essential.[Citation5] Hence, defatted Camellia oleifera seed cake could be a high-quality protein resource and has great development potential.
At present, defatted seed cake of Camellia oleifera can be obtained after high-temperature hot pressing. The crude protein extracted from the defatted seed cake is dark brown and contains high amounts of pigments. The presence of pigments is a major problem in isolation, purification, and structure identification of seed cake protein (SCP); as such, the applications of SCP are hindered. Therefore, pigments should be removed from SCP. However, few works have focused on decolorization of SCP.
Various chemical and physical processes, such as activated carbon adsorption[Citation6,Citation7], organic solvent method[Citation8,Citation9], exchange resin adsorption[Citation10], and hydrogen peroxide (H2O2) oxidation, are used for decolorization. In our previous research, physical adsorption methods, such as those using activated carbon and macroporous resin, exhibit poor decolorization effect on SCP. Meanwhile, H2O2 exerts obvious decolorization effect on SCP but recoloring of the protein is difficult. The optimum decolorization process includes decoloring temperature of 40°C, decoloring time of 60 min, and H2O2 content of 4%. Several scholars have studied the successful application of H2O2 for decolorization of polysaccharides from the leaves of Cyclocarya paliurus.[Citation11] The use of H2O2 is permitted for use in the food industry for various purposes, such as antimicrobial agent in starch and milk for cheese making and as bleaching agent in beef, tripe, and instant tea.[Citation12]
This study hypothesized that H2O2 was a strong oxidizing agent and decomposed nonferrous substances into low-molecular-weight aldehydes, carboxylic acids, and carbon dioxide to achieve satisfactory decolorization results. The main objectives were to evaluate the effect of H2O2 treatment on the structural and functional properties of SCP. Structural properties were evaluated by Fourier transform infrared spectroscopy (FT-IR), X-ray diffraction (XRD), and scanning electron microscopy (SEM) analyses. The functional properties of SCP, including water-holding capacity (WHC), oil-holding capacity (OHC), solubility, foamability, and emulsifiability, were determined. A comprehensive quality evaluation of the decolorized protein was conducted to provide a theoretical basis for processing SCP and developing of new products.
Materials and methods
Chemicals
Tris-(Hydroxymethyl)-aminomethane (Tris), sodium dodecyl sulfonate (SDS), dithiothreitol (DTT), and glycine were obtained from Beijing Suolaibao Technology Co., Ltd. (Beijing, China). 5,5′-Dithiobis-(2-nitrobenzoic acid) (DTNB) was acquired from Aladdin Biotechnology Co., Ltd. (Shanghai, China). Bovine serum albumin (BSA) was supplied by Germany BioFROXX Co., Ltd. (Beijing, China). All other chemicals and solvents were of the highest commercial grade and obtained from Guangzhou Chemical Reagent Co. Ltd. (Guangzhou, China).
Samples
Camellia oleifera seed cake was purchased from a factory in Zhongyuan Town, Qionghai City, Hainan Province, China. The sample was cut into small fractions, ground into fine powder in a high-speed disintegrator, and passed through a 60 mesh sieve.
Preparation of DSCP
The resulting powder of the seed cake was extracted with hexane for 24 h at room temperature to remove residual fatty acids. Decolorized seed cake protein (DSCP) was prepared by suspending the flour into distilled water (1:34, w/v), and the pH was adjusted to 10.0 by adding 1 mol/L NaOH after agitating for 1 h at 50°C. The solution was then added with 4% H2O2 for 1 h at 40°C, and the pH was adjusted to pH 3.5 by adding 1 mol/L HCl. The solution was incubated for 30 min and centrifuged at 5432 g for 30 min. The precipitate was washed three times with 80% ethanol and fractionated in distilled water by using 8000 Da molecular weight cut-off dialysis bags to enrich specific fractions. The solution was stirred gently for 48 h at 4°C, and water was changed every 4 h. The fractions in the dialysis bags were lyophilized in a vacuum freeze dryer. The dried DSCP was stored at −20°C in a refrigerator before measurements and treatments.
Surface hydrophobicity
Surface hydrophobicity was determined according to SDS binding method proposed by Mustapha et al.[Citation13] with some modification. About 1 mL of the SDS solution (0, 0.02, 0.04, 0.06, 0.08, and 0.1 mmol/L) was obtained and added with 20 mL of chloroform and 5 mL of 0.24 g/L methylene blue solution. The solution was centrifuged at 1157 g for 15 min. The mixture of SDS and methylene blue at the bottom was collected. Absorbance was recorded at the wavelength of 655 nm. The surface hydrophobicity of the protein was expressed as 1 mg of protein combined with SDS (µg/mg). The regression equation of absorbance (y) and SDS concentration (x) was y = 4.2386x-0.0168 (R2 = 0.9926).
About 10 mg of the sample was dissolved in 40 mL of 0.1 mmol/L SDS solution and stirred for 4 h at room temperature. The mixture was centrifuged at 3214 g for 10 min, and the supernatant was dialyzed for 36 h. Subsequently, 1 mL of the dialysate was mixed with 20 mL of chloroform. The chloroform layer was added with 5 mL of 0.24 g/L methylene blue solution. The mixture was mixed and centrifuged at 1157 g for 15 min. The mixture of SDS and methylene blue at the bottom was collected, and absorbance was recorded at the wavelength of 655 nm. Surface hydrophobicity was calculated using the following formula:
where A1 is the total SDS quality, A2 is the unbound SDS quality, and A3 is the sample quality.
Free and total sulfhydryl content
DTNB colorimetry was used to determine the content of free and total sulfhydryl of protein.[Citation14] The sample (0.05 g) was dissolved in 4 mL of 8 mol/L urea Tris–Gly solution (pH 8), stirred at room temperature for 1 h, and centrifuged at 10414 g for 15 min. The supernatant was obtained, and protein content was determined by biuret method.[Citation15]
Protein liquid sample (1 mL) was added with 5 mL of 8 mol/L urea Tris–Gly solution (pH 8) and 8 mL of 4 mg/mL DTNB and placed in a water bath at 25°C for 25 min. Absorbance (B) was recorded at the wavelength of 412 nm, and blank control was replaced by the protein sample solution with 8 mol/L urea Tris-Gly solution (pH 8). Free sulfhydryl content was calculated according to the following formula:
where FSC is the free sulfhydryl content, D is the dilution factor (D = 6.04 for free sulfhydryl content), ρ is the mass concentration of the protein sample (mg/mL), 73.53 is 106/(1.36 × 104), and 1.36 × 10⁴ is the molar extinction coefficient of Ellman reagent [L/(mol•cm)].
The liquid protein sample (0.6 mL) was added with 3 mL of 8 mol/L urea Tri–Gly solution (including 40 mmol/L DTT with pH 8). The mixture was placed in a water bath at 25°C for 1 h and added with 6 mL 12% TCA. The mixture was placed again in the water bath at 25°C for 1 h and then centrifuged at 3214 g for 10 min. The precipitate was washed four times with 12% TCA and dissolved in 9 mL of 8 mol/L urea Tris–Gly solution. The mixture was added with 0.09 mL of 4 mg/mL DTNB solution and placed in a water bath for 25 min at 25°C. Absorbance (B1) was recorded at the wavelength of 412 nm.
where TSC is the free sulfhydryl content, and D is the dilution factor (D = 16.15 for total sulfhydryl content determination).
Thermal denaturation temperature
Thermal denaturation temperature of protein was determined following the method described by Khatkar et al.[Citation16] with some modifications. In brief, 2 mg of the sample was spread on an aluminum box and placed in a differential scanning calorimeter (DSC). The sample was heated from 20°C to 180°C at a rate of 10°C/min under high-purity N2 atmosphere flowing at 50 mL/min.
SDS-PAGE analysis
SDS-PAGE was conducted according to the method of Lee et al.[Citation17] with slight modifications. A 0.1% solution of the sample was mixed with sample buffer (β-mercaptoethano, SDS, glycerol, bromophenol blue, Tris-HCl, pH 6.8) at a ratio of 1:1 and heated at 100°C for 4 min. The loading amount was set as 15 µL (marker loading is 10 µL). The voltage was set at 60 V when the sample entered 4% concentrated gel and set at 100 V when it entered 12% separation gel. The electrophoresis was terminated until bromophenol blue reached 1 cm at the bottom. The gels were stained with Coomassie brilliant blue R250 and methanol. The gels were then destained in a destaining solution and stored in 5% glycerol solution for imaging.
Amino acid composition
Analysis of amino acid composition was analyzed by automated amino acid analyzer (A300, Manmo Boer, Germany). In brief, 1 g of the sample was added with 6 mol/L HCl and phenol in a vacuum nitrogen-filled sealed tube at 110°C for 24 h. The volume of the solution was made up to 50 mL. About 1 mL of the hydrolysate was deacidified three times and lyophilized in vacuo. The hydrolysate was then dissolved in 0.1 mol/L HCl and tested by automatic amino acid analyzer.[Citation18]
FT-IR analysis
FT-IR analysis was performed at room temperature by using a Perkin–Elmer spectrometer (Lambda 750s; PerkinElmer Instruments, USA). FT-IR characterization was conducted according to the method of Kyomugasho et al.[Citation19] An accurately weighed amount (1 g) of the sample was mixed with 100 mg of dry KBr crystals and ground under infrared lamp irradiation. The mixture was compressed into a transparent sheet with appropriate diameter and thickness by using a tablet press and then subjected to FT-IR scan at 400–4000 cm−1 at a resolution of 8 cm−1.
SEM analysis
SEM characterization was conducted using a scanning electron microscope (S-3000; Hitachi Corporation, Japan) according to the method of Chen et al.[Citation20] with some modifications to observe the homogeneities and morphologies of SCP and DSCP. Images were collected at an accelerating voltage of 20.0 kV at 100× and 5000× magnification for SCP and DSCP, respectively.
XRD analysis
XRD patterns of the SCP and DSCP powders were recorded using a D/Max-200 diffractometer according to the method of Joshi et al.[Citation21] with some modifications. Diffractograms were collected between 2° and 55° (2θ) at a 0.025° step size with an exposure time of 0.5 s at each step.
Solubility
Accurately weighed 100 mg of the sample was mixed with distilled water (10 mL), and the pH was adjusted to 2–12. The mixture was shaken at room temperature for 30 min and centrifuged at 2057 g for 20 min. The supernatant was collected and analyzed by biuret method.[Citation15] The standard curve was obtained using y = 0.0365x-0.0011(R2 = 0.9997), where y represents the absorbance recorded at 540 nm, and x represents the protein concentration (mg/mL). Solubility was calculated according to the following formula:
where C1 is the percentage of protein in the supernatant, and C2 is the total protein content.
Emulsifying capacity and emulsifying stability
Emulsifying capacity of the sample was determined according to the method of Hung and Zayas.[Citation22] In brief, 6 mL of the protein solution (1% w/v) were mixed with 0.01 mol/L Tris–HCl buffer (pH 8) and 2 mL of soya bean salad oil. Then, the mixture was dispersed at 25,714 g for 1 min with an Ultra-Turrax T25 disperser. About 50 µL aliquots of the sample were collected and dissolved in 5 mL of 0.1% (w/v) SDS. Absorbance (A0) recorded immediately at 500 nm was used as an estimate of the emulsifying capacity. After 10 min, 50 µL aliquots of the sample were withdrawn and dissolved in 5 mL of 0.1% (w/v) SDS. After mixing, absorbance (A1) was recorded at 500 nm. Emulsifying capacity and emulsifying stability were calculated according to the following formula:
where C is the concentration of polypeptide before dilution (g/mL), ∅ is the optical path (1 cm), θ is the volume fraction of oil that organizes the emulsion (0.25), and DF is the dilution factor (100).
Foaming capacity and foaming stability
Foaming capacity and foaming stability of the sample were determined according to the method of Sathe and Salunkhe.[Citation23] Accurately weighed 50 mg of the sample was mixed with 0.01 mol/L Tris–HCl buffer (pH 8). Initial volume V0 was recorded, and Ultra-turrax T 25 disperser was used to disperse the mixture at 12857 g for 2 min. Volume V1 at this time was recorded. After placing for 30 min, volume V2 was recorded. Foaming capacity and foaming stability were calculated as follows:
Water-holding and oil-holding capacity
Water-holding capacity (WHC) and oil-holding capacity (OHC) were determined according to the method of Wang et al.[Citation24] with some modifications. Accurately weighed 100 mg of the sample (W0) was placed into a well-dried 10 mL centrifuge tube. The sample and the centrifuge tube were weighed (W1). The centrifuge tube was then added with 2 mL of deionized water (or oil). After shaking at room temperature for 30 min, the mixture was centrifuged at 2057 g for 10 min to remove water (or oil) from the upper layer of the tube. The centrifuge tube and the pellet were then weighed (W2). WHC and OHC of the sample were calculated as follows:
Statistical analysis
All experiments were conducted at least three times. Statistical software DPS9.5 and paired t-test were used to analyze the significance of differences in data. Origin8.5 was used to complete the drawing.
Results and discussion
Structural properties
As shown in , the surface hydrophobicity of decolorized seed cake protein (DSCP) treated by H2O2 was significantly higher (P< .05) than that of seed cake protein (SCP). H2O2 slightly expanded the protein structure and exposed some hydrophobic aromatic and aliphatic amino acid side chain groups inside the molecule in polar solutions. H2O2 promoted protein folding, thereby increasing the surface hydrophobicity[Citation25,Citation26], consistent with the results of Morze et al.[Citation27] The free and total sulfhydryl contents of DSCP were significantly lower (P< .05) than those of SCP, indicating that the decoloration of H2O2 caused the oxidation of protein sulfhydryl groups. The oxidation state of the protein sulfhydryl groups was divided into reversible and irreversible states. Sulfur bonds and sulfenic acids irreversibly formed sulfinic acid and sulfonic acid. The content of the disulfide bond was half of the total sulfhydryl content minus the free sulfhydryl content. The disulfide bond content of hydrogen peroxide before (4.37) and after (4.34) decolorization did not change, indicating that the oxidation state of the sulfhydryl group was basically reversible and recoverable.[Citation28] H2O2 can increase the hydrophobicity of the protein surface, thereby promoting the oxidation of the side chain.[Citation11] Oxidation then modifies the protein side chain to produce carbonyl, which can free amino elements through the carbonylation ammonia condensation reaction[Citation7,Citation14] . The free amino elements subsequently form amide bonds that result in the cross-linking and polymerization of protein molecules.[Citation10,Citation15] Disulfide bonds formed by mercaptol oxidation or by other modes of cross-linking can cause cross-crosslinking and polymerization between protein molecules.[Citation8,Citation12–Citation14] Thus, the effects of oxidation on physical and chemical properties, such as protein stability and solubility, are realized through conformational changes and interaction between molecules.
Table 1. Comparison of structural properties of decolorized and nondecolorized protein
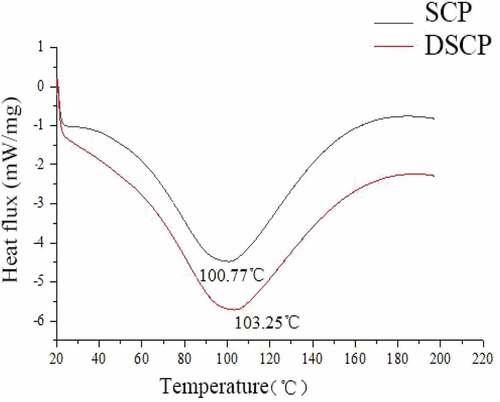
Thermal denaturation temperature
As shown in , the thermal denaturation temperatures of DSCP and SCP were, respectively, 103.25°C and 100.77°C. The hydrogen dioxide side chain of the non-polar amino acid enhanced the surface space complexity of the amino acid residue, leading to the formation of a large and orderly hydrogen network.[Citation8,Citation20] H2O2 increased the heat capacity of SCP and the temperatures of the polycondensation (exothermic) and repolymerization (exothermic) reactions of a large number of amino acids[Citation11,Citation20–Citation22], thereby increasing the thermal denaturation temperature of DSCP.
Figure 1. DSC analysis of DSCP and SCP
SDS-PAGE patterns
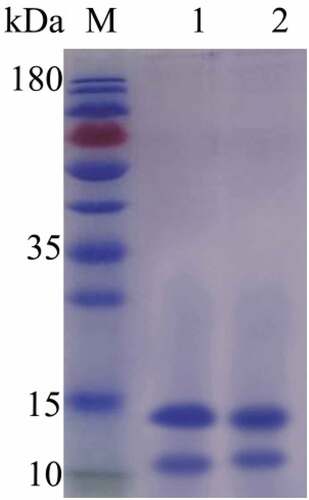
SDS-PAGE was performed on SCP before and after decolorization. Structural aggregation changes were observed. As shown in , the band after decolorization of H2O2 did not change significantly, the oxidation of protein led to aggregation or fragment formation of protein, resulting in the accumulation of macromolecular protein aggregates or fragments on top of the separation gel[Citation18,Citation28], so SCP did not oxidize.
Figure 2. SDS-PAGE of SCP and DSCP (M: Marker; 1: SCP; 2: DSCP)
Amino acid composition
The amino acid composition of proteins determines their nutritional value. The difference in the amino acid composition between DSCP treated by H2O2 and SCP is shown in . The structure of tryptophan was destroyed by acid hydrolysis, so tryptophan was not detected. Decolorized seed cake protein (DSCP) and seed cake protein (SCP) were rich in 17 kinds of amino acids, 7 of which are necessary for the human body. The four amino acids with high proportion were glutamate, arginine, aspartic acid, and leucine. Glutamic and aspartic acids can improve the antioxidant activity of proteins and eliminate excess free radicals.[Citation7,Citation12] The contents of basic amino acids in both samples were lower than those of acidic amino acids, indicating that SCP was acidic under natural conditions, consistent with its isoelectric point of around 3.5. H2O2 treatment can transform amino groups into carbonyl groups in the glutamic acid, valine, and isoleucine of free amino acid residues in proteins. The formed carbonyl groups further form Schiff bases through protein amino reactions, which cause the content of free amino acids to decrease and eventually promotes the covalent cross-linking of a protein and destroys the protein structure.[Citation4,Citation18–Citation20]
Table 2. Amino acid comosition of SCP (g/100g protein)
In terms of content and demand, the essential amino acid content of SCP before and after decolorization satisfied the WHO standard for adults. The difference in the amino acid composition was not significantly different between DSCP and SCP. The amino acid content of the decolorized protein was higher than that of SCP (except glutamic acid, valine, and isoleucine). Decolorization possibly caused the purity of protein such that the total amino acid content of DSCP was higher than that of SCP, however, the process led to certain destructive effects on glutamic acid, valine, and isoleucine.
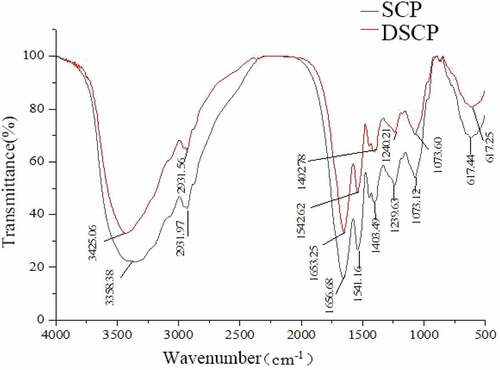
IR spectroscopy
shows the FT-IR spectra of DSCP and SCP. Comparison of both spectra showed broad peaks at 3600–3200 cm−1. DSCP was strongly absorbed at 3425 cm−1, and SCP was strongly absorbed at 3358 cm−1, indicating the stretching vibration of O-H and the presence of intermolecular or intramolecular hydrogen bonds, respectively.[Citation6,Citation10] The decolorization of H2O2 weakened the intramolecular and intermolecular hydrogen bonds. An absorption peak of the decolorized and nondecolorized proteins was found at 2932 cm−1, which is due to the C-H stretching vibration of alkane-CH2 or -CH3.[Citation6,Citation8] The decolorization of H2O2 reduced the intensity of the C-H stretching vibration of the saturated alkanes. Strong absorption peaks of DSCP were found at 1653 and 1543 cm−1. Strong absorption peaks of SCP were detected at 1657 and 1541 cm−1, which are due to the C = O bond stretching vibration of the -CONH- group and characteristic absorption of peptide bonds, respectively.[Citation9,Citation11] H2O2 did not affect the basic skeleton of protein-CONH-, and DSCP was basically consistent with the SCP functional group and chemical bond species. The decolorization of H2O2 did not significantly affect the functional groups and chemical bonds of SCP.
Figure 3. IR spectra of SCP and DSCP
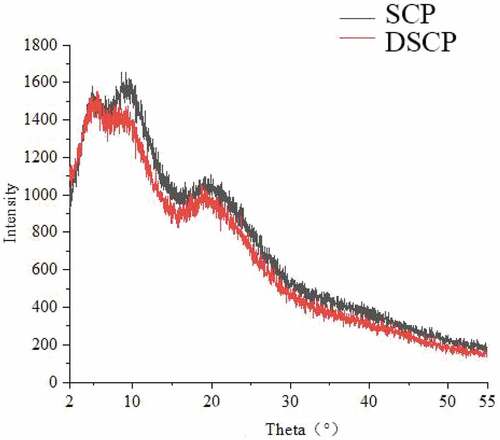
XRD peak
As shown in , the samples possessed three characteristic X-ray diffraction peaks. DSCP showed three characteristic X-ray diffraction peaks within 5.50°, 9.35°, and 19.13°. SCP showed three characteristic X-ray diffraction peaks within 4.88°, 8.62°, and 19.95°. The intensity and position of the X-ray diffraction peaks were basically the same for both proteins.
Figure 4. X-ray diffraction patterns of DSCP and SCP
Microtopography
As shown in , the microtopography of DSCP and SCP was basically similar. At low magnification (×100), DSCP and SCP mainly presented a lamellar structure at high magnification (×5000). DSCP and SCP were spherical, and the collapsed sphere may be caused by uneven shrinkage of particles composed of protein and water during freeze drying.[Citation21] DSCP contained partial voids and had fewer microstructural changes than SCP (surface morphology presents a distinct large structure with a smooth surface and loose internal structure).
Figure 5. Scanning results of decolorized and nondecolorized proteins detected on electron microscope (1 and2, ×100; 3 and 4, ×5000)
Functional properties
As shown in , the pH–solubility curve first decreased and then increased with increasing pH, showing a V shape. As such, the isoelectric points of SCP and DSCP were around pH 3.5. The decolorization of H2O2 did not change the isoelectric point of SCP. The decolorization of H2O2 reduced the protein solubility, which could be mainly due to the covalent cross-linking aggregation of SCP caused by H2O2. The formation of insoluble aggregates decreased the solubility of SCP, consistent with the results of Davis and Goldberg.[Citation29]
Figure 6. Difference in pH–solubility curve between DSCP and SCP
As shown in , the emulsifiability and emulsification stability of DSCP were significantly lower than those of SCP (P< .05) possibly because of covalent cross-linking aggregation of protein and insoluble aggregation, consistent with the result of decreased solubility of DSCP. The WHC and OHC values of DSCP surpassed the SCP mainly because the oxidation degree of SCP was low, its spatial structure slightly expanded, and the flexibility of its molecules increased. In this regard, more water molecules had the opportunity to enter the protein to increase the WHC. The partially exposed hydrophobic group of the protein can bind to lipid, increasing the OHC. After decolorization, the foaming ability and foam stability of SCP decreased significantly. Treatment with hydrogen peroxide prevented SCP from fully expanding at the gas–liquid interface. As such, continuous protein membrane with good viscoelasticity and blocking air permeability was not formed.
Table 3. Comparison of functional properties between decolorized and nondecolorized proteins
Conclusion
H2O2 increased the surface hydrophobicity and the free and total sulfhydryl contents of SCP but did not change the content of disulfide bonds. Decolorization of H2O2 exerted certain influence on the functional properties of SCP but did not change the physical and chemical properties at the isoelectric point, decolorization with hydrogen peroxide did not significantly affect the protein structure. Hence, H2O2 oxidation could be suitable method for decolorization of SCP.
Acknowledgments
This work was supported by the key research and development plan in Hainan province (ZDYF2018149), the major science and technology planning project in Hainan province (ZDKJ2017004) and the special fund for horticulture as one of the Hainan key discipline subjects.
Additional information
Funding
References
- Chen, J. H.; Wu, H. Y.; Liau, B. C.; Chang, C. M. J.; Jong, T. T.; Wu, L. C. Identification and Evaluation of Antioxidants Defatted Camellia Oleifera Seeds by Isopropanol Salting-out Pretreatment. Food Chem. 2010, 121(4), 1246–1254. DOI: 10.1016/j.foodchem.2010.01.015.
- Hu, J. L.; Nie, S. P.; Huang, D. F.; Li, C.; Xie, M. Y.; Wan, Y. Antimicrobial Activity of Saponin-rich Fraction from Camellia Oleifera Cake and Its Effect on Cell Viability of Mouse Macrophage RAW 264.7. J. Sci. Food Agric. 2012, 92(12), 2443–24449. DOI: 10.1002/jsfa.5650.
- Li, X.; Shen, S.; Deng, J.; Li, T.; Ding, C. Antioxidant Activities and Functional Properties of Tea Seed Protein Hydrolysates (camellia Oleifera Abel.) Influenced by the Degree of Enzymatic Hydrolysis. Food Sci. Biotechnol. 2014, 23(6), 2075–2082. DOI: 10.1007/s10068-014-0282-2.
- Wu, Y. F.; Da, S.; Hao, C.; Lisheng, Q.; Ping, X. Fatty Acid Composition and Antioxidant Activity of Tea (camellia Sinensis L.) Seed Oil Extracted by Optimized Supercritical Carbon Dioxide. Int. J. Mol. Sci. 2011, 12(11), 7708–7719. DOI: 10.3390/ijms12117708.
- Li, T. T.; Zhang, H.; Wu. Screening of Antioxidant and Antitumor Activities of Major Ingredients from Defatted Camellia Oleifera Seeds. Food Sci. Biotechnol. 2014, 23(3), 873–880. DOI: 10.1007/s10068-014-0117-1.
- Ahmedna, M.; Marshall, W. E.; Rao, R. M. Surface Properties of Granular Activated Carbons from Agricultural By-products and Their Effects on Raw Sugar Decolorization. Bioresour. Technol. 2000, 71(2), 103–112. DOI: 10.1016/S0960-8524(99)90069-X.
- Simaratanamongkol, A.; Thiravetyan, P. Decolorization of Melanoidin by Activated Carbon Obtained from Bagasse Bottom Ash. J. Food Eng. 2010, 96(1), 14–17. DOI: 10.1016/j.jfoodeng.2009.06.033.
- Lijuan, Z.; Jie, C.; Xueyan, T.; Xiong, Y. L. Reducing, Radical Scavenging, and Chelation Properties of in Vitro Digests of Alcalase-treated Zein Hydrolysate. J. Agric Food Chemi. 2008, 56(8), 2714–2721. DOI: 10.1021/jf703697e.
- Xueyan, T.; Zhiyong, H.; Yanfeng, D.; Xiong, Y. L.; Mingyong, X.; Jie, C. Peptide Fractionation and Free Radical Scavenging Activity of Zein Hydrolysate. J. Agric. Food Chem. 2010, 58(1), 587–593. DOI: 10.1021/jf9028656.
- Achaerandio, I.; Güell, C.; López, F. Continuous Vinegar Decolorization with Exchange Resins. J. Food Eng. 2002, 51(4), 311–317. DOI: 10.1016/S0260-8774(01)00073-5.
- Xie, J. H.; Shen, M. Y.; Nie, S. P.; Li, C.; Xie, M. Y. Decolorization of Polysaccharides Solution from Cyclocarya Paliurus (batal.) Iljinskaja Using ultrasound/H₂O₂ Process. Carbohydr. Polym. 2011, 84(1), 255–261. DOI: 10.1016/j.carbpol.2010.11.030.
- CFR (2014) 21CFR184.1366: Listing of Specific Substances Affirmed as GRAS:Hydrogen Peroxide. Code of Federal Regulations (vol. 3) MD 20993: Silver Spring.
- Mustapha, N. A.; Ruttarattanamongkol, K.; Rizvi, S. S. H. The Effects of Supercritical Fluid Extrusion Process on Surface Hydrophobicity of Whey Protein Concentrate and Its Relation to Storage and Heat Stability of Concentrated Emulsions. Food Res. Int. 2012, 48(2), 470–477. DOI: 10.1016/j.foodres.2012.05.015.
- Zilic, S.; Akllioglu, G.; Serpen, A.; Barac, M.; Gokmen, V. Effects of Isolation, Enzymatic Hydrolysis, Heating, Hydratation and Maillard Reaction on the Antioxidant Capacity of Cereal and Legume Proteins. Food Res. Int. 2012, 49(1), 1–6. DOI: 10.1016/j.foodres.2012.06.031.
- Salwi, H.;. Biuret Method for Soluble Whey Proteins in Nonfat Dry Milk Solids. J. Food Sci. 2010, 19(1–6), 235–245. DOI: 10.1111/j.1365-2621.1954.tb17445.x.
- Khatkar, B. S.; Barak, S.; Mudgil, D. Effects of Gliadin Addition on the Rheological, Microscopic and Thermal Characteristics of Wheat Gluten. Int. J. Biol. Macromol. 2013, 53(2), 38–41. DOI: 10.1016/j.ijbiomac.2012.11.002.
- Lee, M. K.; Kim, J. K.; Lee, S. Y. Effects of Fermentation on Sds-page Patterns, Total Peptide, Isoflavone Contents and Antioxidant Activity of Freeze-thawed Tofu Fermented with Bacillus Subtilis. Food Chem. 2017, 249, 60–65. DOI: 10.1016/j.foodchem.2017.12.045.
- Latif, M. H.; PS, B.; Pfannstiel. Amino Acid Composition, Antinutrients and Allergens in the Peanut;protein Fraction Obtained by an Aqueous Enzymatic Process. Food Chem. 2013, 136(1), 213–217. DOI: 10.1016/j.foodchem.2012.07.120.
- Kyomugasho, C.; Christiaens, S.; Shpigelman, A.; Loey, A. M. V.; Hendrickx, M. E. FT-IR Spectroscopy, a Reliable Method for Routine Analysis of the Degree of Methylesterification of Pectin in Different Fruit- and Vegetable-based Matrices. Food Chem. 2015, 176, 82–90. DOI: 10.1016/j.foodchem.2014.12.033.
- Chen, L.; Tian, Y.; Tong, Q.; Zhang, Z.; Jin, Z. Effect of Pullulan on the Water Distribution, Microstructure and Textural Properties of Rice Starch Gels during Cold Storage. Food Chem. 2017, 214, 702–709. DOI: 10.1016/j.foodchem.2016.07.122.
- Joshi, M.; Adhikari, B.; Aldred, P.; Panozzo, J. F.; Kasapis, S. Physicochemical and Functional Properties of Lentil Protein Isolates Prepared by Different Drying Methods. Food Chem. 2011, 129(4), 1513–1522. DOI: 10.1016/j.foodchem.2011.05.131.
- Hung, S. C.; Zayas, J. F. Emulsifying Capacity and Emulsion Stability of Milk Proteins and Corn Germ Protein Flour. J. Food Sci. 2010, 56(5), 1216–1218. DOI: 10.1111/j.1365-2621.1991.tb04737.x.
- Sathe, S. K.; Salunkhe, D. K. Functional Properties of the Great Northern Bean (phaseolus Vulgaris L.) Proteins: Emulsion, Foaming, Viscosity, and Gelation Properties. J. Food Sci. 2010, 46(1), 71–81. DOI: 10.1111/j.1365-2621.1981.tb14533.x.
- Wang, W.; Xue, W.; Ma, F.; Xu, X.; Jin, B. Candidate Gene Expression Affects Intramuscular Fat Content and Fatty;acid Composition in Pigs. J. Appl. Genet. 2013, 54(1), 113–118. DOI: 10.1007/s13353-012-0131-z.
- Pacifici, R. E.; Kono, Y.; KJ, D. Hydrophobicity as the Signal for Selective Degradation of Hydroxyl Radical-modified Hemoglobin by the Multicatalytic Proteinase Complex, Proteasome. J. Biol. Chem. 1993, 268(21), 15405–15411.
- Li, Y.; Kong, B.; Xia, X.; Qian, L.; Diao, X. Structural Changes of the Myofibrillar Proteins in Common Carp (cyprinus Carpio) Muscle Exposed to a Hydroxyl Radical-generating System. Process Biochem. 2013, 48(5–6), 863–870. DOI: 10.1016/j.procbio.2013.03.015.
- Morzel, M.; Gatellier, P.; Sayd, T.; Renerre, M.; Laville, E. Chemical Oxidation Decreases Proteolytic Susceptibility of Skeletal Muscle Myofibrillar Proteins. Meat Sci. 2006, 73(3), 536–543. DOI: 10.1016/j.meatsci.2006.02.005.
- Thomas, J. A.; Mallis, R. J. Aging and Oxidation of Reactive Protein Sulfhydryls. Exp. Gerontology. 2001, 36(9), 1519–1526.
- Davies, K. J.; Goldberg, A. L. Proteins Damaged by Oxygen Radicals are Rapidly Degraded in Extracts of Red Blood Cells. J.biol.chem. 1987, 262(17), 8227–8234.