
 ?Mathematical formulae have been encoded as MathML and are displayed in this HTML version using MathJax in order to improve their display. Uncheck the box to turn MathJax off. This feature requires Javascript. Click on a formula to zoom.
ABSTRACT
In this study, spray-drying process was optimized to produce whey protein concentrate–iron (WPC–Fe) complex with the aim of making iron compatible with food products. WPC-80 and FeSO4 complex formation was achieved using centrifugation (to remove insoluble iron), ultrafiltration (to remove unbound iron), and spray-drying. Spray-drying of WPC–Fe complex solution was carried out at inlet temperature, flow rate, and total solids (TS) ranging from 126.3°C to 193.6°C, 0.63 to 9.87 ml min−1, and 1.59% to 18.40%, respectively, as generated by central composite rotatable design. The optimum operating condition for WPC–Fe complex production was 180°C inlet drying temperature, 2.66 ml min−1 flow rate, and 15% TS content. At this optimized condition, moisture content, yield, and solubility were observed to be 4.19%, 8.21 g 100 ml−1, and 87.53% which were comparable with the predicted values, viz. 4.11%, 8.29 g 100 ml−1, and 87.63%, respectively. The spray-dried WPC–Fe complex generated could be used in foods as an organic fortifier to reduce the menace of iron deficiency.
Introduction
Iron deficiency is one of the most common deficiencies in micronutrients affecting more than 2 billion individuals, about 30% of the world’s population.[Citation1] In India, iron-deficiency anemia is widespread among children under 3 years of age (69.4%), females (57%), and males (24.2%).[Citation2] Food fortification is the most cost-effective, viable, and optimal strategy among different approaches to micronutrient deficiencies.[Citation3,Citation4] Some factors, which are to be considered before the fortification of food products, are chemical reactivity of the fortificants, stability under food processing and storage conditions, compatibility of the fortificant with other food components, and the bioavailability of the fortificants. Fortification of foods with iron salts, such as ferrous sulfate, ferrous gluconate, and ferric ammonium citrate, leads to numerous technological issues such as color change, flavor, functional characteristics, lipid oxidation followed by precipitation during digestion, resulting in decreased bioavailability of added iron.[Citation4,Citation5] Whey protein concentrate (WPC) was used for complex formation with iron due to its structural and functional characteristics and easy availability in the industry. It also functions as a natural antioxidant probably due to the radical scavenging activity of free sulphydryl groups present in it contributing to the stability of the complex.[Citation4,Citation6] Added iron primarily binds with oxygen atoms of phosphoseryl residues through coordination bonds on individual proteins, though similar bonds are also formed with aspartic acid and glutamic acid residues.[Citation7] WPC–Fe complex prepared using lyophilization showed better solubility, yield, and also fairly high capacity of mineral retention.[Citation3] Lyophilization, however, is a time-consuming and expensive method and therefore not viable for commercial use. In addition, the production of particles of a definite size also requires an extra milling step.
Short heat contact time and a high rate of evaporation in the spray drier provide a high-quality product at a reduced price, making it the most widely used method for the manufacturing of powder.[Citation8] The conditions of the spray-drying process can be easily manipulated to achieve desired particle properties such as size distribution, dispersibility, and solubility. Furthermore, spray-drying processes can be scaled up to industry level at a relatively reduced cost. Solubility is a major attribute for overall reconstitution quality, and the food powders produced should possess good solubility to impart functionality to the food products. The low solubility of the powder causes problems in processing and can lead to financial losses.[Citation9,Citation10] Properties like solubility, yield, and moisture content of the spray-dried powder are affected by the operating conditions of the spray drier such as the characteristics of the liquid feed (concentration and flow rate) and inlet temperature. The method needs optimization to achieve the desired characteristics. The response surface methodology (RSM) is a convenient method for obtaining the optimized condition when dealing with multiple variables and its effect on multiple responses as it minimizes the number of trials. Central composite rotatable design (CCRD) involved in RSM was used for optimizing the conditions for the production of the spray-dried WPC–Fe complex in order to achieve minimum moisture content and maximum yield and solubility of the powder. The objective of the current work was, therefore, to optimize the spray-drying conditions in order to produce WPC–Fe complex with desired features that could be used for fortification in various food products with minimal impact on sensory acceptability.
Materials and methods
Materials
WPC 80 was procured from Davisco Foods International Co. (Le Sueur, MN, USA) and ferrous sulfate heptahydrate (FeSO4.7H20) from Sigma Aldrich (St. Louis, MO, USA).
Preparation of WPC–Fe complex
WPC–Fe complex was prepared by following the methodology of Banjare et al.[Citation11–Citation13] WPC 1.0% solution was prepared in deionized water, and the iron solution was gradually added to obtain a final iron concentration of 3 mM with continuous stirring using magnetic stirrer (SPINOT MC 02, Tarsons Products Pvt. Ltd., Kolkata, India). The solution’s pH was adjusted to 6.6 and remained undisturbed for 2 h at 20°C. The mixture was then centrifuged (high-speed refrigerated centrifuge, KUBOTA-6500, Kubota Corporation, Tokyo, Japan) at 12,000 × g at 20°C for 30 min. Supernatant containing soluble iron and protein was carefully decanted and filtered through Whatman No. 1 filter paper. The filtered supernatant obtained was passed through a Hydrosart ultrafiltration (UF) cassette (MW 10 kDa) (Sartorius India Pvt. Ltd., Mumbai, India) to separate the soluble bound iron (retentate) from the soluble free iron (permeate). The retentate was concentrated from 1.59% to 18.40% and subsequently spray-dried as per the experimental trials generated by CCRD.
Spray-drying of WPC–Fe complex solution
For the production of spray-dried WPC–Fe complex, a table top spray drier (SPD-P-111, Technosearch Instruments, Mumbai, India) fitted with co-current nozzle hot airflow was used. The experiments designed involved different combinations of the feed flow rate, inlet temperature, and total solid content (TS %) of WPC–Fe complex solution as per the experimental trials generated by CCRD. The products from separate runs were stored in desiccators for further analysis.
Moisture content and solubility
Moisture content was determined using the gravimetric method.[Citation14] The solubility of WPC–Fe complex was determined by following the methodology of Garofulic et al.[Citation15] with modification in the centrifugation speed. Powder 1 g was placed in a glass centrifuge tube containing 10 ml distilled water and stirred vigorously for 1 min on a vortex vibrator. The tube was then kept in a water bath (Poly Science, IL, USA) at 37°C for 30 min and finally centrifuged at 3,000 rpm for 10 min. The supernatant obtained was dried in a laboratory oven at 100°C until a constant weight was realized. Solubility was calculated according to the following formula:
where ws is the weight (g) obtained by drying of the supernatant and wp is the initial weight (g) of the powder used for analysis.
Yield
The yield was calculated from the weight of the powder obtained from spray-drying of 100 ml of the WPC–Fe complex solution expressed as g 100 ml−1.
Outlet temperature
Probe connected to the exit port of the collecting powder automatically determined the outlet temperature for each combination of operating conditions.
Experimental design, statistical analysis, and optimization
Design-Expert version 10.0.3[Citation16] was used to produce response surface plots and to optimize the process. RSM was used to investigate the effects of spray-drying process variables (inlet drying temperature, % TS of the solution, and flow rate) on the solubility, yield, outlet temperature, and moisture content of WPC–Fe complex. The range of process variables was determined by conducting preliminary trials, and the corresponding parameter levels and codes obtained are listed in . CCRD generated 20 experiments formed by six central points (to demonstrate the reproducibility) and six axial points (). The experimental data obtained were fitted to a second-order polynomial model, and for each response, regression coefficients were also ascertained. Analysis of variance (ANOVA) was performed to determine the significant terms in the model, and model adequacies were verified by R2, adj-R2, pre-R2and coefficient of variance (C.V.). After model fitting, residual analyses including the examination of diagnostic plots and calculation of case statistics were conducted to validate the assumptions used in ANOVA. A desirability function which reflects the desirable ranges (0–1) for each response (di) was generated.[Citation17] The final desirability function equation is shown below:
Table 1. Factors and levels tested for central composite rotatory experimental design
Table 2. Experimental results and predicted values of the responses for each set of run
Iron estimation of the optimized WPC–Fe complex
The iron content of the complex prepared at the optimized condition was estimated by utilizing the dry digestion method.[Citation18] A standard curve was prepared using ferrous sulfate heptahydrate salt. Sample 100 mgwas weighed in a silica crucible and ashed at 550°C for 8 h. Ten milliliters of triple acid (nitric acid:perchloroacetic acid:sulphuric acid: 3:2:1) was added to ash and heated on the hot plate for its complete dissolution. It was then diluted to 100 times with triple distilled water. Finally, estimation of iron was carried out using atomic absorption spectroscopy (Shimadzu, Japan) at a λmax of 248.3 nm.
Results and discussion
Iron was complexed with different proteins in the previous studies[Citation3,Citation19–Citation21] and used for application in different foods. In the present study, iron was complexed with WPC employing the process of centrifugation and UF. Centrifugation resulted in the formation of iron forms which were soluble (supernatant) and insoluble (precipitate). The supernatant was further subjected to UF to remove free (permeate) from protein-bound iron (retentate). The developed complex solution requires drying operation prior to its application in foods. In a previous study, lyophilization was used to dry WPC–Fe complex solutions.[Citation3] However, for industrial application, spray-drying is a well-established technology. In order to have spray-dried WPC–Fe complex with desired characteristics, the operating conditions of the spray drier were optimized using RSM. Results of different runs of the spray-drying experiments are presented in . The standard deviation at the central points generated by CCRD for moisture content, solubility, yield, and outlet temperature was 0.21%, 0.94%, 0.65 g 100 ml−1, and 2.9°C. The moisture content, yield, solubility, and outlet temperature ranged from 4.11% to 9.92%, 0.62 to 9.96 g 100 ml−1, 74.01% to 88.05%, and 42.2°C to 69.1°C (). Multiple linear regression analysis of the experimental data yielded second-order polynomial models for predicting moisture content, solubility, and TS content. Regression equation coefficients of the proposed models and the statistical significance of the process variables calculated for each response are shown in . As per ANOVA, the lack of fit was not significant for the response surface model, and the model adequacies were also appropriate. To visualize the interaction effects of two factors on any response, the response surface plots were drawn for each of the fitted models as the function of two independent variables, while keeping the other variables at the central value (–). Effects of variables on responses were determined by evaluation of these plots. From the equations obtained, it was evident that the most significant process variable was the feed flow rate (except the outlet temperature where it was inlet temperature), but the impacts of other processes, viz., TS content and inlet temperature on responses have also been discussed.
Table 3. Estimated coefficients of linear, quadratic, and interaction terms for each response variables, i.e., moisture content (%), solubility (%), yield (g 100 ml−1), and outlet temperature (ºC)
Figure 1. Effect of (a) inlet air temperature and feed flow rate at 10% TS, (b) inlet air temperature and TS (%) at feed flow rate of 5.25 ml/min, and (c) flow rate and TS at inlet temperature of 160ºC on the moisture content
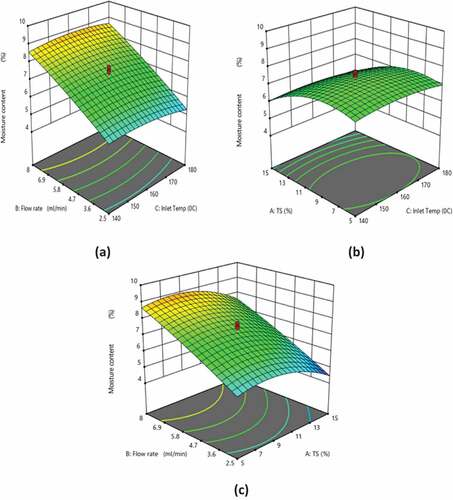
Figure 2. Effect of (a) TS and feed flow rate at inlet air temperature of 160ºC, (b) inlet air temperature and feed flow rate at 10% TS, and (c) inlet temperature and TS at feed flow rate of 5.25 ml/min on the solubility
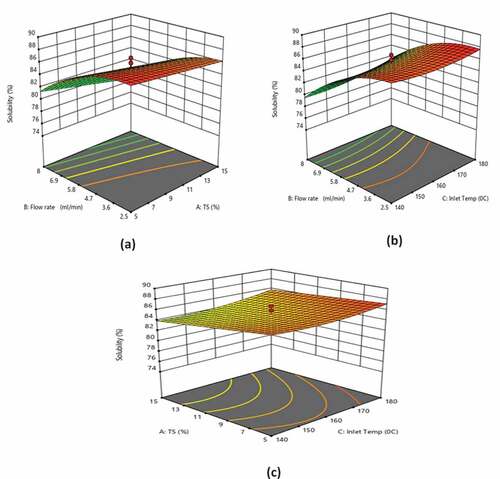
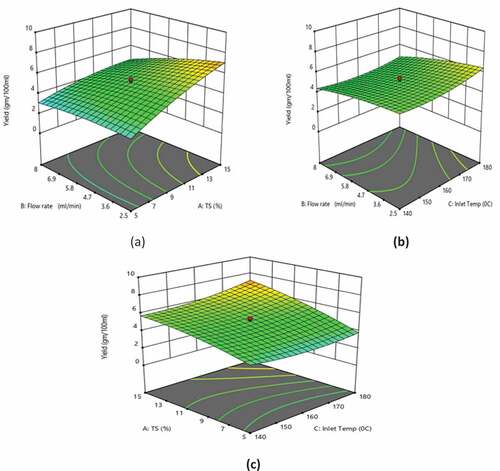
Figure 3. Effect of (a) TS and feed flow rate at inlet air temperature of 160ºC, (b) inlet air temperature and feed flow rate at 10% TS, and (c) inlet air temperature and TS at feed flow rate of 5.25 ml/min on the yield
Model fitting
As per ANOVA, the resultant quadratic model effectively represented the experimental data with coefficients of multiple determinations (R2) of 0.98, 0.96, 0.96, and 0.92 for the responses of moisture content, solubility, yield, and outlet temperature, respectively (). The difference between adjusted and predicted R2 was less than 0.2 for all the responses, confirming the suitability of the model. To verify the model’s validity, each of the experimental value obtained was compared with that of the corresponding predicted value (). The significance of the coefficients was determined using the p value. The coefficients were considered to be as significant for p values lower than 0.05. It was observed that the model used in this study was able to identify the optimal operating conditions for spray-drying of WPC–Fe complex solution.
Response surface analysis of moisture content
Moisture content is the major determinant of the shelf life of spray-dried food powders. The perusal of the response surface analysis (RSA) of the data () revealed that the relationship between the moisture content and process variables was quadratic with a good regression coefficient (R2 = 0.98). The relationship between moisture content and the process variables [TS (A), flow rate (B), and inlet temperature (C)] is shown in EquationEquation (1)(1)
(1) :
shows the response surface plots depicting the effects of TS, inlet temperature, and flow rate on the moisture content. EquationEquation (1)(1)
(1) shows that the TS demonstrated a negative linear and quadratic effect on the moisture content (p < 0.0001; p < 0.0001). Flow rate demonstrated a positive linear and a negative quadratic effect (p < 0.0001). The moisture content decreased with increase in the TS of the solution. The results indicated that at lower TS, the moisture content increased with the increase in flow rate ().[Citation22,Citation23] It was also observed that with an increase in the inlet temperature, the moisture content in the powder decreased at a constant flow rate and TS of the drying solution. The greater temperature gradient between the medium and particles resulted in a quicker transfer of heat to the particles, thus reducing the content of moisture.[Citation24,Citation25] Among the experimental runs, the highest moisture content was observed for 10% TS, 9.87 ml min−1 flow rate, and 160°C inlet temperature (). It was observed that the experimental results and the predicted values of moisture content derived from EquationEquation (1)
(1)
(1) at a different set of runs were comparable (). This verified that the model was adequate in predicting the moisture content with the given process variables.
Response surface analysis of solubility
The RSA of the data () demonstrated that the relationship between the solubility and independent variables was quadratic, illustrated by a good regression coefficient (R2 = 0.96). EquationEquation (2)(2)
(2) shows the relationship between solubility and the independent variables [TS (A), flow rate (B), and inlet temperature (C)]:
depicts the response surface plots showing the effects of inlet temperature, TS, and flow rate on the solubility. TS demonstrated a negative linear and a positive quadratic effect on the solubility (p < 0.05). Flow rate showed a negative linear and quadratic effect on the solubility (p < 0.0001), while inlet temperature demonstrated a positive linear and a negative quadratic effect on the solubility (p < 0.05). As the inlet temperature increased, the moisture content reduced, thereby increasing the solubility.[Citation25,Citation26] At lower TS, the solubility decreased when the flow rate increased (), which demonstrated that the lower flow rate (2.5 ml/min) was favorable for obtaining a higher solubility. Increasing the feed flow rate reduces the outlet temperature, thereby increasing the difference between inlet and outlet temperatures, resulting in a greater remaining moisture content in the product. High moisture content is associated with the slow rehydration and stickiness of the powder which in turn decreased the solubility.[Citation27,Citation28] It was evident from the results that the solubility of the WPC–Fe complex decreased with the increase in the TS (), which revealed that lower TS is favorable for obtaining a higher solubility at a lower flow rate.[Citation29,Citation30] Among the experimental runs, the highest solubility was observed for 1.59% TS, 5.25 ml min−1 flow rate, and 160°C inlet temperature (). It was found that the experimental findings and the expected solubility values obtained using EquationEquation (2)(2)
(2) were similar at separate runs ().
Response surface analysis of yield
The RSA of the data () demonstrated that the relationship between the yield and independent variables was quadratic with a good regression coefficient (R2 = 0.96). EquationEquation (3)(3)
(3) shows the relationship between yield and the independent variables (TS (A), flow rate (B), and inlet temperature (C)):
shows the response surface plots depicting the effects of inlet temperature, TS, and flow rate on the yield. TS and inlet temperature demonstrated a positive linear effect on the yield (p < 0.0001; p < 0.05), while the flow rate showed a negative linear effect (p < 0.0001). TS and flow rate demonstrated a negative quadratic effect on the yield (p < 0.05), while the inlet temperature showed a positive quadratic effect (p < 0.05). As observed from EquationEquation (3)(3)
(3) , TS showed a maximum impact on the yield of the powder. There was an increase in the yield with an increase in TS, demonstrating that higher TS is favorable for achieving a higher yield at a lower flow rate (). The yield of the powder was also found to be increased with an increase in the inlet temperature.[Citation27,Citation30–Citation33]
Higher feed flow rate caused a decrease in heat and mass transfer, resulting in a reduction of the process yield. Besides, at the high feed flow rate, the solution was not atomized, and hence, drippings were observed in the chamber which further reduced the yield.[Citation34,Citation35] Among the experimental runs, the highest yield (8.18 g/100 ml) was observed for 15% TS, 2.5 ml min−1 flow rate, and 180°C inlet temperature (). The experimental results and the predicted values of the yield obtained using EquationEquation (3)(3)
(3) at a different set of runs were comparable ().
Response surface analysis of outlet temperature
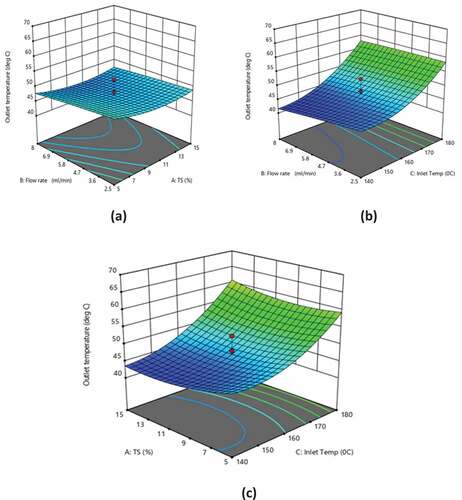
The RSA of the data () illustrated that the relationship between the outlet temperature and independent variables was quadratic with a good regression coefficient (R2 = 0.92). EquationEquation (4)(4)
(4) depicts the relationship between outlet temperature and the independent variables (TS (A), flow rate (B), and inlet temperature (C)):
shows the response surface plots demonstrating the effects of TS, flow rate, and inlet temperature on the outlet temperature. TS and flow rate showed a nonsignificant effect (p > 0.05) and the inlet temperature showed a positive linear effect (p < 0.0001), while the TS and inlet temperature showed positive quadratic effect (p < 0.05; p < 0.05) and the flow rate showed nonsignificant quadratic effects (p > 0.05) on the outlet temperature (). It was observed that inlet temperature affected outlet temperature the most as evident from EquationEquation (4)(4)
(4) . As the difference between the inlet and outlet temperatures increased, the moisture content in the powder increased which decreased the solubility of the powder. The outlet temperature decreased when TS increased which demonstrated that lower TS was favorable for obtaining a higher outlet temperature at a lower flow rate. At lower TS, the outlet temperature decreased as the flow rate increased, which illustrated that a lower flow rate (2.5 ml min−1) was favorable for obtaining a higher outlet temperature.[Citation36] Among the experimental runs, the highest outlet temperature (61.2°C) was observed for 10% TS, 5.25 ml min−1 flow rate, and 193.63°C inlet temperature (). The experimental results and the predicted values of the outlet temperature obtained using EquationEquation (4)
(4)
(4) at a different set of runs were comparable ().
Figure 4. Effect of (a) TS and feed flow rate at inlet air temperature of 160ºC, (b) inlet air temperature and feed flow rate at 10% TS, and (c) inlet temperature and TS at feed flow rate of 5.25 ml/min on the outlet temperature
Optimization of spray-drying conditions
To optimize the responses, the designer’s desirability function was simultaneously performed. This feature seeks to combine autonomous parameter levels that simultaneously fulfill the design response requirements.[Citation37] Numerical optimization procedure which assesses a point which maximizes the desirability function was also carried out. As per the desirability function, the optimum levels of process parameters were observed to be 180°C inlet air temperature, 2.66 ml min−1 feed flow rate, and 15% TS at which minimum moisture content (4.19%) and maximum yield (8.21 g 100 ml−1), solubility (87.53%), and outlet temperature (60.7°C) were obtained.
Verification of predicted independent variables
The suitability of the model equation for predicting the optimum response value was verified at the optimal condition obtained from RSM. The experimental values at the optimum condition for the four responses of moisture content, solubility, yield, and outlet temperature were 4.19 ± 0.12%, 87.53 ± 0.13%, 8.21 ± 0.23 g 100 ml−1, and 60.70 ± 0.27°C which were comparable to predicted values derived from the equation, viz., 4.11%, 87.63%, 8.29 g 100 ml−1, and 60.64°C, respectively (). Overall, the results of the experimental values obtained were very close to the predicted values obtained, which satisfy the predicted model.
Table 4. Experimental verification of predicted response variables
Iron content
The iron content of the WPC–Fe complex obtained at the optimized condition was estimated as 11.042 ± 0.22 mg g−1 of the powder. Thus, there was an adequate iron content in the complex and could be used as an organic iron fortifier for various food applications.
Conclusion
Method for the production of spray-dried WPC–Fe complex has been developed in the present study. CCRD was used for the application of RSM to optimize the spray-drying conditions for the production of spray-dried WPC–Fe complex. Second-order polynomial model was found to be fit adequately for all the variables. Among all the process variables considered in this study, flow rate had a maximum effect on the moisture content and solubility of WPC–Fe complex. The obtained model is acceptable for the production of WPC–Fe complex with longer shelf life which can subsequently be applied in large-scale production. The optimum condition established can be used for the commercial production of the spray-dried WPC–Fe complex with desired effects on the dependent variables. The powder so prepared being enriched with iron and protein could be utilized for the manufacture of iron-fortified food products, thereby alleviating the widespread iron deficiency and improving the food’s nutritional value.
Additional information
Funding
References
- Bansal, D. Iron Deficiency in India. Indian J. Pediatr. 2016, 83, 615–616. DOI: 10.1007/s12098-016-2164-5.
- Indian Institute For Population Sciences National Family Health Survey - 4 State Fact Sheet Gujarat. International Institute for Population Sciences: Mumbai, 2015.
- Shilpashree, B. G.; Arora, S.; Sharma, V. Preparation of Iron/Zinc Bound Whey Protein Concentrate Complexes and Their Stability. LWT - Food Sci. Technol. 2016, 66, 514–522. DOI: 10.1016/j.lwt.2015.11.005.
- Sugiarto, M.; Ye, A.; Taylor, M. W.; Singh, H. Milk Protein-iron Complexes: Inhibition of Lipid Oxidation in an Emulsion. Dairy Sci. Technol. 2010, 90, 87–98. DOI: 10.1051/dst/2009053.
- Nakano, T.; Goto, T.; Nakaji, T.; Aoki, T. Bioavailability of Iron-fortified Whey Protein Concentrate in Iron-deficient Rats. Asian-australas. J. Anim. Sci. 2007, 20, 1120–1126. DOI: 10.5713/ajas.2007.1120.
- Tong, L. M.; Sasaki, S.; McClements, D. J.; Decker, E. A. Mechanisms of the Antioxidant Activity of a High Molecular Weight Fraction of Whey. J. Agric. Food Chem. 2000, 48, 1473–1478. DOI: 10.1021/jf991342v.
- Hegenauer, J.; Saltman, P.; Ludwig, D.; Ripley, L.; Bajo, P. Effects of Supplemental Iron and Copper on Lipid Oxidation in Milk. 1. Comparison of Metal Complexes in Emulsified and Homogenized Milk. J. Agric. Food Chem. 1979, 27, 860–867. DOI: 10.1021/jf60224a048.
- Sulieman, A. M. E.; Elamin, O. M.; Elkhalifa, E. A.; Laleye, L. Comparison of Physicochemical Properties of Spray-dried Camel’s Milk and Cow’s Milk Powder. Int. J. Food Sci. Nutr. Eng. 2014, 4, 15–19. DOI: 10.5923/j.food.20140401.03.
- Nakai, S.; Modler, H. W. Food Proteins: Properties and Characterization; Wiley-VCH: New York, NY, 1996.
- Sharma, A.; Jana, A. H.; Chavan, R. S. Functionality of Milk Powders and Milk-Based Powders for End Use Applications – A Review. Compr. Rev. Food Sci. Food Saf. 2012, 11, 518–528. DOI: 10.1111/j.1541-4337.2012.00199.x.
- Banjare, I.; Gandhi, K.; Sao, K.; Arora, S.; Pandey, V. Physicochemical Properties and Oxidative Stability of Milk Fortified with Spray Dried Whey Protein Concentrate–Iron Complex and In Vitro Bioaccessibility of the Added Iron. Food Technol. Biotechnol. 2019, 57, 1–29. DOI: 10.17113/ftb.57.01.19.5945.
- Gandhi, K.; Devi, S.; Gautam, P. B.; Sharma, R.; Mann, B.; Ranvir, S.; Sao, K.; Pandey, V. Enhanced Bioavailability of Iron from Spray Dried Whey Protein Concentrate-iron (wpc-fe) Complex in Anaemic and Weaning Conditions. J. Funct. Foods. 2019, 58, 275–281. DOI: 10.1016/J.JFF.2019.05.008.
- Banjare, I.; Gandhi, K.; Sao, K.; Sharma, R. Physicochemical Characterization and Stability of Spray-Dried Whey Protein Concentrate–Iron Complex. Food Technol. Biotechnol. 2019, 57. DOI: 10.17113/ftb.57.03.19.6228.
- IS: 16072. Determination of Moisture Content in Milk Powder and Similar Products; Bureau of Indian Standards: Manak Bhawan, New Delhi, 2012.
- Garofulic, I. E.; Zoric, Z.; Pedisic, S.; Dragovic-Uzelac, V. Optimization of Sour Cherry Juice Spray Drying as Affected by Carrier Material and Temperature. Food Technol. Biotechnol. 2016, 54, 441–449. DOI: 10.17113/ftb.54.04.16.4601.
- Design-Expert, V. 10.0.8, State-Ease, Inc, Minneapolis, MN, USA; 2018. https://www.statease.com/software/downloads-updates.html
- Eren, I.; Kaymak-Ertekin, F. Optimization of Osmotic Dehydration of Potato Using Response Surface Methodology. J. Food Eng. 2007, 79, 344–352. DOI: 10.1016/j.jfoodeng.2006.01.069.
- Jorhem, L; Engman, J. Determination of lead, cadmium, zinc, copper, and iron in foods by atomic absorption spectrometry after microwave digestion: NMKL1 collaborative study. J. AOAC Int. 2000, 83, 1189-1203.
- Kupczyński, R.; Bednarski, M.; Śpitalniak, K.; Pogoda-Sewerniak, K. Effects of Protein-Iron Complex Concentrate Supplementation on Iron Metabolism, Oxidative and Immune Status in Preweaning Calves. Int. J. Mol. Sci. 2017, 18, 1501. DOI: 10.3390/ijms18071501.
- Shilpashree, B. G.; Arora, S.; Kapila, S.; Sharma, V. Physicochemical Characterization of Mineral (Iron/Zinc) Bound Caseinate and Their Mineral Uptake in Caco-2 Cells. Food Chem. 2018, 257, 101–111. DOI: 10.1016/j.foodchem.2018.02.157.
- Shilpashree, B. G.; Arora, S.; Sharma, V.; Bajaj, R. K.; Tomar, S. K. Preparation of Iron Bound Succinylated Milk Protein Concentrate and Evaluation of Its Stability. Food Chem. 2016, 196, 800–807. DOI: 10.1016/j.foodchem.2015.10.020.
- Chegini, G. R.; Ghobadian, B. Effect of Spray-drying Conditions on Physical Properties of Orange Juice Powder. Drying Technol. 2005, 23, 657–668. DOI: 10.1081/DRT-200054161.
- Fazaeli, M.; Emam-Djomeh, Z.; Kalbasi Ashtari, A.; Omid, M. Effect of Spray Drying Conditions and Feed Composition on the Physical Properties of Black Mulberry Juice Powder. Food Bioprod. Process. 2012, 90, 667–675. DOI: 10.1016/j.fbp.2012.04.006.
- Santhalakshmy, S.; Don Bosco, S. J.; Francis, S.; Sabeena, M. Effect of Inlet Temperature on Physicochemical Properties of Spray-dried Jamun Fruit Juice Powder. Powder Technol. 2015, 274, 37–43. DOI: 10.1016/j.powtec.2015.01.016.
- Moghaddam, A. D.; Pero, M.; Askari, G. R. Optimizing Spray Drying Conditions of Sour Cherry Juice Based on Physicochemical Properties, Using Response Surface Methodology (RSM). J. Food Sci. Technol. 2017, 54, 174–184. DOI: 10.1007/s13197-016-2449-8.
- Baldwin, A. J.; Truong, G. N. T. Development of Insolubility in Dehydration of Dairy Milk Powders. Food Bioprod. Process. 2007, 85, 202–208. DOI: 10.1205/fbp07008.
- Goula, A. M.; Adamopoulos, K. G. Effect of Maltodextrin Addition during Spray Drying of Tomato Pulp in Dehumidified Air: II. Powder Properties. Drying Technol. 2008, 26, 726–737. DOI: 10.1080/07373930802046377.
- Klinkesorn, U.; Sophanodora, P.; Chinachoti, P.; Decker, E. A.; McClements, D. J. Characterization of Spray-dried Tuna Oil Emulsified in Two-layered Interfacial Membranes Prepared Using Electrostatic Layer-by-layer Deposition. Food Res. Int. 2006, 39, 449–457. DOI: 10.1016/j.foodres.2005.09.008.
- Goula, A. M.; Adamopoulos, K. G. Spray Drying of Tomato Pulp: Effect of Feed Concentration. Drying Technol. 2004, 22, 2309–2330. DOI: 10.1081/DRT-200040007.
- Quek, S. Y.; Chok, N. K.; Swedlund, P. The Physicochemical Properties of Spray-dried Watermelon Powders. Chem. Eng. Process. 2007, 46, 386–392. DOI: 10.1016/j.cep.2006.06.020.
- Telang, A. M.; Thorat, B. N. Optimization of Process Parameters for Spray Drying of Fermented Soy Milk. Drying Technol. 2010, 28, 1445–1456. DOI: 10.1080/07373937.2010.482694.
- Wang, W.; Dufour, C.; Zhou, W. Impacts of Spray-Drying Conditions on the Physicochemical Properties of Soy Sauce Powders Using Maltodextrin as Auxiliary Drying Carrier. CYTA- J. Food. 2015, 13, 548–555. DOI: 10.1080/19476337.2015.1014430.
- Gallo, L.; Llabot, J. M.; Allemandi, D.; Bucalá, V.; Piña, J. Influence of Spray-drying Operating Conditions on Rhamnus purshiana (cáscara Sagrada) Extract Powder Physical Properties. Powder Technol. 2011, 208, 205–214. DOI: 10.1016/j.powtec.2010.12.021.
- Chegini, G. R.; Ghobadian, B. Spray Dryer Parameters for Fruit Juice Drying. World J. Agric. Sci. 2007, 3, 230–236.
- Phisut, N. Spray Drying Technique of Fruit Juice Powder: Some Factors Influencing the Properties of Product. Int. Food Res. J. 2012, 19, 1297–1306.
- Maury, M.; Murphy, K.; Kumar, S.; Shi, L.; Lee, G. Effects of Process Variables on the Powder Yield of Spray-dried Trehalose on a Laboratory Spray-dryer. Eur. J. Pharm. Biopharm. 2005, 59, 565–573. DOI: 10.1016/j.ejpb.2004.10.002.
- Tengse, D. D.; Priya, B.; Kumar, P. A. R. Optimization for Encapsulation of Green Tea (Camellia sinensis L.) Extract by Spray Drying Technology. J. Food Meas. Charact. 2017, 11, 85–92. DOI: 10.1007/s11694-016-9374-4.