
ABSTRACT
A deeper understanding of milk composition from different dairy goat breeds would address the potential variance in quality control, as well as to optimize the production process of dairy products. Understanding these parameters will assist in evaluating goat milk quality. This study was designed to identify potential differentiating features the milk from different goat breeds based on fourier transform infrared spectroscopy (FTIR) coupled with multivariate analysis to detect the compositional differences. Eighteen freeze-dried goat milk samples of different breeds (Jamnapari, Saanen and Toggenburg) were analyzed. The results showed a clear discrimination between three different breeds using Partial least square discriminant analysis. The value Q2 and R2Y values are 0.981 and 0.958, which means the model exhibited goodness-of-fit and predictive features that would allow milk samples to be segregated by breed reliably. Result of chemical composition show Jamnapari milk was superior in terms of protein, fat and lactose content with values of 3.7%, 4.20%, and 5.30%, respectively, compared to other breeds. These analyses showed that only Jamnapari goat milk is different compared to the other two breeds.
Introduction
The world’s goat population is estimated to be over 921 million, with 570 breeds.[Citation1] Previous study from Devendra & Haenlein, has reported that out of 570 goat breeds, only 69 of them are single-purpose dairy types.[Citation2] Out of 69 dairy breeds, 36 breeds (about 52%) originated from Europe, 25 breeds (37%) from Asia and followed by 8 breeds (11%) from Africa. According to the Food and Agriculture Organization, the total percentage of goat milk production is only about 3.6% in Asia.[Citation3] In Malaysia, the population of goat reported by Aziz,[Citation4] during the year 2005, there were 428, 263 goats with approximately 200,000 reared mainly by smallholders. However, the population had increased to 439,667 heads in 2015.[Citation5]
Milk composition and nutritional value are influenced by several factors such as genetics, seasonal variation, lactation stage, diet and differ significantly among breeds and species of dairy animals.[Citation6,Citation7] According to Ramunno et al.[Citation8] goat breeds have been extensively studied for their genetic polymorphism that affects the milk chemical composition, structural, biological and nutritional characteristics. The identification and classification of food constituents are typically executed by analyzing and classifying the food components into broad categories such as fats, protein, fiber, carbohydrates, vitamins, and ash.[Citation9] Some studies Morand-Fehr et al.[Citation10] have reported that milk quality can be evaluated according to nutritional, sanitary, technological and sensory parameters. These criteria depend on numerous factors and their interactions, which are linked to the main physicochemical components (fat, protein, lactose). Proteins in goat milk differ genetically from proteins in cow milk. Besides, the fat in goat milk typically presents a more nutritious fatty acid profile than the fat in cow milk.[Citation11] Goat milk has a higher percentage of short-and medium-chain (C6-C14) fatty acids and smaller fat globules sizes which contributes to the main reason for the easy digestion of goat milk.[Citation12–Citation14] The previous study also indicated that the genetic variability might affect the concentration of minor components with health-promoting effects.[Citation15]
This study focused on three different breeds, which were Saanen, Jamnapari, and Toggenburg. Saanen is the highest milk-producing breed, and is widely known as the world best-developed breed. This breed of goats is completely white or light cream in color with erect ears.[Citation16] Meanwhile, the Jamnapari is kept for meat and milk, and is known for fairly high milk production. Jamnaparis are widely distributed in Asia and known as one of the better milk-producing Indian dairy breeds in Asia. The goats are large, tall and white in color.[Citation17] Some of them may be mixed in color, but most of them are white, with very long and pendulous ears that cover their eyes when they are grazing.[Citation2] According to Rout et al.[Citation17] Jamnapari goats have been used to upgrade milk production in other Asian dairy breeds and around the world. Apart from that, Toggenburg is one of the main Swiss dairy breeds that recorded daily milk yield that rivals the Saanen breed. The goats are medium in body size, hardy, have erect ears, and the color varies from light drawn to dark chocolate.[Citation16]
FTIR is a rapid metabolic fingerprinting that can potentially analyze milks in less than a minute with minimal sample preparation.[Citation18] FTIR is a method that predominantly measures the vibrations of chemical bonds within functional groups and generates a spectrum that can be considered as a biochemical or metabolic ‘fingerprint‘ of the sample.[Citation19] This technology has been used for a wide range of application in milk analysis: quantification of milk components,[Citation20] detection of milk from different species,[Citation21] prediction of fatty acid composition in milk[Citation22,Citation23] and determination of protein composition in milk.[Citation24,Citation25] The characteristic absorption bands are associated with these components, e.g. the amide signals for protein, the carbonyl ester and C-H signals associated with fat, the C-OH bands for carbohydrate and the O-H bending absorption of water.[Citation26] Currently, there is a lack of data on goat’s milk related to certain breeds, but it does seem clear that there is a significant increase in demand for high-quality goat’s milk due to increased claims of its benefits to human health. However, the combination of FTIR with partial least square (PLS) analysis, has been applied in past studies to discriminate different types of oils[Citation27] and to detect adulteration of extra virgin oil with palm oil[Citation28] with very good predictive values.
The main advantages of this technique is simple, inexpensive and the spectrum can be obtained in a few seconds with a minimal sample preparation.[Citation17] The different analyzed samples can be group as a function of different variables, called principal components, which can be used to explain correlations among the studied samples.[Citation29] Meanwhile, the Multivariate Data Analysis (MVDA) is an appropriate tool for managing large data sets acquired using spectroscopic tools.[Citation30] The Principal Component Analysis (PCA) is data analysis tools that identify the patterns in the collected data and expressing them by accentuating their similarities and differences.[Citation31,Citation32] This method was employed in classifying and discriminating samples based on their chemical constituents.[Citation33] Therefore, the current study was to discriminate the milk samples from different types of goat breeds using the combination of FTIR spectroscopy with multivariate analysis.
Methodology
Chemicals and reagents
Concentrated sulfuric acid (H2SO4), mix catalyst: 96% sodium sulfate anhydrous +3.5% copper sulfate +0.5% selenium dioxide, sodium hydroxide (NaOH), Indicator solution: 0.2% methyl red +0.1% methylene blue in 96% ethanol, petroleum ether, Isopropanol (C3H8O), acetonitrile (HCN), boric acid (H3BO3) were purchased from Sigma-Aldrich (St. Louis, Missouri, United State). Standards of sugar (lactose) were purchased from Sigma Aldrich (St. Louis, Missouri, United State). Ultrapure water was obtained using the Milli–Q System (Millipore, Bedford, MA, USA).
Sample collection and preparation
Fresh goat milk from three breeds (Saanen, Jamnapari and Toggenburg), was collected from a farm in Kluang, Johor at the mid lactation stage and under the same field conditions (breeding, seasonal, climate, and animal handlers). All animals were adjudged to be clinically healthy and disease-free, fed regularly with grass and feed consisting of vegetables with specific supplements, and other concentrate food that improve the quality of milk. All three goat breeds were milked manually and the collection was done early morning in the farm. Only midstream samples were taken, and about 200 mL were obtained from each doe. Samples were immediately transported back to the lab in sterile bottles under aseptic technique and cool condition. Samples were stored at −80°C until further analysis to prevent chemical changes or reactions. The results acquired were performed on a limited number of goats per group (n = 6). The milk samples were freeze-dried to remove the water content using the Labconco FreeZone 4.5 L Freeze Dry Sysytem (Missouri, USA) coupled with auto refrigeration mode and vacuum set to 0.770 mbar until the sample had completely dried. All analysis were conducted within 3 months after collection.
FTIR spectroscopy
The FTIR analysis was performed according to the method described by Ferrand-Calmels et al.[Citation34] with some modification using FTIR spectrometer with diamond/ZnSe crystal cell ATR (RX-1 Perkin Elmer, Massachusetts, USA). To obtain the spectra, 1 g of freeze-dried samples was used and the FT-IR spectra were collected in 30 s at wave number region of 400–4000 cm−1 and a resolution of 4 cm−1.
Lactose in goat milk by HPLC
The lactose content was analyzed using the high performance liquid chromatography (WATERS, Milford, USA) with a refractive index (RI) detector using a method by[Citation35] with a few modifications. The separation was performed using amino column (Luna®NH2 100Å) with 250 mm × 4.6 mm × 5 µm specifications from (Phenomenex, Torrance, USA). The temperature of the column was set at 40ºC. Furthermore, the chromatographic separation was executed with an isocratic elution mobile phase of acetonitrile-water (80:20) and degassed before used. The flowrate was set to 0.1 mL/min and 10 µl of the sample was injected. Prior to HPLC analysis, the milk samples were processed. A volume of 1 mL of milk sample was diluted with 200 µL of Isopropanol and centrifuged at 10 956 × g rcf (10 min, 4ºC) using Sigma 3–18 K centrifuge, (Sartorius, Germany). The supernatant was taken and diluted in water (1:1 ratio) and filtered using nylon 0.45 µm syringe filter (Millipore, UK). Peaks were identified based on the retention time in relative to the standard sugars. The concentration of lactose was calculated based on the equation from a standard curve of standard prepared from three solutions at different concentrations. The limit of detection (LOD) and the limit of quantification (LOQ) was 0.078 and 0.260 mg L−1, respectively.
Protein and fat analysis
Kjeldahl and Gerber analysis were carried out for protein and fat analysis of the milk, respectively, according to standard methods.[Citation36]
FTIR data pre-processing
The data were pre-processed using the Perkin Elmer Spectrum version 10.03.09 software (Massachusetts, USA), which were subsequently calculated through multivariate data analysis as described earlier.[Citation37] Multivariate data analysis was performed using SIMCA 14.0 (version 14.0, Umetrics, Umea, Vasterbotten, Sweden). Each FTIR spectrum was baseline corrected using Spectrum software (Perkin Elmer, Inc.) to minimize the differences between spectra because of baseline shifts. The american standard code for information interchange (ASCII) data were exported from the software used to control the FTIR instrument into an excel file and then imported into the SIMCA 14.0 software. The supervised partial least-squares discriminant analysis (PLS-DA)[Citation38] was used to discriminates the samples based on different types of goat breeds. The accuracy of the model was evaluated using two parameters: (i) value of Q2Y, the root-mean-square error of cross validation, (RMSECV) and (ii) value of R2Y the root-mean-square errors of estimation, R2Y (RMSEE).[Citation39]
Statistical analysis
The data obtained for protein, fat and lactose content were statistically analyzed using the SPSS software program (version 23.0, IBM Inc, Armonk, New York) for analysis of variance. One-way ANOVA with a Duncan’s comparison test to evaluate the major differences between the samples with a confidence interval of 95% was performed.
Results and discussion
FTIR analysis
shows the spectra of milk samples of Saanen, Jamnapari, and Toggenburg in the spectroscopic region. The discrimination between milk samples of different goat breed was based on the small differences between the spectra. In general, the spectra of Jamnapari and Toggenburg milks showed a very similar pattern. In the wavenumber range from 3000 to 950 cm−1, fat, protein and lactose were predicted from the whole IR spectrum.[Citation34] The O-H bending region (3020 cm−1) was more or less opaque to IR light in milk samples due to a high proportion of water in milk.[Citation22] The previous study reported that the spectral feature between 2300 and 2000 cm−1 was resulted from diamond absorption. Following this, the region was ignored in subsequent discussions.[Citation37] The spectral regions from 2877 to 2827 cm−1 and 1782 to 1705 cm−1 were selected for fat, while the region from 1701 to 1507 cm−1 was selected for protein and the region from 1200 to 967 cm−1 was for carbohydrates.[Citation40] Peak at 1683–1682 cm−1 was due to the carbonyl (C = O) stretching amide I.[Citation41] The absorption at region 1549–1547 cm−1was corresponded to the N-H bending that contributed by the C-N stretching (amide II) and the phenyl nucleus (C = C).[Citation23,Citation41] No specific band was observed at the spectral region between 1800 and 2800 cm−1, providing no related chemical information about the milk samples. These findings were in agreement with that found by Andersen et al. and Inon et al.[Citation40,Citation42]
Figure 1. Mid-infrared spectra for the 4000–400 cm−1 spectral region recorded on milk samples of Jamnapari (J), Saanen(S) and Toggenburg(T) breeds
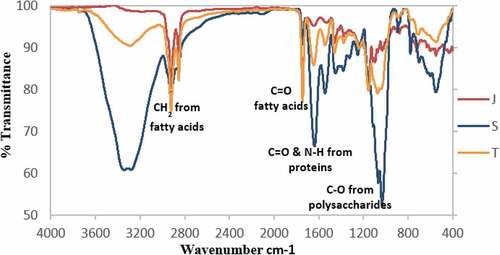
Based on , the similarity pattern of each spectra regions demonstrated minor differences between Jamnapari and Toggenburg samples, while Saanen shows a distinct difference compared to other two breeds. The first difference involved the CH2 absorption band at 2927 cm−1 which is related to the acyl chain on fatty acids that correlates with the fat quantity in each milk sample.[Citation20] As reported in , the Toggenburg and Jamnapari milks had 2.98% and 4.20% fat composition, respectively, whereas Saanen milk had 2.53% fat. This was reflected in the CH2 stretch. The second difference was observed at 1745 cm−1 of carbonyl vibration ester group. This peak was shown as a shoulder in the Jamnapari milk spectrum but was clear in the Toggenburg milk spectrum. This can be correlated to the degree of sugars, carbonxyl methyl esterification.[Citation43] In other words, the degree of esterification of the Toggenburg milk was higher than Jamnapari and Saanen milks. Strong absorption bands due to carbonyl (C = O) group of milk lipid dominated at the spectral region between 1720 and 1760 cm−1, which was in agreement to that by Dagnachew et al.[Citation44]
Table 1. The average composition of milk samples from Jamnapari, Saanen and Toggenburg
Multivariate data analysis
shows the data of FTIR spectra between different goat breeds (Jamnapari, Toggenburg, and Saanen) analyzed using PLS-DA score plots. This plot shows the possible presence of outliers, groups, similarities, and other patterns in the data. The models below demonstrates the distribution pattern samples from different goat breeds. The X-axis represents PLS-DA component 1 while the Y-axis represents PLS-DA component 2.The ellipse in the plots defines the Hotelling’s T2 confidence region corresponding to a 95% confidence interval for the observations.[Citation45] Furthermore, the quality of the models was evaluated based on the basis of cumulative parameters R2X (variation in X explained by the model), R2Y (amount of Y explained by the model), and Q2 (the cumulated cross-validation for R2Y).[Citation46] The model’s goodness-of-fit and predictive ability are regarded as a good when the cumulative values of Q2 and R2Y were greater than 0.5.[Citation30] Moreover, Gao et al.[Citation47] and Kim et al.[Citation48] reported that the values of Q2 and R2Y greater than 0.5 were considered as a robust model with predictive reliability. In this study, the Q2 and R2Y values were 0.981 and 0.958, respectively. This proved that the model exhibited goodness-of-fit and predictive features.
Figure 2. Partial least square discriminant analysis (PLS-DA)score scatter plot of milk from different goat breeds; Jamnapari (J), Saanen (S) and Toggenburg (T)
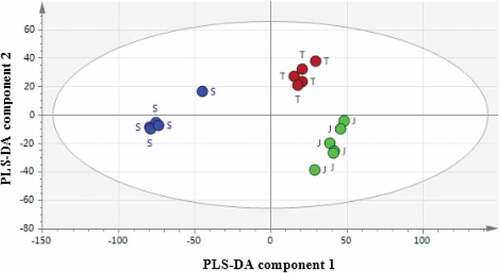
Apart from that, the score plot on showed general separations (using PC1 and PC2) whereas the total variation in the data contributed mainly by several variables such as protein, fat, and lactose content. The predictive power of the model in predicting new samples was measure by RMSECV value.[Citation49] For this model, RMSECV values were 0.084798. Note that, the higher the predictive accuracy for new samples is due to lower RMSECV value. The PLS-DA score plots presented a clear separation between three different breeds without any overlap. The milk samples belonged to Jamnapari and Toggenburg breeds (J, T) were observed to be at the positive of PLS-DA component 1, while the milk samples from Saanen breeds (S) were observed at the negative of PLS-DA component 1.
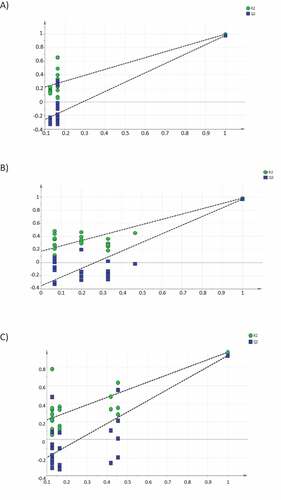
shows the permutation test plot, which characterize the validation of the PLS-DA model developed. The plot demonstrates the predictive capacity of the model intercept Y-value and the fraction of the total sum of the squares intercept the Y-value.[Citation49] To interpret the multivariate models, the mean of R2Yand cumulative Q2Y were used after cross-validation. The R2Y showed the number of Y variables explained by the models and provides an overview of the model fitting. Meanwhile, the Q2Y provides information about the predictive quality of the model. The R2Y and Q2Y value for the breeds are as follows: Saanen (A), 0.131 and −0.398; Jamnapari (B), 0.173 and −0.354; Toggenburg (C), 0.133 and −0.326, respectively. These values were acceptable since the R and Q was less or equal 0.4 and −0.05.[Citation50] This study concluded that all models were valid and strongly significant. In addition, the approach using all the information retrieved from the spectra of the milk samples was effective to obtain a complete characterization of milk samples according to different breeds.
Figure 3. The permutation plot with the R2Yand Q2Y value for: Saanen (A), 0.131 and −0.398; Jamnapari (B), 0.173 and −0.354; Toggenburg (C), 0.133 and −0.326, respectively
Fat, protein and lactose analysis
In this study, significant differences (p <.05) of chemical composition among the three different breeds were reported. The milk samples showed varying results in terms of chemical composition, as shown in , although the three goat breeds chosen were kept and fed under identical conditions at the same farm. The previous study reported that there might be considerable differences in chemical composition and physical properties of milk from different goat breeds.[Citation51,Citation52]
The milk samples of Saanen breed had the lowest value of fat (2.53%), while the Jamnapari milk presented the highest fat (4.20%) and protein (3.73%) content. The percentage of milk fat for all goat breeds were in the range reported by Alyaqoubi et al.[Citation53] which was between 2.43% and 4.43%. In addition, goat milk contained 3.4% protein, 3.8% fat, 4.1% lactose, 0.8% ash[Citation54] and 87% water.[Citation55] For milk sample from Toggenburg breed, the fat and protein content were within the previously reported range.[Citation54] It had the lowest protein content (2.97%) compared to other breeds, but was still in the range of percentage reported by Uqasha & Al-Jiborry,[Citation56] which was between 2.46% and 3.70%. Toggenburg is known for a long, steady lactation and generally has a closer protein to fat ratio.[Citation15] Generally, the differences in milk constituents compared to the literature can be attributed by the parity of goat,[Citation57,Citation58] lactation stage, as well as different breeds.[Citation59]
The result shows that there was a variation of milk’s total carbohydrate across breed in this study. Jamnapari does had the highest lactose content (5.30%) compared to Saanen and Toggenburg milk 4.52% and 4.84%, respectively. In fact, the differences were statistically significant across breeds. The previous study reported that the lactose content of goat milk ranges between 4.1% and 5.2%.[Citation56] High lactose production is related to high volume production by dairy goat breeds which produces high milk yield.[Citation60] The lactose content in goat milk samples was similar to that reported by Strzalkowska et al.[Citation61] Based on the study of goat in South Africa, it was reported that indigenous goat breeds had higher lactose content (average 4.6%) than dairy goat breeds (4.1%) because indigenous breed have higher blood glucose concentration than the dairy does.[Citation62] Generally, the composition of goat milk differed significantly (p <.05) among the milk samples across the breed, with some samples being more statistically superior to others. Jamnapari milk was superior in terms of protein, fat, and lactose content with values of 3.73%, 4.20%, and 5.30%, respectively. Jamnapari goats breed well under the hot and arid climate of the Indian subcontinent due to its high climatic adaptability.[Citation63] Therefore, it could be suggested that the differences in composition of milk samples might be due to the genetic variation among the breeds.
Conclusion
The results showed that the Jamnapari breed exhibit the highest protein, fat, and lactose content compared to Saanen and Toggenburg breeds. The differences were significant, and allowed the milk from Jamnapari breed to be differentiated from other two breeds. The current work demonstrated the feasibility of using FTIR spectral fingerprinting and multivariate analysis technique to correctly classify goat milk samples by their breeds of origins, using the functional group profiles as a predictors.
Acknowledgments
The authors would like to thank the Ministry of Higher Education (MOHE) of Malaysia for financial suppport [grant number: UPM/700-2/1/TRGS/5535704] and for HICOE research environment (Tropical Agrifood) under the Institute of Tropical Agriculture and Food Security (ITAFoS).
Additional information
Funding
References
- FAOSTAT. FAO Statistical Yearbook 2013. http://faostat.fao.org/site/291/default.aspx ( accessed 2013).
- Devendra, C.; Haenlein, G. F. W. Animals that Produce Dairy Foods: Goat Breeds. In Encyclopedia of Dairy Science, 2nd ed.; Fuquay, J. W., Fox, P. F., Mcsweeney, P. L. H., Eds.; Academic Press: San Diego, CA, 2011; Vol. 1, pp 310–324.
- FAO. Livestock Keepers-guardians of Biodiversity. Animal Production and Health Paper; Rome: Italy, 2009.
- Aziz, A. J. Wealth Creation through Livestock Production. Proceedings of 19th Veterinary Association Malaysia Congress, VAM, Malaysia, 2007; pp 1–3.
- Shahudin, M. S.; Ghani, A. A. A.; Zamri-Saad, M.; Zuki, A. B.; Abdullah, F. F. J.; Wahid, H.; Hassim, H. A. The Necessity of a Herd Health Management Programme for Dairy Goat Farms in Malaysia. Trop. Agric. Sci. 2018, 41, 1, 1–18.
- Medhammar, E.; Wijesinha-Bettoni, R.; Stadlmayr, B.; Nilsson, E.; Charrondiere, U. R.; Burlingame, B. Composition of Milk from Minor Dairy Animals and Buffalo Breeds: A Biodiversity Perspective. J. Sci. Food Agri. 2012, 92, 445–474. DOI: 10.1002/jsfa.4690.
- Le, A.; Barton, L. D.; Sanders, J. T.; Zhang, Q. Exploration of Bovine Milk Proteome in Colostral and Mature Whey Using an Ion-exchange Approach. J. Proteome Res. 2011, 10, 692–704. DOI: 10.1021/pr100884z.
- Ramunno, L.; Pauciullo, A.; Mancusi, A.; Cosenza, G.; Mariani, P.; Malacame, M. Influence of Genetic Polymorphism of the Calcium Sensitive Caseins on the Structural and Nutritional Characteristics and on the Dairy Aptitude and Hypoallergenic Properties of Goat Milk. Scienza E Tecnica Lattiero Casearia. 2007, 58, 257–271.
- Wishart, D. S. Metabolomics: Application in Food Science and Nutrition Research. Trends Food Sci. Technol. 2008, 19, 482–493. DOI: 10.1016/j.tifs.2008.03.003.
- Morand-Fehr, P.; Fedele, V.; Decandia, M.; Le Frileux, Y. Influence of Farming and Feeding Systems on Composition and Quality of Goat and Sheep Milk. Small Rumin. Res. 2007, 68, 20–34. DOI: 10.1016/j.smallrumres.2006.09.019.
- Park, Y. W.; Haenlein, G. F. W. Handbook of Milk of Non-Bovine Mammals; Blackwell Publishing Asia: Australia, 2006.
- Fevrier, C.; Mourot, J.; Jaquelin, Y.; Mounier, A.; Lebreton, Y. Comparative Digestive Utilization of UHT Goat’s and Cow’s Milks: Nutritional Effects of Gelation-use of a Swine Model. Lait. 1993, 73, 581–592.
- Lopez-Aliaga, I.; Dı´az-Castro, J.; Alf-erez, M. J. M.; Barrionuevo, M.; Campos, M. S. A Review of the Nutritional and Health Aspects of Goat Milk in Cases of Intestinal Resection. Dairy Sci. Technol. 2010, 90, 611–622. DOI: 10.1051/dst/dst2010028.
- Attaie, R.; Richtert, R. Size Distribution of Fat Globules in Goat Milk. J. Dairy Sci. 2000, 83, 940–944.15. DOI: 10.3168/jds.S0022-0302(00)74957-5.
- Michaelidou, A. M. Factors Influencing Nutritional and Health Profile of Milk and Milk Products. Small Ruminant Res. 2008, 79, 42–50. DOI: 10.1016/j.smallrumres.2008.07.007.
- Hedrich, C.; Duemler, C.; Considine, D. Best Management Practices for Dairy Goat Farmers; University of Wisconsin Emerging Agricultural Markets Team-The Wisconsin Dairy Goat Association: USA, 2008.
- Rout, P. K.; Saxena, V. K.; Khan, B. U.; Roy, R.; Mandal, A.; Singh, S. K.; Singh, L. B. Characterization of Jamnapari Goats in Their Home Tract. Anim. Genet. Resour. Inf. 2004, 27, 43–52. DOI: 10.1017/S1014233900001280.
- Nicolaou, N.; Goodacre, R. Rapid and Quantitative Detection of the Microbial Spoilage in Milk Using Fourier Transform Infrared Spectroscopy and Chemometrics. Analyst. 2008, 133, 1424–1431. DOI: 10.1039/b804439b.
- Griffiths, P. R.; De Haseth, J. A. Fourier Transform Infrared Spectrometry; John Wiley & Sons, New York, 1986.
- Luinge, H. J.; Hop, E.; Lutz, E. T. G.; van Hemert, J. A.; de Jong, E. A. M. Determination of the Fat, Protein and Lactose Content of the Milk Using Fourier Transform Infrared Spectrometry. Anal. Chim. Acta. 1993, 284, 419–433. DOI: 10.1016/0003-2670(93)85328-H.
- Nicolaou, N.; Xu, Y.; Goodacre, R. Fourier Transform Infrared Spectroscopy and Multivariate Analysis for the Detection and Quantification of Different Milk Species. J. Dairy Sci. 2010, 93, 5651–5660. DOI: 10.3168/jds.2010-3619.
- Soyeurt, H.; Dardenne, P.; Dehareng, F.; Lognay, G.; Veselko, D.; Marlieer, M.; Bertozzi, C.; Mayeres, P.; Gengler, N. Estimating Fatty Acid Content in Cow Milk Using Mid-infrared Spectrometry. J. Dairy Sci. 2006, 89, 3690–3696. DOI: 10.3168/jds.S0022-0302(06)72409-2.
- Afseth, N. K.; Matens, H.; Randby, A.; Gidskehaug, L.; Narum, B.; Jorgensen, K.; Lien, S.; Kohler, A. Predicting the Fatty Acid Composition of Milk: A Comparison of Two Fourier Transform Infrared Sampling Techniques. Appl. Spectrosc. 2010, 64, 700–707. DOI: 10.1366/000370210791666200.
- Hewavitharana, A. K.; van Brakel, B. Fourier Transform Infrared Spectrometric Method Fot the Rapid Determination of Casein in Raw Milk. Analyst. 1997, 122, 701–704. DOI: 10.1039/a700953d.
- Rutten, M. J.; Bovenhuis, H.; Heck, J. M. L.; van Arendonk, J. A. M. Predicting Bovine Milk Protein Composition Based on Fourier Transform Infrared Spectra. J. Dairy Sci. 2011, 94, 5683–5690. DOI: 10.3168/jds.2011-4520.
- Bellamy, L. J. The Znfra-red Spectra of Complex Molecules; John Wiley & Sons: New York, 1958.
- Dahlberg, D. B.; Lee, S. M.; Wenger, S. J.; Vargo, J. A. Classification of Vegetable Oils by FTIR. Appl. Spectrosc. 1997, 51, 1118–1124. DOI: 10.1366/0003702971941935.
- Rohman, A.; Man, Y. B. C. Fourier Transform Infrared (FTIR) Spectroscopy for Analysis of Extra Virgin Olive Oil Adulterated with Palm Oil. Food Res. Int. 2010, 43, 886–892. DOI: 10.1016/j.foodres.2009.12.006.
- Castro-Puyana, M.; Herrero, M. Metabolomics Approaches Based on Mass Spectrometry for Food Safety, Quality and Traceability. Trends Anal. Chem. 2013, 52, 74–87. DOI: 10.1016/j.trac.2013.05.016.
- Javadi, N.; Abas, F.; Hamid, A. A.; Simoh, S.; Shaari, K.; Ismail, I. S.; Mediani, A.; Khatib, A. GC‐MS‐Based Metabolite Profiling of Cosmos Caudatus Leaves Possessing Alpha‐Glucosidase Inhibitory Activity. J. Food Sci. 2014, 79, 6, 1130–1136. DOI: 10.1111/1750-3841.12491.
- Benincasa, C.; Lewis, J.; Sindona, G.; Tagarelli, A. The Use of Multi Element Profiling to Differentiate between Cow and Buffalo Milk. Food Chem. 2008, 110, 1, 257–262. DOI: 10.1016/j.foodchem.2008.01.049.
- Shin, E. C.; Craft, B. D.; Pegg, R. B.; Phillips, R. D.; Eitenmiller, R. R. Chemometric Approach to Fatty Acid Profiles in Runner-type Peanut Cultivars by Principal Component Analysis (PCA). Food Chem. 2010, 119, 3, 1262–1270. DOI: 10.1016/j.foodchem.2009.07.058.
- Dettmer, K.; Aronov, P. A.; Hammock, B. D. Mass Spectrometry- Based Metabolomics. Mass Spectrom. Rev. 2007, 26, 51–78. DOI: 10.1002/mas.20108.
- Ferrand-Calmels, M.; Palhière, I.; Brochard, M.; Leray, O.; Astruc, J. M.; Aurel, M. R.; Barbey, S.; Bouvier, F.; Brunschwig, P.; Caillat, H.; et al. Prediction of Fatty Acid Profiles in Cow, Ewe, and Goat Milk by Mid-infrared Spectrometry. J. Dairy Sci. 2014, 97, 1, 17–35. DOI: 10.3168/jds.2013-6648.
- Silvano, M. F.; Varela, M. S.; Palacio, M. A.; Ruffinengo, S.; Yamul, D. K. Physicochemical Parameters and Sensory Properties of Honeys from Buenos Aires Region. Food Chem. 2014, 152, 500–507. DOI: 10.1016/j.foodchem.2013.12.011.
- AOAC. Official Methods of Analysis of AOAC International; AOAC: Gaithersburg, MD, 2005. 17th Vol. II, 33: 934.01, 942.05, 991.20, 2000.18.
- Elbassbasi, M.; Kzaiber, F.; Ragno, G.; Oussama, A. Classification of Raw Milk by Infrared Spectroscopy and Chemometric. J. Sci. Speculations Res. 2010, 1, 2, 28–33.
- Sundekilde, U.; Larsen, L.; Bertram, H. NMR-based Milk Metabolomics. Metabolites. 2013, 3, 2, 204–222. DOI: 10.3390/metabo3020204.
- Easmin, S.; Sarker, M. Z. I.; Ghafoor, K.; Ferdosh, S.; Jaffri, J.; Ali, M. E.; Mirhosseini, H.; Al-Juhaimi, F. Y.; Perumal, V.; Khatib, A. Rapid Investigation of α-glucosidase Inhibitory Activity of Phaleria Macrocarpa Extracts Using FTIR-ATR Based Fingerprinting. J. Food Drug Anal. 2017, 25, 2, 306–315. DOI: 10.1016/j.jfda.2016.09.007.
- Inon, F. A.; Garrigues, S.; de la Guardia, M. Nutritional Parameters of Commercially Available Milk Samples by FTIR and Chemometric Techniques. Anal. Chim. Acta. 2004, 513, 2, 401–412. DOI: 10.1016/j.aca.2004.03.014.
- Zaleska, H.; Tomasik, P.; Lii, C. Y. Formation of Carboxymethyl Cellulose-casein Complexes by Electrosynthesis. Food Hydrocolloids. 2002, 16, 215–224. DOI: 10.1016/S0268-005X(01)00085-6.
- Anderson, S. K.; Hansen, P. W.; Andersen, H. V. Vibrational Spectroscopy in the Analysis of Dairy Products and Wine. In Handbook of Vibrational Spectroscopy; Chalmers, J. M., Griffiths, P. R., Eds.; John Wiley & Sons Ltd: West Sussex, UK, 2002; pp 3672–3681.
- Chatjigakis, A. K.; Pappas, C.; Proxenia, N.; Kalantzi, O.; Rodis, P.; Polissiou, M. FT-IR Spectroscopic Determination of the Degree of Esterification of Cell Wall Pectins from Stored Peaches and Correlation to Textural Changes. Carbohydr. Polym. 1998, 37, 4, 395–408. DOI: 10.1016/S0144-8617(98)00057-5.
- Dagnachew, B. S.; Kohler, A.; Adnoy, T. Genetic and Environmental Information in Goat Milk Fourier Transform Infrared Spectra. J. Dairy Sci. 2013, 96, 3973–3985. DOI: 10.3168/jds.2012-5972.
- Yang, Y.; Zheng, N.; Zhao, X.; Zhang, Y.; Han, R.; Yang, J.; Wang, J. Metabolomic Biomarkers Identify Differences in Milk Produced by Holstein Cows and Other Minor Dairy Animals. J. Proteomics. 2016, 136, 174–182. DOI: 10.1016/j.jprot.2015.12.031.
- Scano, P.; Murgia, A.; Pirisi, F. M.; Caboni, P. A Gas Chromatography-mass Spectrometry-based Metabolomic Approach for the Characterization of Goat Milk Compared with Cow Milk. J. Dairy Sci. 2014, 97, 10, 6057–6066. DOI: 10.3168/jds.2014-8247.
- Gao, X.; Pujos-Guillot, E.; Martin, J. F.; Galan, P.; Juste, C.; Jia, W.; Sebedio, J. L. Metabolite Analysis of Human Fecal Water by Gas Chromatography Mass Spectrometry with Ethyl Chloroformate Derivatization. Anal. Biochem. 2009, 393, 2, 163–175. DOI: 10.1016/j.ab.2009.06.036.
- Kim, J. Y.; Park, J. Y.; Kim, O. Y.; Ham, B. M.; Kim, H. J.; Kwon, D. Y.; Jang, Y.; Lee, J. H. Metabolic Profiling of Plasma in Overweight/obese and Lean Men Using Ultra Performance Liquid Chromatography and Q-TOF Mass Spectrometry (UPLC− Q-TOF MS). J. Proteome Res. 2010, 9, 9, 4368–4375. DOI: 10.1021/pr100101p.
- Murugesu, S.; Ibrahim, Z.; Ahmed, Q. U.; Nik Yusoff, N. I.; Uzir, B. F.; Perumal, V.; Abas, F.; Saari, K.; El-Seedi, H.; Khatib, A. Characterization of α-Glucosidase Inhibitors from Clinacanthus Nutans Lindau Leaves by Gas Chromatography-Mass Spectrometry-Based Metabolomics and Molecular Docking Simulation. Molecules. 2018, 23, 9, 2402. DOI: 10.3390/molecules23092402.
- Trivedi, D. K.; Iles, R. K. The Application of SIMCA P+ in Shotgun Metabolomics Analysis of ZIC® HILIC-MS Spectra of Human Urine-experience with the Shimadzu IT-TOF and Profiling Solutions Data Extraction Software. J. Chromatogr. Sep. Tech. 2012, 3, 1–5. DOI: 10.4172/2157-7064.1000145.
- Raynal-Ljutovac, K.; Lagriffoul, G.; Paccard, P.; Guillet, I.; Chilliard, Y. Composition of Goat and Sheep Milk Products: An Update. Small Ruminant Res. 2008, 79, 1, 57–72. DOI: 10.1016/j.smallrumres.2008.07.009.
- Trancoso, I. M.; Trancoso, M. A.; Martins, A. P.; Roseiro, L. B. Chemical Composition and Mineral Content of Goat Milk from Four Indigenous Portuguese Breeds in Relation to One Foreign Breed. Int. J. Dairy Technol. 2010, 63, 4, 516–522. DOI: 10.1111/j.1471-0307.2010.00625.x.
- Alyaqoubi, S.; Abdullah, A.; Yasir, M. S.; Abdullah Sani, N.; Addai, Z. R.; Al-ghazali, M. Physicochemical Properties and Antioxidant Activity of Milk Samples Collected from Five Goat Breeds in Malaysia. Adv. J. Food Sci. Technol. 2015, 7(4), 235–241. DOI: 10.19026/ajfst.7.1301.
- Park, Y. W.; Juarez, M.; Ramos, M.; Haenlein, G. F. W. Physico-chemical Characteristics of Goat and Sheep Milk. Small Ruminant Res. 2007, 68, 88–113. DOI: 10.1016/j.smallrumres.2006.09.013.
- Iqbal, A.; Khan, B. B.; Tariq, M.; Mirza, M. A. Goat-A Potential Dairy Animal: Present and Future Prospects. J. Agri. Sci. 2008, 45, 2, 227–230.
- Uqasha, A. A.; Al Jiboory, H. L. Chemical and Microbiological Quality of Goat Milk Produced in Al – Shatti Region. Arab Univ. J. Agri. Sci. 2002, 10, 1, 21–29.
- Agnihotri, M. K.; Rajkumar, V. Effect of Breed, Parity and Stage of Lactation on Milk Composition of Western Region Goats of India. Int. J. Dairy Sci. 2007, 2, 2, 172–177. DOI: 10.3923/ijds.2007.172.177.
- Goetsch, A. L.; Zeng, S. S.; Gipson, T. A. Factors Affecting Goat Milk Production and Quality. Small Ruminant Res. 2011, 101, 1–3, 55–63. DOI: 10.1016/j.smallrumres.2011.09.025.
- Pal, U. K.; Agnihotri, M. K.; Singh, D. Influence of Goat Breeds on the Composition of Milk and Paneer. J. Anim. Sci. 1997, 67, 175–176.
- Mirzaei-Aghsaghali, A.; Fathi, H. Lactose in Ruminants Feeding: A Review. Ann. Biol. Res. 2012, 3, 645–650.
- Strzalkowska, N.; Jozwik, A.; Bagnicka, E.; Krzyzewski, J.; Horbanczuk, K.; Pyzel, B.; Horbanczuk, J. O. Chemical Composition, Physical Traits and Fatty Acid Profile of Goat Milk as Related to the Stage of Lactation. Anim. Sci. Papers Rep. 2009, 27, 4, 311–320.
- Pambu, R. G. Effects of Goat Phenotype Score on Milk Characteristics and Blood Parameters of Indigenous and Improved Dairy Goats in South Africa. Doctoral dissertation, University of Pretoria, South Africa, 2011.
- Alibaba. Live Breeding Goats for Sale. http://www.alibaba.com/products-directory/recommended-live-breeding-goats-for-sale ( accessed Feb4, 2014).