
 ?Mathematical formulae have been encoded as MathML and are displayed in this HTML version using MathJax in order to improve their display. Uncheck the box to turn MathJax off. This feature requires Javascript. Click on a formula to zoom.
ABSTRACT
Dielectric heating has been applied in the fishing industry for thawing and cooking. However, the difference in dielectric properties for various species of fish can greatly influence the heating rate and uniformity. In this study, the dielectric properties of saltwater fish [Pomfret (Pampus argenteus) and Hairtail (Trichiurus lepturus)] and freshwater fish [Bream (Parabramis pekinensis) and Crucian Carp (carassius auratus)] were determined within the frequency range of 1–2500 MHz at –20°C to 100°C. Results showed that the dielectric constant () and dielectric loss factor (
) of the four different species decrease with increasing frequency. The dielectric constants at 27.12 and 40.68 MHz increase with increasing temperature, and those at 915 and 2450 MHz increase rapidly and then decrease. The
of Hairtail showed the highest increase, followed by Bream, Crucian Carp, and Pomfret; and the
of Hairtail showed the highest increase, followed by Pomfret, Bream, and Crucian Carp due to the composition difference between the species. Thus, the dielectric heating process for various species of fish can be considerably different at different frequencies. Furthermore, the most significant difference in dielectric properties among all species of fish was observed at 27.12 MHz, which indicated that this frequency could be the most suitable frequency for the detection of fish species based on their dielectric properties.
Introduction
Fish and fish products play an important role in consumers’ diets as they are valuable sources of protein and unsaturated fatty acids such as eicosapentaenoic and docosahexaenoic acids. However, inappropriate processing methods may damage the nutritional values and negatively alter the consumers’ purchasing decisions. In recent years, microwave and radio frequency (RF) heating have become emerging thermal processing technologies in the food industry and have shown advantages in seafood tempering/thawing,[Citation1,Citation2] cooking,[Citation3] and canning.[Citation4,Citation5] The volumetric and fast heating properties help to retain the most nutrients within the fishery products and improve product appearance. For example, Uemura et al.[Citation6] developed an RF unit for quick and uniform thawing of packaged Pacific Sauries. The results showed that RF-treated samples had brighter color and the backbones were softer than the conventionally treated fish. Fiore et al.[Citation7] cooked Salmon in a self-built RF oven and results showed that RF-cooked Salmon had a higher vitamin B retention compared to the conventionally cooked fish. Stephen et al.[Citation8] investigated the chemical changes of Skipjack Tuna (Katsuwonus Pelamis) during cooking (boiling), frying, canning, and microwave heating. The results indicated that microwave and RF heating are fast and volumetric thermal processing methods which retain more of the ω-3 fatty acids beneficial to health in comparison to traditional frying and canning.
During microwave and radio frequency processing, the dielectric properties and penetration depths at the processing frequencies are necessary parameters to assist in process development. Dielectric properties are the intrinsic properties of foods, which are dependent on food composition, density, measuring temperature, and frequency. Fish mostly consists of 70–80% moisture, 20–30% proteins (w.b.), and 2–12% fat (w.b.).[Citation9] The composition may vary considerably among individuals and species.[Citation10,Citation11] The compositional effect on the dielectric properties of the food is complex due to the interactions between components. Research has been conducted to determine the dielectric properties of fishery products and to study the compositional influences. Yang et al.[Citation12] measured the dielectric properties of Antarctic Krill and white Shrimp across the microwave frequency range 300–3000 MHz in a temperature range of −20°C to 20°C to evaluate the effects of moisture, salt, and sucrose contents on dielectric properties for microwave thawing. The results indicate that sucrose content has little effect, but salt has a significant influence (p < 0.05) on the dielectric properties during microwave thawing. The dielectric properties increased gradually with increasing moisture content below −5°C, and the difference in the dielectric properties between different moisture content levels continuously increases with the rising temperature, especially in the temperature range from −5°C to 0°C. Liu et al.[Citation13] measured the dielectric properties of raw and preheated red Sea Bream (Pagrus major), Yellowtail (Seriola quinqueradiata), and Atlantic Salmon (Salmo salar) over the temperature range of 10–90°C and frequency of 200–3660 MHz. The dielectric properties of the red Sea Bream were slightly higher than the other two species. As the temperature increases, the dielectric constant of all the raw samples decreases more sharply than that of all the preheated samples, which is due to moisture loss during heating caused by protein denaturation. Wang et al.[Citation14] measured the dielectric properties for the anterior, middle, tail, and belly of Alaska Pink Salmon (Oncorhynchus gorbuscha) fillets at frequencies in the range 27–1800 MHz from 20°C to 120°C for microwave and RF sterilization. Results showed compositional differences, in particular fat content, contributed to differences in the dielectric properties for different parts of Salmon fillet. It can be seen that although there have been a few studies on the dielectric properties of different species of fish at thawing, cooking, and sterilization temperatures, none of those studies have systematically compared the difference in compositional and dielectric properties between various saltwater and freshwater fish at dielectric heating frequencies and temperatures. Understanding the mechanisms of influence due to the composition of fish species on dielectric properties will help to improve the design of dielectric heating processes. Furthermore, the dielectric properties of different species of fish at different frequencies were found to vary considerably; thus, the results could also be applied as a nondestructive method for the detection of fish species.
The primary objective of this study was to determine the dielectric properties of four different species of fish fillets at temperatures from −20°C to 100°C and frequencies 1–2500 MHz in order to examine the temperature, frequency, and composition influences on their dielectric properties and penetration depth. The pH, electrical conductivity, and composition of the fish including protein, fat, ash content, and moisture content were also determined to provide a thorough understanding of their influence on the variation in dielectric properties among fish species. Penetration depths were calculated based on the dielectric properties in order to assist in process development. Finally, predictive equations for fish dielectric properties were developed for different temperatures and frequencies to allow future researchers to further utilize the properties for dielectric heating process design and fast detection methods.
Materials and methods
Fish sample preparation
Two species of saltwater fish (Pomfret and Hairtail) and two species of freshwater fish (Bream and Crucian Carp) were purchased freshly from a local grocery store (No. 580 Guzong Road, Nanhui New Town, Shanghai, China). The fish fillets were manually cut and kept frozen in −20°C. Fish quality was evaluated and found all meet the Chinese sanitary standards for fresh and frozen aquatic products.
Composition determination
The flesh of each species of the fish was homogenized in preparation for measuring the composition, including moisture, fat, protein, and ash contents, respectively. Ash content was determined with a dry ashing method (AOAC 920.153) at 550°C in a muffle oven (Shanghai Jinghong Experimental Equipment Co., Ltd., China). The moisture content was determined using a constant mass method (AOAC 950.46) at 105°C drying in an electric blast drying oven (Shanghai Boxun Industrial Co., Ltd. Medical Equipment Factory, China) until a constant weight was reached. Fat content was determined by the Soxhlet extraction method (AOAC 960.39) in the FOSS SoxtecTM 2050 automatic Soxhlet fat leaching instrument (Danish Fox Group Corporation, Denmark). Protein content was determined using the Kjeldahl method (AOAC 981.10) in the FOSS KjeltecTM 8400 fully automatic Kjeldahl analyzer (Danish Fox Group Corporation, Denmark). All experiments were replicated three times.
Dielectric properties measurement
The dielectric properties were measured with an open-ended probe (Agilent N1501A, Agilent Technologies Inc., California, USA) connected to a network analyzer (Agilent E5071C, Agilent Technologies Inc., California, USA). A custom-built temperature-holding sample holder (d = 2.5 cm, h = 10 cm) connected to an oil bath (PolyScience Products, Niles, Ill., USA) was used to hold the sample for dielectric property measurement at controlled temperatures, and the open-ended probe was inserted into the sample holder for measurement on the sample surfaces.[Citation15,Citation16] The measuring system was calibrated before each independent measurement to avoid experimental errors. Fish fillets were cut into cylindrical shapes with a diameter of 2.5 cm and fed into the sample holder. The sample temperature was monitored with a type-T thermocouple wire inserted into the geometrical center of the sample throughout the measurement. Measurements were taken only when the thermocouple showed a stable reading of the target sample temperature. The measurements were started when the temperature of the sample inside the measurement cell stabilized at −20°C. Subsequent measurements were taken with a temperature interval of 5°C until 0°C, then with an interval of 10°C up to 100°C. An entire run for the determination of dielectric properties over the frequency range of 1–2500 MHz under a temperature range from −20°C to 100°C took around 5–6 h. The typical error of the system was about 5% after undertaking the standard calibration procedures.[Citation14] All measurements were taken in triplicates.
Electrical conductivity measurement
Electrical conductivity () indicates the ability of a material to conduct an electric current. In a food matrix,
is related to the ionic depolarization,[Citation17] which is one of the mechanisms that contribute to the dielectric loss besides dipole, electronic, and Maxwell–Wagner responses.[Citation18] At frequencies <100 MHz, the ionic conduction effect is the dominant effect contributing to the dielectric loss factor, which can be mathematically expressed as:[Citation15,Citation19]
Taking the logarithm of both sides of EquationEq. (1)(1)
(1) :
where subscripts d and stand for contributions due to dipole rotation and ionic conduction, respectively;
is the electrical conductivity (S m−1) of the dielectric material, f is the frequency (Hz), and
is the permittivity of free space or vacuum (8.854 ×10⁻¹² F m−1).
To verify the measured dielectric loss factor, electrical conductivities over the radio frequency range (<100 MHz) were measured at 20°C with an electrical conductivity meter (ORION STAR A112, Thermo Fisher Scientific Co., Ltd., China). The electrical conductivity meter was calibrated by using a standard solution ( = 1413 μs cm−1) with an electric conductivity close to that of the target measuring samples. A standard calibration was conducted before each measurement following the procedure given in the manual. The conductivity test cell was rinsed with de-ionized water before and between sample measurements in order to remove any impurities adhering to the probe. Prior to the measurement, 10 g of fish fillet sample was minced in a grinder for 2 min and fed into a beaker, then equilibrated in a water bath at 20°C. During the electrical conductivity measurements, the probe was placed in close contact with minced fish samples and the data was taken when the reading was stable on the equipment screen. The electrical conductivity of all fish samples was measured at 20°C in triplicates.
Penetration depth
Penetration depth () is defined as the depth in a material where the energy of a plane wave propagating perpendicular to the surface has decreased to
of the surface value.[Citation20] The penetration depths of all species of fish at selected frequency were calculated using the following equation:
where c is the speed of propagation of waves in a vacuum, which is 3 ×10⁸ (m s−1) and dp is the penetration depth (m).
Statistical analysis
All experimental data were represented as the mean or the mean ± standard error. Statistical analysis was performed using Microsoft office Excel 2016 and OriginPro 9.1. Analysis of variance (ANOVA) was conducted to determine the significance of the main effects using the LSD procedure to compare treatment means (p < 0.05).
Results and discussion
Composition analysis
The composition, pH, and water activity of the four species of fish are shown in . Hairtail had the highest water content, which was 79.16%, and Pomfret had the highest fat content, which was 12.02%. No significant difference in ash and protein content was found among the fish species. The pH and water activity values also did not vary significantly among fish species.
Table 1. Basic composition, pH, and water activity of four species of fish
Effect of compositions on dielectric properties
shows the dielectric constants and loss factors of the four species of fishes at 20°C. There was no significant difference in the dielectric properties between the two species of freshwater fish, but the dielectric constants of freshwater fish were slightly higher than that of the selected saltwater fish, while the dielectric loss factors were slightly lower. The dielectric loss factor of the Hairtail was slightly greater than the other three species of fish, which was possibly due to the higher ion concentration in the Hairtail than the other three species.[Citation21] The main component of ash is inorganic substances, mainly inorganic salts and oxides. Chen et al. used direct inductively coupled plasma atomic emission spectrometry to determine trace elements in the muscle tissue of Hairtail and found a high ion content.[Citation22] Pomfret had the lowest dielectric constant through the whole frequency scanning range. This was due to its high-fat content, which usually resulted in a low dielectric constant (<10).[Citation23] Similar results were reported for different beef meat blends over the temperature range of −18 to +10°C and higher fat content meat blends resulted in low dielectric properties.[Citation24] Many research papers state that fat is generally regarded as being inert in RF and MW fields as lipids are nonpolar in nature and therefore have a low ability to interact with polarizing electromagnetic fields, resulting in low dielectric properties.[Citation25,Citation26] A negative linear correlation has been widely reported between crude fat content and moisture content in fish.[Citation27] Ryynänen[Citation19] reported that an increase in fat content generally corresponded to a reduction in water content, which in turn reduced the dielectric interactions.
Figure 1. Dielectric properties for four species of fish at frequency range of 1–2500 MHz at 20°C
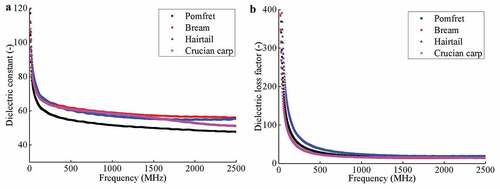
Quantifying the contribution of protein constituents to the overall absorption of the system reveals that each protein molecule absorbs an average 3.5–10% that of free water molecules.[Citation28,Citation29] Alshami et al.[Citation30] found that the dielectric constant of individual proteins on an average of 2.7 in a static field by theoretical calculations. Increasing protein concentration results in an increase in the dielectric loss especially at lower frequencies (<300 MHz). The effect of protein denaturation on the dielectric properties was also investigated in the literature indicating that only moisture loss, which was caused by protein denaturation in fish flesh during heating, affects the dielectric properties. Changes in the protein structure during protein denaturation have no direct effect on dielectric properties, indicating that moisture content was the most influential factor on the dielectric properties of fish flesh.[Citation13]
Literature shows that the ash content has no significant effect on the dielectric constant of meat, but the dielectric loss factor increases with the increase of ash content.[Citation31] However, the dielectric loss factor of the Hairtail was higher than other fishes, which shows that the effect of moisture content and ionic conductivity on the dielectric loss factor is greater than that of the ash content.
Effect of frequency on dielectric properties
The dielectric constant and loss factor of the four species of fish followed the same decreasing trend with increasing frequency as shown in & . The decreasing trend is sharp at frequencies <200 MHz then becomes slower as the frequency increases.
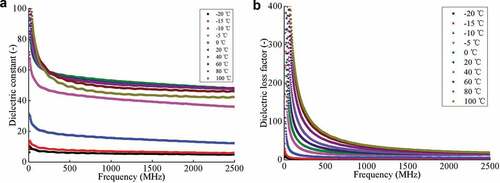
Taking Pomfret as an example, the dielectric properties of Pomfret at different temperatures are plotted as a function of frequency in . It can be seen that over the scanned frequency range, the dielectric constant and loss factor both decreased but at different rates as the increasing frequency . The higher the temperature, the higher the initial values of dielectric constant and loss factor for the fish, thus the faster the dielectric properties drop as the frequency increasesed. Similar reports have been reported in the literature.[Citation32]
Figure 2. Dielectric properties of Pomfret at frequency 1–2500 MHz and temperature −20–100°C
Polynomial fitting equations for the dielectric constant and dielectric loss factor of the four species of fish vary with frequency in the range of 1–2500 MHz at 20°C (). The R2 values in the regression formula are all greater than 0.94; thus, the polynomial equation can be used to predict the dielectric properties of the four fish within the frequency range of 1–2500 MHz.
Table 2. Prediction equations for dielectric properties for four species of fish at 20°C as a function of frequency (f, Hz)
Effect of temperature on dielectric properties
Temperature influence on dielectric constant
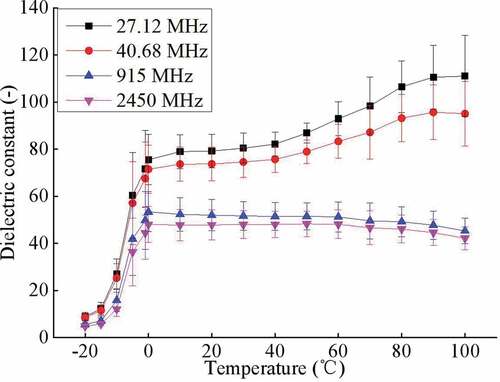
The dielectric constants of the four fishes at RF (27.12 and 40.68 MHz) and microwave frequency (915 and 2450 MHz) are plotted within the temperature range −20°C to 100°C in . The dielectric constants of the four species of fish at different frequencies had the same trend with temperature. In the RF band, a positive correlation is shown between the moisture content and the dielectric constant: Hairtail > Bream > Crucian Carp > Pomfret. However, no significant differences in dielectric constants were found at microwave frequencies for all the fish. At a fixed frequency, the dielectric constants of the four species of fish increased with increasing temperature. At low frequencies (27.12 and 40.68 MHz), the dielectric constant increased rapidly at −20°C–0°C and then increases slightly from 0°C to 100°C. However, at high frequencies (915 and 2450 MHz), the dielectric constant increased rapidly from −20°C to 0°C, and gradually decreases from 0°C to 100°C. Taking Pomfret as an example, the dielectric constant of the Pomfret at different frequencies was plotted as a function of temperature as shown in . The dielectric constants of Pomfret at 27.12 and 40.68 MHz were higher than those at 915 and 2450 MHz. The dielectric constant of Pomfret at 27.12 and 40.68 MHz increased with increasing temperature, however, at 915 and 2450 MHz, the dielectric constants decreased as the temperature increased. All the species of fish showed the same trend. This is because most of the free water is in the frozen state and dipole rotation is restricted over the temperature range −20 to 5°C, resulting in a low dielectric constant. Over the temperature range of −5°C to 0°C, ice crystals starts to convert to free water and the dielectric constant increases rapidly. Above 0°C, the decrease of dielectric constant at microwave frequencies was possibly caused by the interruption to the ordered water molecule arrangement because of increased intermolecular vibration at elevated temperatures. The trend for the dielectric constants to change with the temperature at different temperatures is due to the spectrum of relaxxation time of free water molecules shifts to higher frequencies as the temperature increases.[Citation34] Similar trends have been reported for other food products with high moisture content.[Citation33–Citation35] Basaran et al.[Citation36] reported that as the temperature increased from 20°C to 120°C, the dielectric constant was positively correlated with the temperature at low frequencies (27.12 and 40.68 MHz), and the dielectric constant was negatively correlated with the temperature at high frequencies (433, 915, and 1800 MHz). The dielectric constant values of the four species of fish were consistent with the literature results of Shrimp,[Citation32] Salmon,[Citation14,Citation36] Rainbow Trout,[Citation36] and Oysters.[Citation37]
Figure 3. Dielectric constant of four species of fish within the temperature range of −20–100°C at 27.12, 40.68, 915, and 2450 MHz, specifically (n=3)
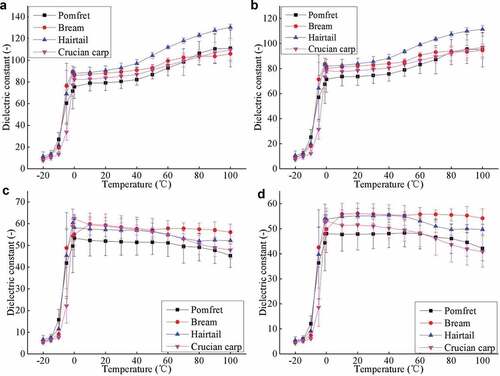
Figure 4. Frequency influence on the dielectric constant of Pomfret at −20°C–100°C (n=3)
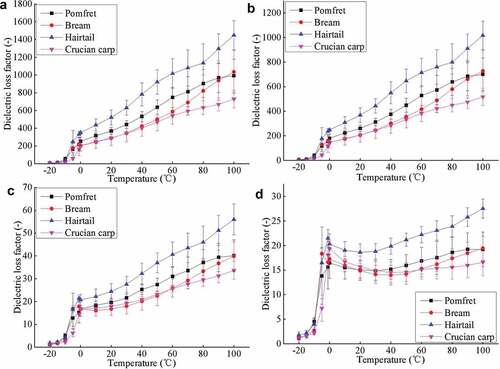
Temperature influence on dielectric loss factor
The variation in dielectric loss factors for the four species of fish as a function of temperature at the frequencies of 27.12, 40.68, 915, and 2450 MHz is shown in . The dielectric loss factors of the four species of fish at all the selected frequencies follow the same trend as the temperature increases. It can be seen that at the frequencies of 27.12, 40.68, and 915 MHz, the dielectric loss factor of the four species of fish increases with the increase in temperature. However, at 2450 MHz, the dielectric loss factor increases with increasing temperature from −20°C to 0°C, then decreases slightly with increasing temperature from 0°C to 40°C, and finally increases again from 40°C to 100°C. From and , the difference in dielectric loss factors of the four species of fish at different frequencies and temperatures indicates that the effect of moisture content on the dielectric loss factor was not as significant as the effect on the dielectric constant. The changes in the dielectric loss factor of the four species of fish have the same trend as for Shrimp,[Citation32] Salmon,[Citation14,Citation38] and Oysters[Citation37] at frequencies of 27.12, 40.68, 915, and 2450 MHz. The different trends in the dielectric loss factor versus temperature at different frequencies are due to the fact that the of relaxxation time of free water molecules as the temperature increases.[Citation16]
Figure 5. Dielectric loss factor of four species of fish within the temperature range of −20°C–100°C at 27.12, 40.68, 915, and 2450 MHz, specifically (n=3)
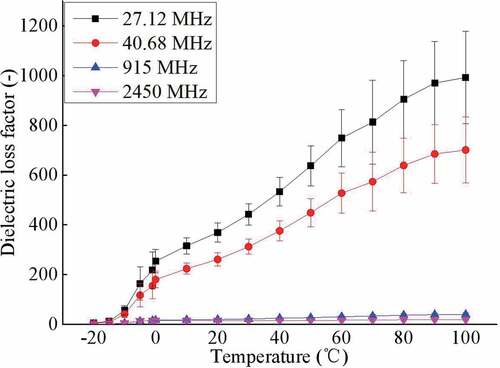
Taking Pomfret as an example, the dielectric loss factors of the Pomfret at selected frequencies were plotted as a function of temperature in . It can be seen that the dielectric loss factors of Pomfret at low frequencies (27.12 and 40.68 MHz) were significantly higher than that at the high frequencies (915 and 2450 MHz). As the temperature increases from −20°C to 100°C, the differences in the dielectric loss factor of Pomfret at the four frequencies were 986.26, 696.04, 35.33, and 18.03, respectively. The dielectric loss factor at 2450 MHz barely increases with temperature increment. These results indicate that temperature increase may cause a significant thermal-runaway phenomenon in the low-frequency range of dielectric heating.
Figure 6. Frequency influence on the dielectric loss factor of Pomfret at −20°C–100°C (n=3)
Regression analysis was performed for the dielectric properties with temperature variation for the four species of fish at four common RF and microwave frequencies (27.12, 40.68, 915, and 2450 MHz) between 0°C and 100°C, and the corresponding polynomial fitting equations are reported in . The R2 values in the regression equations are all greater than 0.97 and it can be seen that the polynomial equation fits with high precision and can, therefore, be used to predict the dielectric properties of the four fish within the temperature range of 0–100°C.
Table 3. Prediction equations for dielectric properties for four species of fish as a function of temperature (T, °C)
Effect of ionic conductivity on loss factor
The measured dielectric loss factor values of the four species of fish at 27.12 and 40.68 MHz were converted to electrical conductivity using the equation[Citation21]:
The calculated electrical conductivities from the dielectric loss factors were compared with the measured electrical conductivities of all the fish samples at 27.12 and 40.68 MHz, and is shown in . It can be seen that at 27.12 and 40.68 MHz, the calculated electric conductivity values are very close to the values measured by the conductivity meter, which validates the theory that the contribution to dielectric loss at Radio Frequencies (<100 MHz) is predominantly ionic conduction.
Figure 7. Electric conductivity values (from experiment and calculated) for four fishes of different species (n=3)
Ionic conduction plays an important role in contributing to the dielectric loss in the RF band (<300 MHz). In this frequency range, the ionic conduction dominates the dielectric loss factor values.[Citation16] From EquationEqs. (1)(1)
(1) –(Equation3
(3)
(3) ), the logarithm of the frequency and that of the dielectric loss factor are in a linear relationship with a negative slope. Thus, as the frequency increases, the dielectric loss factors decrease linearly. At microwave frequencies (>300 MHz), the dipole rotation effect becomes the main contributor to the dielectric loss factor, which results in a decrease of the dielectric loss factor. This decreasing trend stops until the free water dipole rotation effect is significant at higher frequencies (>1 GHz). It has been reported that many high moisture foods have a negative linear relationship between the logarithmic of the dielectric loss factor and the frequency, e.g. salmon fillets.[Citation14]
Penetration depth
The penetration depth () for each of the fish species was calculated by substituting the measured dielectric constant and dielectric loss factor into EquationEq. (3)
(3)
(3) . shows the
for the four species of fish at the selected four frequencies (27.12, 40.68, 915, and 2450 MHz) and temperatures (−20°C to 100°C). It can be seen from that as the temperature increases, the
for the four species of fish decreased at the frequencies of 27.12, 40.68, and 915 MHz. The lower the frequency, the greater was the reduction. Frozen foods normally offer a much larger penetration depth at low frequencies due to their low dielectric constants and loss factors. The
at 2450 MHz increased first and then decreased, which is due to the dipole rotation of the molecules contributing to the increase of dielectric loss factor. The
of the four species of fish can be ranked from high to low as: Bream ≈ Crucian Carp > Pomfret > Hairtail. At the same temperatures, the
s at the frequencies of 27.12 and 40.68 MHz are much higher than that at 915 and 2450 MHz. For example, at 0°C, the
of the Pomfret drops from 9.05 to 0.83 cm when the frequency increases from 27.12 to 2450 MHz.
Table 4. Penetration depth for four species of fish at frequencies between 1 and 2500 MHz and temperatures between −20°C and 100°C
At a fixed frequency, the dielectric loss factor is inversely proportional to the penetration depth. It can be seen from and that when the temperature is raised from −1°C to 100°C, the dielectric loss factor increases sharply at the frequencies of 27.12, 40.68, and 915 MHz. The dielectric constant rise was rare and the absolute value is much lower than the dielectric loss factor; thus, the penetration depth decreases. At the frequency of 2450 MHz, the dielectric constant was greater than the value of the dielectric loss factor. In this case, , so the penetration depth firstly rises and then decreases. Therefore, the penetration depth at lower frequencies is usually much larger than that at higher frequencies. The less the penetration depth, the more obvious the skin effect in the heating process of the material, the heating uniformity of the sample also decreases accordingly.
Conclusion
The dielectric properties of the two species of saltwater fish (Pomfret and Hairtail) and two species of freshwater fish (Bream and Crucian Carp) were determined at frequencies 1–2500 MHz and temperatures from −20°C to 100°C. The composition of the fish was found to vary among species, which results in the dielectric properties and penetration depth differences. The results suggest that the dielectric heating processes for various fish subjected to dielectric heating could be considerably different. Among all the components, the fat and moisture contents of the fish are the two most influential factors on the dielectric properties and penetration depths. Therefore, we conclude that dielectric heating processes should be developed specifically for each different fish species according to their composition. This study provides a basis for selecting suitable optimum frequencies for different fish for dielectric heating purposes. It also provides data for computer modeling of microwave and radio frequency tempering and sterilization processes for different species of fish.
Furthermore, the dielectric property data of the four species of fish studied were found to change with frequency and temperature. This could also have the potential for the development of a detection system to enable the determination of the fish species. For example, the dielectric property differences between the four species of fish at Radio Frequencies (e.g. 27.12 MHz) are more obvious than that at microwave frequencies (915 and 2450 MHz), which indicates that the radio frequency band is more suitable for species detection of fishery products. The results in this study could be potentially used to develop fast detection methods and devices to distinguish fish species through dielectric properties measurement at frequencies <100 MHz.
Acknowledgments
The author acknowledges China National Science Foundation (31801613, 31571866), China Postdoctoral Science Foundation (2018M632299), Shanghai Pujiang Program (16PJ1404100), and Professor of Special Appointment (Youth Eastern Scholar) at Shanghai Institutions of Higher Learning (No. QD2016055) for their financial support to this research. The authors have no conflict of interest to declare.
Additional information
Funding
References
- Llave, Y.; Terada, Y.; Fukuoka, M.; Sakai, N. Dielectric Properties of Frozen Tuna and Analysis of Defrosting Using a Radio-frequency System at Low Frequencies. J. Food Eng. 2014, 139, 1–9. DOI: 10.1016/j.jfoodeng.2014.04.012.
- Yang, H.; Chen, Q.; Cao, H.; Fan, D.; Huang, J.; Zhao, J.; Yan, B.; Zhou, W.; Zhang, W.; Zhang, H. Radiofrequency Thawing of Frozen Minced Fish Based on the Dielectric Response Mechanism. Innovative Food Sci. Emerg. Technol. 2019, 52, 80–88. DOI: 10.1016/j.ifset.2018.10.013.
- Laycock, L.; Piyasena, P.; Mittal, G. S. Radio Frequency Cooking of Ground, Comminuted and Muscle Meat Products. Meat Sci. 2003, 65(3), 959–965. DOI: 10.1016/S0309-1740(02)00311-X.
- Al-Holy, M.; Wang, Y.; Tang, J.; Rasco, B. Dielectric Properties of Salmon (Oncorhynchus keta) and Sturgeon (Acipenser transmontanus) Caviar at Radio Frequency (RF) and Microwave (MW) Pasteurization Frequencies. J. Food Eng. 2005, 70(4), 564–570.
- Bledsoe, G. E.; Rasco, B. Caviars and Fish Roe Products. Crit. Rev. Food Sci. Nutr. 2003, 43(3), 317–356. DOI: 10.1080/10408690390826545.
- Uemura, K.; Kanafusa, S.; Takahashi, C.; Kobayashi, I. Development of a Radio Frequency Heating System for Sterilization of Vacuum-packed Fish in Water. Biosci. Biotechnol. Biochem. 2017, 81(4), 762–767.
- Fiore, A.; Di Monaco, R.; Cavella, S.; Visconti, A.; Karneili, O.; Bernhardt, S.; Fogliano, V. Chemical Profile and Sensory Properties of Different Foods Cooked by a New Radio Frequency Oven. Food Chem. 2013, 139(1–4), 515–520.
- Stephen, N. M.; Jeya Shakila, R.; Jeyasekaran, G.; Sukumar, D. Effect of Different Types of Heat Processing on Chemical Changes in Tuna. J. Food Sci. Technol. 2010, 47(2), 174–181.
- Ross. The Chemical Biology of Fishes: Vol. 2: Advances 1968–1977. J. Fish Dis. 1982, 5(2), 171–171.
- Lyndon, A. R. Fish Growth in Marine Culture Systems a Challenge. Mar. Biotechnol. 1999, 1, 376–379. DOI: 10.1007/PL00011790.
- Shearer, K. Factors Affecting the Proximate Composition of Cultured Fishes with Emphasis on Salmonids. Aquaculture. 1994, 119, 63–88. DOI: 10.1016/0044-8486(94)90444-8.
- Yang, L.; Qiu, W.; Yin, Y.; Kyung, H. R.; Cheng, Y.; Jin, Y. Dielectric Properties of Antarctic Krill (Euphausia superba) and White Shrimp (Penaeus vannamei) during Microwave Thawing and Heating. J. Microwave Power EE. 2017, 51(1), 3–30.
- Liu, S.; Mika, F.; Noboru, S. Dielectric Properties of Fish Flesh at Microwave Frequency. Food Sci. Technol. Res. 2012, 18(2), 157–166. DOI: 10.3136/fstr.18.157.
- Wang, Y.; Tang, J.; Rasco, B.; Kong, F.; Wang, S. Dielectric Properties of Salmon Fillets as a Function of Temperature and Composition. J. Food Eng. 2008, 87(2), 236–246.
- Wang, Y.; Monzon, M.; Gazit, Y.; Tang, J.; J. Mitcham, E.; W. Armstrong, J. Temperature-dependent Dielectric Properties of Selected Subtropical and Tropical Fruits and Associated Insect Pests. Trans. ASABE. 2005, 48(5), 1873–1881. DOI:10.13031/2013.19985.
- Wang, Y.; Timothy, D. W.; Tang, J.; Hallberg, L. M. Dielectric Properties of Foods Relevant to RF and Microwave Pasteurization and Sterilization. J. Food Eng. 2003, 57(3), 257–268.
- Marra, F.; Zhang, L.; Lyng, J. G. Radio Frequency Treatment of Foods: Review of Recent Advances. J. Food Eng. 2009, 91(4), 497–508. DOI: 10.1016/j.jfoodeng.2008.10.015.
- Chantrey, P. Industrial Microwave Heating. Electron Power. 1993, 9, 659.
- Ryynänen, S. The Electromagnetic Properties of Food Materials: A Review of the Basic Principles. J. Food Eng. 1995, 26(4), 409–429. DOI: 10.1016/0260-8774(94)00063-F.
- Bengtsson, N. E.; Risman, P. O. Dielectric Properties of Foods at 3 GHz as Determined by a Cavity Perturbation Technique. J. Microwave Power. 1971, 6(2), 107–123. DOI: 10.1080/00222739.1971.11688789.
- Piyasenaa, P.; Dussaulta, C.; Koutchmab, T.; Ramaswamy, H. S.; Awuah, G. B. Radio Frequency Heating of Foods: Principles, Applications and Related Properties—A Review. Crit. Rev. Food Sci. Nutr. 2003, 43(6), 587–606.
- Chen, S.; Lu, D.; Hu, Z. Direct Inductively Coupled Plasma-atomic Emission Spectrometry Analysis of Trace Elements in Muscle Tissues of Hairtail Using Electrothermal Vaporization with Slurry Sampling. J. AOAC Int. 2007, 90(1), 258–262.
- Calay, R. K.; Newborough, M.; Probert, D.; Calay, P. S. Predictive Equations for the Dielectric Properties of Foods. Int. J. Food Sci. Technol. 2007, 29, 699–713. DOI: 10.1111/(ISSN)1365-2621.
- Farag, K. W.; Lyng, J. G.; Morgan, D. J.; Cronin, D. A. A Comparison of Conventional and Radio Frequency Tempering of Beef Meats: Effects on Product Temperature Distribution. Meat Sci. 2008, 80(2), 488–495.
- Mudgett, R. E.; Goldblith, S. A.; Wang, D. I. C.; Westphal, W. B. Prediction of Dielectric Properties in Solid Foods of High Moisture Content at Ultrahigh and Microwave Frequencies. J. Food Process. Pres. 1977, 1(2), 119–151.
- Mudgett, R. E.; Goldblith, S. A.; Wang, D. I. C.; Westphal, W. B. Dielectric Properties of Frozen Meats. J. Microwave Power EE. 1979, 14(3), 209–216. DOI:10.1080/16070658.1979.11689153.
- Zhu, X.; Guo, W.; Liang, Z. Determination of the Fat Content in Cow’s Milk Based on Dielectric Properties. Food Bioprocess. Tech. 2015, 8, 1485–1494. DOI: 10.1007/s11947-015-1508-x.
- Schutz, C. N.; Warshel, A. What are the Dielectric “Constants” of Proteins and How to Validate Electrostatic Models? Proteins. 2001, 44(4), 400–417. DOI: 10.1002/prot.1106.
- South, G. P.; Grant, E. H. Theory of Dipolar Relaxation in Aqueous Macromolecular Solutions. Biopolymers. 1974, 13(9), 1777–1789. DOI: 10.1002/(ISSN)1097-0282.
- Alshami, A. S.; Tang, J.; Rasco, B. Contribution of Proteins to the Dielectric Properties of Dielectrically Heated Biomaterials. Food Bioprocess. Tech. 2017, 10, 1548–1561. DOI: 10.1007/s11947-017-1920-5.
- Sipahioglu, O.; Barringer, S. A.; Bircan, C. The Dielectric Properties of Meats as a Function of Temperature and Composition. J. Microwave Power EE. 2003, 38(3), 161–169.
- Tanaka, F.; Mallikarjunan, P.; Hung, Y. C. Dielectric Properties of Shrimp Related to Microwave Frequencies: Fromfrozen to Cooked Stages. J. Food Process Eng. 1999, 22(6), 455–468. DOI: 10.1111/j.1745-4530.1999.tb00499.x.
- Herve, A. G.; Tang, J.; Luedecke, L.; Feng, H. Dielectric Properties of Cottage Cheese and Surface Treatment Using Microwaves. J. Food Eng. 1998, 37(4), 389–410.
- Tang, J. Dielectric Properties of Foods. The Microwave Processing of Foods; Woodhead Publishing Limited: Cambridge, UK, 2005; pp 25–75.
- Guan, D.; Cheng, M.; Wang, Y.; Tang, J. Dielectric Properties of Mashed Potatoes Relevant to Microwave and Radio-frequency Pasteurization and Sterilization Processes. J. Food Sci. 2004, 69(1), 30–37.
- Basaran, P.; Basaran-Akgul, N.; Rasco, B. A. Dielectric Properties of Chicken and Fish Muscle Treated with Microbial Transglutaminase. Food Chem. 2010, 120(2), 361–370. DOI: 10.1016/j.foodchem.2009.09.050.
- Hu, X. P.; Mallikarjunan, P. Thermal and Dielectric Properties of Shucked Oysters. Lebensm-Wiss Technol. 2005, 38(5), 489–494. DOI: 10.1016/j.lwt.2004.07.016.
- Zheng, M.; Huang, Y. W.; Nelson, S. O.; Bartley, P. G.; GATES, K. W. Dielectric Properties and Thermal Conductivity of Marinated Shrimp and Channel Catfish. J. Food Sci. 1998, 63(4), 668–672.