
ABSTRACT
Cooking meat at different temperatures resulted in loss of fluids and alterations in its textures. This work signifies the effect of different cooking temperatures on the volumetric changes and biophysical properties of breast meat blocks obtained from broilers and yellow-feather chicken (YFC). Shrinkage in the length and volume of meat blocks of broilers were higher, whereas YFC showed an increase in cross-sectional area. At each cooking temperature (60°C, 70°C, 80°C, 90°C, and 100°C), mostly there were significant differences (p< .05) in volumetric changes found between the meat block of both breeds. Results from the biophysical properties indicated that the cooking of broilers meat below 80°C increases its hardness, the opposite was observed for YFC. Cooking at 100°C produced more hardness in YFC meat than broilers (34.15 N vs 26.80 N) (p< .05). Moreover, cooking at higher temperature produced early gel properties in broilers than YFC meat. SDS-PAGE results revealed a similar trend for both breeds except cooking at 100°C where broilers have more band intensities than YFC. LF-NMR (low-field nuclear magnetic resonance) and MRI (magnetic resonance imaging) data suggested that after cooking at each temperature YFC reserved more water than broilers. Physical meat quality traits have correlations with volumetric changes and cooking temperatures. Cooking of YFC meat at 90°C and 100°C has demonstrated similar correlation patterns with physical quality traits. Overall, cooking at 100°C caused more undesirable changes in YFC than broilers meat blocks. Therefore, it is suggested that cooking at 90°C could be a better temperature for YFC meat.
Introduction
In order to achieve the safety and quality of chicken meat, cooking is indispensable before consumption. These heat treatments can change the weight and volume of meat by the migration of fluids. This migration of fluids can change the appearance[1] and texture[Citation2] of meat. In addition, heat-induced variations in the yield of meat are major economic concerns of consumers and meat processors.
Heat-induced protein denaturation/solubilization influences the texture of the chicken meat which is manifested by straightening and shrinkage of the muscle fibers.[Citation2,Citation3] These shrinkages in volume are not uniform in all directions with the rise of temperature. Therefore, during heating toughening of chicken meat occurs because of the denser arrangement of microstructures.[Citation2,Citation4,Citation5] Furthermore, water-holding capacity (WHC) of the chicken breast meat was reduced because of the protein denaturation. As a result, toughening of meat occurs due to the flow of unbound water to the inter-fiber spaces, which ultimately reduces the WHC.[Citation3,Citation6] A number of reports exist in poultry meat textural changes with respect to temperature change.[Citation2,Citation7,Citation8] Another study has demonstrated the positive impact of heating on the meat tenderness and hardness because of changes in the hydrophobic proteins interactions and conformational changes.[Citation9] Heat treatments also lead to changes in the structural and functional properties of meat proteins.[Citation10,Citation11]
A rare comparative literature is available on the cooking-induced volumetric changes and water mobility in broilers and yellow-feathered chicken (YFC) breast meat. Therefore, the effect of different temperature treatments on the volumetric changes and their association with water mobility still needs to be explored along with a comparison of broilers and YFC breeds. Moreover, cooking of broilers and YFC at different temperatures provides insights into quality changes with consistent increase in temperature from 60°C to 100°C to estimate the losses in meat quality. YFC is a Chinese breed of chicken with distinctive aroma and firm meat.[Citation12,Citation13] This breed is raised for eggs and meat purposes and, therefore, preferred over fast-growing imported broiler line because of its higher palatability. Hence, the current study aimed to develop a comparative understanding on cooking-induced volumetric changes, water mobility and biophysical properties of breast meat blocks obtained from broilers and YFC.
Materials and methods
Samples
Broilers and YFC were reared and provided by the Taikun Company Limited, China. Birds were reared in two groups with ad libitum feed and water. Feed was provided according to the requirements of birds.[Citation14] Birds were slaughtered according to their age of maturity 40 d for broilers and 120 d for YFC. Twelve h of fasting before slaughtering was ensured. Electrical stunning was given to birds before exsanguinations. Slaughtering was done by neck cutting. Birds were scalded at 75°C for 3 min after 3 min of bleeding. Evisceration was performed after the treatment of drum picker for 40 s. Chilled (2°C) carcasses were aged 8 h at 4°C and subsequently frozen at −18°C for further analyses. Samples were randomly selected from a dorso-cranial portion of the pectoralis major muscle for analyses. The same anatomical position was used to collect all the samples from both breeds. All experiments were performed at the Institute of food Science and technology, Chinese academy of Agricultural Sciences, Beijing, China. The study was approved by animal welfare and the ethics committee. All chemicals and reagents were of analytical grades or otherwise stated.
Volumetric changes in meat cooked as blocks
Twelve blocks (approximately 40 × 20 × 20 mm) were excised from the breast muscles with their long axis parallel to the direction of the muscle fibers. Vernier caliper was used to measure the exact dimensions of muscles. Pins were inserted on the dorsal side of the muscles to distinguish the two axes. The individual blocks were placed in individual plastic bags and cooked all together in each of the five stirring water baths set as 60°C, 70°C, 80°C, 90°C, and 100°C for 40 min. After heating all the samples were shifted to ice-bath for cooling for 15 min. The samples were wiped cleaned, the shrinkage in length, cross sectional area (CSA) and volume were calculated.[Citation15]
Low-field nuclear magnetic resonance (LF-NMR)
LF-NMR relaxation experiment was performed to observe the water distribution in the cooked meat samples by following the method of.[Citation16] Briefly, samples weighing approximately 35 g (n = 3) were put in cylindrical plastic tubes and then subjected to NMR probe for analysis by using LF-NMR Analyzer (PQ-001, Niumag Electric Corporation, Shanghai, China). The instrument was adjusted as follows; 0.5 Tesla = magnetic field, spectrometer frequency = 23 MHz, probe coil diameter = 60 mm and the operating temperature was 32°C. The T2 (transverse relaxation) values were measured by using the Carr–Purcell–Meiboom–Gill sequence (CPMG). Artifacts were removed by phase cycling. Twenty μs was the time difference between 180° and 90° pulse, represented by τ-values. 3000 ms was used as an interval time between two consecutive scans. For each sample, three independent scans repetitions were conducted. MultiExpInv Analysis software (Niumag Electric Corporation, Shanghai, China) was used to express the data. Three relaxation (T2) values of water populations: the bound water (T21), immobilized water (T22) and free water (T23) were acquired. The cumulative integration system was applied to obtain three different water states in the cooked chicken samples.[Citation17]
pH, color, expressible moisture, and cooking loss of chicken meat
Cooked samples (n = 3) pH was determined using 10 g of meat sample from all groups, followed by homogenization with 100 mL 0.1 M KCl for 1 min at 16000 r/min with an IKA Ultra Turrax T25 homogenizer (Labortechnik, Staufen, Germany). A LeiciPHS-3C pH meter (Shanghai Instrument Electric Scientific Instrument Co., Ltd., Shanghai, China) was applied to determine the pH of muscle mixture.
Color measurements were carried out for cooked breast samples (n = 3) of broilers and YFB by using a Chroma Meter CR-400 colorimeter (Minolta, Osaka, Japan). CIE color system was used for L* (lightness), a* (redness) and b* (yellowness). Illuminant D65, measuring aperture (diameter) 8 mm and (2°) as standard observer were adjusted. Cooked samples were kept for 2 h at room temperature before the data were recorded.
The expressible moisture (EM) content of cooked samples (n = 12) at different temperatures was measured by the platform of steel ring expansion compressor (Nanjing Soil Instrument Factory Co., Ltd., Nanjing, China). Five grams of muscles in the direction of muscle fibers were excised, weighed and wrapped in the pre-weighed Whatman No. 1 filter paper and then put between two plates. After that plates were fixed in the Texture Analyzer with adhesive test mode with a load of 5000 g was applied for 2 min. The filter papers were weighted after removing the samples. The EM was calculated in percentage by the following method.[Citation18]Cooking loss is the measure of fluid loss and soluble exudates from meat during cooking at 60°C, 70°C, 80°C, 90°C, and 100°C for 40 min. It was calculated from the breast meat samples (n = 12) of both breeds by following method.[Citation19]
Instrumental texture profile analysis
Texture analyses were performed on the cooked (at 60°C, 70°C, 80°C, 90°C, and 100°C) samples (n = 6) of breast meat of broilers and YFB by using a Texture profile analyzer (Stable Micro system Texture analyzer HD, England). TPA (texture profile analyzer) adjustments were employed with a 2 in diameter TA25 aluminum probe. Cooked samples (15 mm Height × 25 mm diameter) were cut with a saw and mitter box at room temperature. Cooked samples (n = 6) were excised longitudinally oriented with muscle fibers from the center of each block. Before analyzing samples were equilibrated at 25°C for 3 h. Each sample was fixed between steel plates and then the compression test was carried out twice. The samples aligned perpendicularly to the muscle fiber direction were compressed half (50%) of the sample height with a trigger force of 5 g with the speed of 5 mm/s. Upon completion of the test following indicators were recorded: hardness (N), cohesiveness, springiness (%), gumminess (N), chewiness (N/mm) and resilience (%) from a TPA exponent software attached with the analyzer.[Citation10]
Rheological characteristics
The rheological properties (n = 3) were measured in a nondestructive manner on a rheometer (Physica MRC 301, Anton Paar, Austria). The meat samples were cooked at 60°C, 70°C, 80°C, 90°C, and 100°C and myofibril protein (MP) suspension was prepared by following the method of[Citation20] with some modifications. Two mL of MP suspension (80mg/ml in 10mM PIPES buffer with 0.6 mol/L NaCl pH 6.0) was put between the gap of 1 mm of two parallel plates with 40 mm diameter. The outcomes were demonstrated in the form of G′ (storage modulus) and G′′ (loss modulus). The oscillatory mode was applied on the samples with a maximum strain of 0.5% and a frequency of 0.1 Hz. The G′ (storage modulus) and G′′ (loss modulus) were measured to investigate the rheological properties of the samples.
SDS-PAGE
The MP samples of cooked meat were investigated using a Sodium Dodecyl Sulfate-Polyacrylamide Gel Electrophoresis (SDS-PAGE) with 10% polyacrylamide gels by the method described by[Citation21] with some modifications. The MP suspension was diluted with phosphate buffer to 2 mg/mL protein concentration in each sample. Samples were mixed with the equal amount of buffer containing 0.5% bromophenol blue in 62.5 mmol/LTris-HCl buffer, pH 6.8, 2% SDS, 1 mol/L β-mercaptoethanol and 20% glycerol and heated for 3–5 min in boiling water bath. The SDS-PAGE was carried out by loading 10 μL from each group. 0.1% Coomassie brilliant blue R-250 with 10% acetic acid and 50% methanol was used to stain the gels overnight, then destaining was performed in 7.5% acetic acid and 5% methanol. The photographs of gels were taken by ChemiDOC (GT-800F, Epson, Japan).
Proton density images
Cooked samples (at 60°C, 70°C, 80°C, 90°C, and 100°C) were subjected to scanning by a MINI MR-60 device (Niumag Electric Corporation, Shanghai, China) with the frequency of 23.292 MHz at 32°C to acquire the proton density images. The MSE image sequence was operated and the instrument measurements were set as follows: the TR (repetition time) was 500 ms, the viewing field was 50 × 50 mm2, the TE (echo time) was 18.2 ms. Observations were conducted by slicing the samples into four layers, the slice gape was 2 mm and the width of each layer was 3 mm. The sum of eight scans was used to acquire each image. Image processing software (Shanghai Niumag Corporation) was used to obtain images.
Scanning electron microscopy (SEM)
Cooked samples of (at 60°C, 70°C, 80°C, 90°C, and 100°C) breast meat of broilers and YFB were processed by the protocol described by.[Citation22] Briefly stating, samples from each treatment were excised (3 mm × 3 mm × 5 mm) and subjected to fixation with 3% glutaraldehyde for 3 h at 4°C. The specimens washed with distilled water for 1 h and then dehydrated in ethanol with serial concentration. A bronze stub and sputter-coated with gold (EikoIB-5, Hitachi,Tokyo, Japan) was used for mounting of the dried sections. Observations of muscle fibers cross sections were carried out using a scanning electron microscope (Quanta 200FEG, FEI, Netherlands) at a magnification of × 120.
Statistical analysis
The independent sample t-test was used to differentiate the breeds at each cooking temperature whereas Tukey’s multiple comparison test was used to evaluate the significance (p< .05) of meat quality traits at different cooking temperatures for same breed at 95% confidence interval by SPSS Statistics 16.0. The correlation among meat biophysical characteristics, cooking temperatures, and volumetric changes was calculated by XLSTAT (2016) from Addinsoft (Barcelona, Spain). The correlation plot among meat physical quality traits was developed by RStudio.[Citation23]
Results and discussion
Volumetric changes
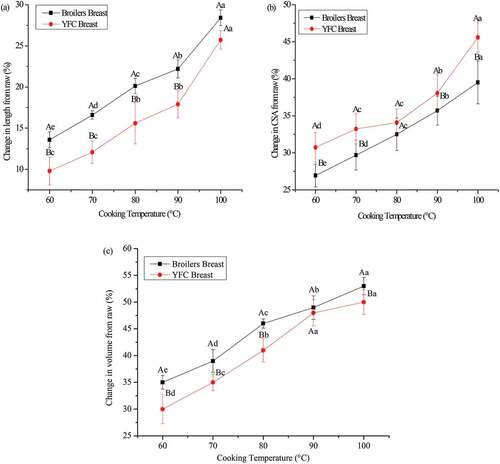
The volumetric changes in the breast muscle blocks of broilers and YFC cooked at 60°C, 70°C, 80°C, 90°C, and 100°C are summarized in . The variations in volume, length, and CSA of cooked samples from raw meat were evident in both breeds. Increasing cooking temperature corresponds to change in length, CSA and volume of muscle blocks of both breeds. Broilers muscles showed greater changes in length and volume except CSA, that was higher in the YFC. Cooking at 60°C, 70°C, 80°C, and 90°C induced significant shrinkage (p< .05) in length of meat blocks of boilers and YFC except at 100°C which caused maximum changes in length among all the cooking temperatures in both breeds (). Moreover, the shrinkage in length of broilers and YFC meat blocks demonstrated consistency in change over changing cooking temperature. At each cooking temperature (60°C, 70°C, 80°C, 90°C, and 100°C) the CSA of meat blocks was significantly higher (p< .05) in YFC than broilers (). In YFC cooking at different temperatures showed a significant effect (p< .05) on the CSA of meat blocks except cooking at 70°C and 80°C (p> .05). However, each cooking temperature (60°C, 70°C, 80°C, 90°C, and 100°C) has induced significant changes in CSA of meat blocks in broilers (p< .05). Change in volume of meat blocks was significantly higher (p< .05) in the broilers than YFC at each cooking temperature except cooking at 90°C (). In broilers each cooking temperature has induced the significant changes (p< .05) in the meat blocks. The similar trend was noticed in YFC at each cooking temperature except cooking at 90°C and 100°C (p> .05). Taken together, cooking above 90°C causes the shrinkage of muscle fibers and collagen, which could be the potential driving force for the volumetric changes in the meat blocks. This phenomenon was more pronounced in broilers than YFC due to slaughter age difference and genetic predisposition. Moreover, the role of connective tissue present in the muscles plays a minor role in contraction upon heating. These results are consistent with the previously published literature in beef where high pH and cooking temperatures reduce the transverse shrinkage of muscle blocks.[Citation24] This result is consistent with the cooking loss data. Higher cooking temperatures lead to shrinkage in musclefibers which continues until 100°C. The higher cooking temperature leads to more loss in volume and denaturation of proteins. These volumetric changes might also be the result of collagen shrinkage occurs in early temperatures resulting in a contraction in the direction of lateral and longitudinal direction of the fibers. The variability in the volumetric changes of these two chicken breeds can lead to micro structures re-organization. Tight networks might be produced because of physicochemical interactions.[Citation25] Our results suggest that with the increase in cooking temperature transverse shrinkage in the meat blocks were more pronounced than longitudinal shrinkage. Cooking-induced shrinkage in the individual extracted myofibers warrants further studies.
Figure 1. Effect of different cooking temperatures for 40 min on the volumetric changes, length (a), CSA (b) and volume (c) of breast meat blocks of broilers and YFC. Different capital letters (A, B) of the means at the same cooking temperature and different lowercase letters (a-e) at different temperatures are statistically different (p < .05). CSA: Cross-sectional area; YFC: yellow-feathered chicken
LF-NMR
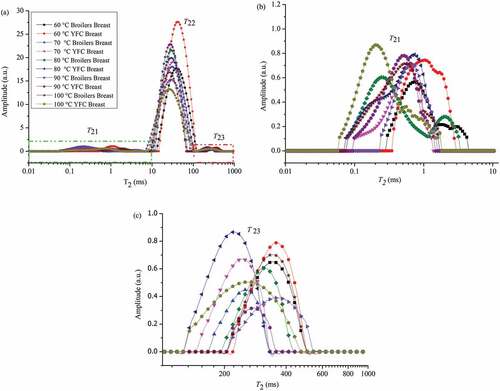
Samples subjected to different temperature treatments their relaxation time and intensities were investigated by LF-NMR (). The different water phases were designated in three peaks. CPMG relaxation curves were used to elaborate the T21, its relaxation time ranges from 0.1 to 10 ms (), T23 relaxation time range 100–1000 ms (). The most abundant water populations (proton pool) ascribed as T22, which ranges from 10 to 100 ms. Myofibrillar network contained this immobilized water. The breast samples obtained from broilers and YFC cooked at 60°C, 70°C, 80°C, 90°C, and 100°C have different relaxation times curve, which demonstrates their ability to retain water. Breast meat of broilers and YFC cooked at 60°C, the YFC demonstrated profound increment in T22 relaxation time peak as compared to broilers. After cooking at different temperatures the T22 peaks are mostly higher in YFC as compared to broilers. Bound water (T21) depicted the lower peaks in broilers as compared to YFC. A similar trend was observed in free water (T23) as the cooking temperature increases the free water content in the samples decreases. Increasing cooking temperature reduces the relaxation time curve generally. This result is consistent with cooking loss and proton density images findings wherein more cooking loss is observed in broilers as compared to YFC. These migration curves are the result of cooking-induced proteolysis. In the current study, less proteolysis was observed in the YFC except at the highest cooking temperature (100°C). Denaturation of protein has inverse relation with WHC.[Citation25] As in the SEM results, YFC muscles seems more swollen that might be the reason for their higher water retention capacity. These results are consistent with previously reported data.[Citation19] Some authors have proposed in the cooking process pockets are formed which might store water.[Citation6] The phenomenon seems more pronounced in YFC as compared to broilers.
Figure 2. (a) T2 relaxation time distribution curves of chicken breast meat obtained from broilers and YFC subjected to different temperature treatments for 40 min (T21, bound water; T22, immobilized water; T23, free water), (b) Enlarged plot of T21 peak in (a) (green dash-dot rectangle), (c) Enlarged plot of T23 peak in (a) (red dash-dot-dot rectangle). YFC: Yellow-feather chicken
Cooking loss
Comparison of cooking loss of the breast samples obtained from broilers and YFC subjected to different cooking temperatures are presented in the . Higher cooking loss leads to poor eating qualities of meat.[Citation26] Cooking loss in broilers meat at 60, 70, 80°C was significantly different (p < .05) whereas in YFC each cooking temperature was significantly different from others (p < .05). Our results of cooking losses are in agreement with the previous literature which suggested that cooking losses may vary from 20% to 40%.[Citation26]The highest cooking loss was recorded in the broilers muscles as compared to YFC (p< .05). Broiler breast meat has got a lower tendency to hold water during the cooking process. Cooking loss data is also in line with the LF-NMR results and proton density images results.
Table 1. Effect of different cooking temperatures on the cooking loss % of breast meat of broilers and YFC Different capital letters (A, B) in columns and different lowercase letters (a-e) in the rows of the means ± SD are statistically different (p< .05). YFC: Yellow-feathered chicken
pH, color and EM % analyses
Different cooking temperatures affected the pH, expressible moisture (EM) and color of breast muscles obtained from broilers and YFC (). In broilers meat, the pH was significantly higher (p< .05) at each cooking temperature (60°C, 70°C, 80°C, 90°C, and 100°C) than YFC. This might be because of breed difference. This result is in the agreement was the previous literature who found the cooking is responsible for the increment in pH values of meat.[Citation27] The L* values were relatively higher in broilers than YFC meat. This is because of naturally more white color of broilers meat. This finding is consistent with the published literature which documented that cooking causes significant changes in broiler meat color.[1] The a* values were relatively higher in YFC meat than broilers. There were no significant differences were observed in b* values (p > .05) except cooking at 60°C and 70°C where broilers meat has higher b* values (p< .05). These color variations can be better explained by breed differences and their natural colors before cooking. EM is defined as a forcefully release of water from meat; it was mostly higher in broilers than YFC at different cooking temperatures (). It is also a good indicator of WHC of meat. Water remained more tightly bound with YFC meat than broilers. It is reported elsewhere that cooking at higher temperatures leads to formations of gels and aggregation of proteins, which could possibly retain the water effectively.[Citation28] This phenomenon was more pronounced in YFC meat as compared to broilers. Proton density images results support these findings.
Table 2. Effect of different cooking temperatures on the pH, expressible moisture and color of breast meat of broilers and YFC
Instrumental TPA
Textural properties of the cooked (at 60°C, 70°C, 80°C, 90°C, and 100°C) breast meat obtained from the broilers and YFC were analyzed by using 6 instrumental techniques (hardness, resilience, cohesion, springiness, gumminess, and chewiness) are presented in . These texture characteristics are related with shrinkage of meat blocks, resulted from the denaturation and aggregation of myofibril proteins along with alterations in the connective tissues.[Citation29]Broilers breast meat cooking at 60°C was harder than YFC (56.71 vs 31.62 N) and less springiness (57.05 vs 60.44%) respectively (p< .05). YFC has more firm and compacted meat with a higher fat percentage. Cooking at 70°C resulted in higher gumminess values in YFC than broilers (p> .05). Hardness, springiness, gumminess, and chewiness were significantly different (p< .05) in samples from both breeds when cooked at 80°C and 90°C. However, higher resilience was observed in broilers samples than YFC at 90°C cooking (p< .05). These results indicated maximum changes have been observed between 90°C and 100°C cooking. Moreover, these findings indicated that in both breeds cooking at different temperatures had no effect on cohesion (cohesiveness). Thus, from the results herein speculated that in YFC cooking at higher temperatures resulted in more hardness and lower gumminess and chewiness, which are normally undesirable traits. The connective tissues of YFC were harder and mature than broilers. Interestingly, cooking after 80°C has dramatically lowered the hardness in broilers meat. The results are in agreement with the[Citation26] who found that loss of water during cooking is ascribed as an outcome of the protein thermal denaturation which causes the change in meat texture. This result is also in agreement with the SDS-PAGE.
Table 3. Effect of different cooking temperatures on the texture profile of breast meat of broilers and YFC
SDS-PAGE
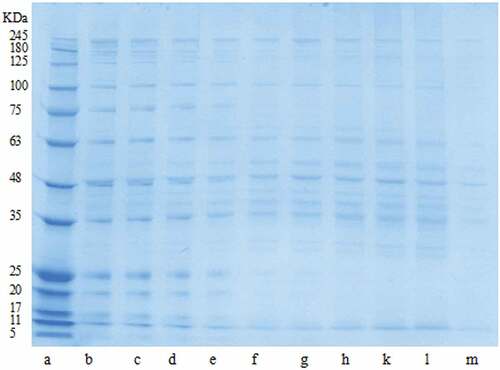
The SDS-PAGE patterns of protein samples of broilers and YFC cooked at different temperatures are illustrated in . The results indicated that the proportion of larger size band (high molecular weight) decreased as the cooking temperature increased. There were slight differences in the intensity of bands of high molecular weight proteins in all cooking temperatures of both breeds except cooking at 100°C where the pronounced differences in the band intensities can be observed. YFC cooked at 100°C have not shown any clear bands of myosin heavy chain (MHC) whereas broilers have shown. In case of actin protein, the band intensities seemed quite similar, except at 100°C where the similar trend was observed as of MHC. The thermal stability of actin is higher than MHC.[Citation30] Previous study in YFC has demonstrated that bands range from 10 to 35 KDa could be the result of migrations of protein during stewing or by the thermal degradation of MHC.[Citation31]Polymerization of MHC might be the reason for its disappearance. At 60°C and 70°C cooking there are no obvious differences in the band intensities of actin. This result is consistent with the previous study done by[Citation32]who found that there is no obvious change in the band intensities while cooking at 60°C of beef. But our study has demonstrated that even cooking at 60°C, 70°C and 80°C had not a significant difference in band width observed in both breeds. Cooking below 80°C the majority of bands remained visible. Whereas cooking at 100°C showed clear variations in both breeds. Therefore, cooking at 100°C has affected the YFC the most. Our results suggested that high molecular weight protein fragmentation occurred with increasing cooking temperature. Similar findings have also been observed by other reports where heated beef proteins polypeptides chains went through unfolding, disintegration and shortening.[Citation33]
Figure 3. SDS-PAGE of breast meat subjected to different cooking temperatures for 40 min. (a) Marker. (b) 60°C Broilers. (c) 60°C YFC. (d) 70°C Broilers. (e) 70°C YFC. (f) 80°C Broilers. (g) 80°C YFC. (h) 90°C Broilers. (k) 90°C YFC. (l) 100°C Broilers. (m)100°C YFC. YFC: Yellow-feathered chicken
Dynamic rheological properties
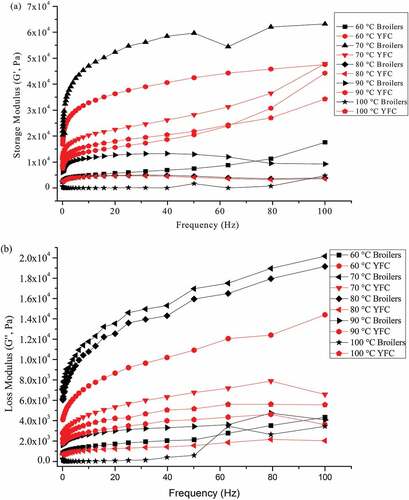
Dynamic rheological properties of MP from cooked meat samples have been extensively studied.[Citation34] MP suspension obtained from broilers and YFC subjected to different cooking temperatures was used to determine the viscoelastic rheogram (). The subsequent values of storage modulus (G′) and loss modulus (G′′) were observed in the frequency range of 0.1 to 100 Hz at 10°C. Results indicated that the breed differences are quite evident in both storage and loss moduli, indicating the different thermodynamic and thermal stability of proteins. Cooking at 100°C affected the most on broilers as compared to YFC demonstrating the lowest values. Cooking at 60 and 70°C had the highest values of both moduli. Both moduli seemed dependent on the frequency sweep test, as the frequency increases the increment in the values of both moduli was observed. The results showed the frequency dependency over the whole range of frequency except cooking at 100°C especially in broilers. Previous reports have also indicated the similar pattern of storage and loss moduli of proteins gel in the frequency sweep test.[Citation35,Citation36] As shown in the , YFC gels demonstrated more constant G′values because of its well-structured gel. This gel was formed by orderly modification in three-dimensional protein networks with entrapping water molecules. Present study indicated the higher magnitude of G′ than the G′′ over the frequency range indicating as weaker gels.[Citation36] Higher G′ values indicates rigid and less elastic product as seen in broilers samples, whereas low magnitude demonstrates the softness of products. Differences in the G′ values is associated with the muscle types and species.[Citation36]
Figure 4. Dynamic viscoelastic rheograms of storage (G′) modulus (a) and loss (G′′) modulus (b) of breast samples obtained from broilers and YFC subjected to cooking at different temperatures for 40 min. YFC: Yellow-feathered chicken
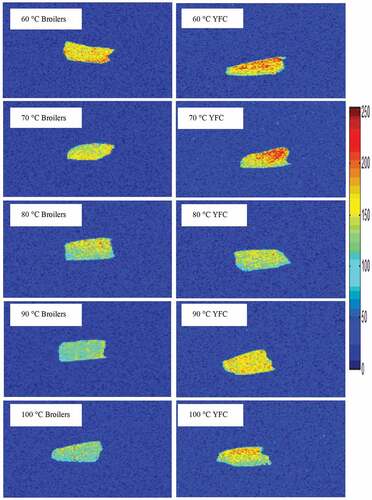
Proton density images
Magnetic resonance imaging (MRI) has been used as a noninvasive technique to unravel the water distribution in poultry meat[Citation19] with heat treatments. Water distribution and migration patterns of the breast meat samples from both breeds subjected to cooking at different temperatures are presented in . Photomicrographs of the samples have red color (high proton density) and blue color (low proton density). The results after cooking evidenced that more water is present in the YFC muscles as compared to broilers. This might be the compacted structures of YFC. Moreover, YFC meat has a higher tendency to hold water as compared to broilers. However, cooking at 100°C in YFC muscles caused more water loss as compared to 90°C. As the heating temperatures increases the mobility and distribution of myowaters is affected which is in consistent with the previous literature.[Citation37]Generally, cooking of raw meat is mandatory for industrial products formation, which causes the migration of water in the meat matrix. Previous literatures have also employed an MRI technique to demonstrate the relationship of cooking with myowatermobility and distribution.[Citation38] Hence, is plausible that with the increase in the cooking temperature the water moved from the intra-myofibrillar spaces into myofibrils gaps and ultimately on toward the meat surface as drip water. This process was more pronounced in broilers than YFC because of loose architecture of broilers muscle fiber. These findings are inconsistent with the LF-NMR data.
Figure 5. H-proton density images of breast samples obtained from broilers and YFC subjected to cooking at different temperatures for 40 min. YFC: Yellow-feathered chicken
Scanning electron microscopy (SEM)
Effect of different cooking temperatures on breast muscles of broilers and YFC was investigated to get the intuitive understanding of the mechanical changes occurred in the myofibers (). SEM has probed the muscles micro structural changes in the cross-sections subjected to different cooking temperatures. The results unravel that different cooking temperatures have affected significantly on the muscle fibers compactness of both breeds. The increase in the cooking temperature has affected the construction of fibers more rapidly in broilers muscles than the YFC. There are gel-like structures formed and covering the myofibers especially at 90°C and 100°C, this phenomenon was more pronounced in the broilers muscles than YFC. This might be the shrinkage and solubilization of connective tissue, sarcoplasmic and myofibril proteins. Interestingly, in YFC muscles cooking at 100°C made them harder and ultimately compacted muscle structures were observed. Higher mechanical damages were more evident in broilers muscles than YFC. Moreover, extra myofibril spaces are covered by gel or gel-like substances. These changes in myofibrils microstructures suggest the migration of immobilized water. These findings are in agreement with the[Citation39,Citation40] who found that during cooking proteolytic degradation leads to the formation of gels and aggregation of muscle proteins and, destruction of cell membranes ultimately causes the shrinkage in the muscle fibers.
Figure 6. Cross-sections of breast samples obtained from broilers and YFC subjected to cooking at different temperatures for 40 min observed by SEM ×120. YFC: Yellow-feather chicken
Correlations analyses
Partial least squares regression (PLSR) was established among physical meat quality traits, different cooking temperatures and volumetric changes (length, volume, and CSA) is presented in the . The correlations between physical meat quality traits as X (First component, 74.24%) and volumetric changes as Y (second component, 19.05%) are present in the . In the first component of PLSR the volumetric changes are positively correlated at a higher cooking temperature. YFC cooked at 90°C and 100°C showed similar effects on meat quality traits in the first matrix. Plot demonstrated the inverse correlations among the cooking loss %, EM % and a*. Cooking at 60°C, broilers and YFC are far apart from each other. The correlations between biophysical meat quality traits as X and different cooking temperatures as Y is illustrated in the . Cooking at 90°C and 100°C has inverse correlations with L* and pH values, whereas an opposite trend was observed in broilers. In case of YFC cooking at 90°C and 100°C has a similar trend/associations with other meat quality traits which is in consistent with the other measured quality parameters. Hardness and chewiness have strong positive correlations. Cooking loss % and EM % have strong negative correlations. Increased cooking temperatures increases the hardness because the loss of water and toughening of muscles due to aggregations of proteins and denaturation of collagen and connective tissues. Researchers have observed good correlations among cooking temperature, time and cooking loss by using PLSR.[Citation41]These findings are also in consistent with data of correlations between the physical parameters (). The PLSR results suggest that volumetric changes in the meat blocks and different cooking temperatures have associations with the physical meat quality traits of breast meat from both breeds.
Figure 7. An overview of variations found in the mean data from the correlation loading plot (first and second PLS component) of PLSR using meat quality traits as X and dimensional changes (CSA, length, and volume) as Y (a). Correlation loading plot (first and second PLS component) of PLSR using meat quality traits of breast samples as X and different cooking temperatures as Y (b). B: Broilers; YFC: Yellow-feathered chicken; CSA: Cross-sectional area
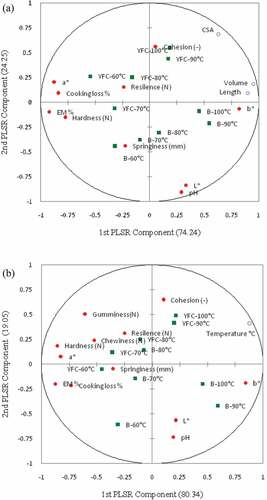
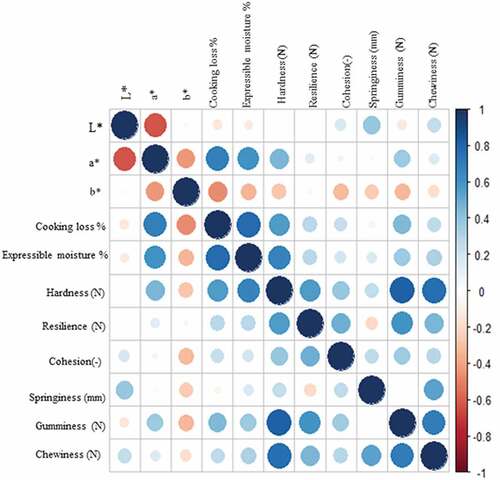
Figure 8. Correlations plot among the measured meat quality traits of breast samples of broilers and YFC subjected to different cooking temperatures. YFC: Yellow-feathered chicken
Physical quality traits
An overview of correlation plot among the measured meat quality traits (variables) as affected by the cooking process is presented in . Cooking loss and EM percentages were strongly positively correlated with a*. When meat looses water through cooking or press loss tends to become darker. Gumminess is negatively correlated with chewiness. The similar trend was observed in the texture analysis results. Another study has established the correlations among physical quality variables.[Citation42] Our results give insight into the correlations among the measured variables from the pooled data of both breeds. Results have demonstrated that L* and a* were highly correlated whereas no correlation was observed between L* and b*.
Conclusion
This study compared the breed differences and volumetric changes as affected by different cooking temperatures with every 10°C rise of temperature. Both breeds showed marked differences in their characteristics at different cooking temperatures. Different cooking temperatures yield the maximum cooking losses and volumetric changes in broilers muscles than YFC. Cooking at 100°C in YFC muscles resulted in undesirable textural changes and biophysical properties, meanwhile the opposite was observed in broilers. Meat quality traits are associated with each other along with cooking temperatures and volumetric changes. Moreover, volumetric changes in the breast meat blocks with respect to cooking temperatures could provide valuable information for the meat processing industry to predict the losses in products at five different cooking temperatures. This study also provides an understanding on textural, color and expressible moisture changes as affected by different cooking temperatures.
Acknowledgments
Authors extend their gratitude to Sehrish Noreen for her statistical assistance to this study. The authors have no conflict of interest to report.
Additional information
Funding
References
- Fletcher, D. L.; Qiao, M.; Smith, D. P. The Relationship of Raw Broiler Breast Meat Color and pH to Cooked Meat Color and pH. Poult. Sci. 2000, 79, 784–788. Oxford University Press Oxford, UK. DOI: 10.1093/ps/79.5.784.
- Wattanachant, S.; Benjakul, S.; Ledward, D. A. Effect of Heat Treatment on Changes in Texture, Structure and Properties of Thai Indigenous Chicken Muscle. Food Chem. 2005, 93, 337–348. Elsevier. DOI: 10.1016/j.foodchem.2004.09.032.
- Tornberg, E.;. Effects of Heat on Meat proteins–Implications on Structure and Quality of Meat Products. Meat Sci. 2005, 70, 493–508. Elsevier. DOI: 10.1016/j.meatsci.2004.11.021.
- Lewis, G. J.; Purslow, P. P. The Strength and Stiffness of Perimysial Connective Tissue Isolated from Cooked Beef Muscle. Meat Sci. 1989, 26, 255–269. Elsevier. DOI: 10.1016/0309-1740(89)90011-9.
- Christensen, M.; Purslow, P. P.; Larsen, L. M. The Effect of Cooking Temperature on Mechanical Properties of Whole Meat, Single Muscle Fibres and Perimysial Connective Tissue. Meat Sci. 2000, 55, 301–307. Elsevier. DOI: 10.1016/S0309-1740(99)00157-6.
- Micklander, E.; Peshlov, B.; Purslow, P. P.; Engelsen, S. B. NMR-Cooking: Monitoring the Changes in Meat during Cooking by Low-field 1H-NMR. Trends Food Sci. Technol. 2002, 13, 341–346. Elsevier. DOI: 10.1016/S0924-2244(02)00163-2.
- Barbanti, D.; Pasquini, M. Influence of Cooking Conditions on Cooking Loss and Tenderness of Raw and Marinated Chicken Breast Meat. LWT-Food Sci. Technol. 2005, 38, 895–901. Elsevier. DOI: 10.1016/j.lwt.2004.08.017.
- Zell, M.; Lyng, J. G.; Cronin, D. A.; Morgan, D. J. Ohmic Cooking of Whole Turkey meat–Effect of Rapid Ohmic Heating on Selected Product Parameters. Food Chem. 2010, 120, 724–729. Elsevier. DOI: 10.1016/j.foodchem.2009.10.069.
- Xu, X.-L.; Han, M.-Y.; Fei, Y.; Zhou, G.-H. Raman Spectroscopic Study of Heat-induced Gelation of Pork Myofibrillar Proteins and Its Relationship with Textural Characteristic. Meat Sci. 2011, 87, 159–164. Elsevier. DOI: 10.1016/j.meatsci.2010.10.001.
- Martens, H.; Stabursvik, E.; Martens, M. Texture and Colour Changes in Meat during Cooking Related to Thermal Denaturation of Muscle Proteins 1. J. Texture Stud. 1982, 13, 291–309. Wiley Online Library. DOI: 10.1111/j.1745-4603.1982.tb00885.x.
- Herrero, A. M.; Carmona, P.; López-López, I.; Jiménez-Colmenero, F. Raman Spectroscopic Evaluation of Meat Batter Structural Changes Induced by Thermal Treatment and Salt Addition. J. Agric. Food Chem. 2008, 56, 7119–7124. ACS Publications. DOI: 10.1021/jf800925s.
- Wang, H.; Zhang, X.; Wang, G.; Jia, K.; Xu, X.; Cesare, A. D. Bacterial Community and Spoilage Profiles Shift in Response to Packaging in Yellow-Feather Broiler, a Highly Popular Meat in Asia. Front. Microbiol. 2017, 8, 1–12. DOI: 10.3389/fmicb.2017.02588.
- Fan, M.; Xiao, Q.; Xie, J.; Cheng, J.; Sun, B.; Du, W.; Wang, Y.; Wang, T. Aroma Compounds in Chicken Broths of Beijing Youji and Commercial Broilers. J. Agric. Food Chem. 2018, 66, 10242–10251. American Chemical Society. DOI: 10.1021/acs.jafc.8b03297.
- Council NR. Nutrient Requirements of Poultry: 1994; National Academies Press, Washington, DC.
- Purslow, P. P.; Oiseth, S.; Hughes, J.; Warner, R. D. The Structural Basis of Cooking Loss in Beef: Variations with Temperature and Ageing. Food Res. Int. 2016, 89, 739–748. DOI: 10.1016/j.foodres.2016.09.010.
- Li, Y.; Li, X.; Wang, J.; Zhang, C.; Sun, H.; Wang, C.; Xie, X. Effects of Oxidation on Water Distribution and Physicochemical Properties of Porcine Myofibrillar Protein Gel. Food Biophys. 2014, 9, 169–178. DOI: 10.1007/s11483-013-9329-9.
- Bertram, H. C.; Andersen, H. J. NMR and the Water‐holding Issue of Pork. J. Anim. Breed Genet. 2007, 124, 35–42. Wiley Online Library. DOI: 10.1111/jbg.2007.124.issue-s1.
- Omana, D. A.; Moayedi, V.; Xu, Y.; Betti, M. Alkali-aided Protein Extraction from Chicken Dark Meat: Textural Properties and Color Characteristics of Recovered Proteins. Poult. Sci. 2010, 89, 1056–1064. Oxford University Press Oxford, UK. DOI: 10.3382/ps.2009-00441.
- Shaarani, S. M.; Nott, K. P.; Hall, L. D. Combination of NMR and MRI Quantitation of Moisture and Structure Changes for Convection Cooking of Fresh Chicken Meat. Meat Sci. 2006, 72, 398–403. DOI: 10.1016/j.meatsci.2005.07.017.
- Chelh, I.; Gatellier, P.; Santé-Lhoutellier, V. Technical Note: A Simplified Procedure for Myofibril Hydrophobicity Determination. Meat Sci. 2006, 74, 681–683. DOI: 10.1016/j.meatsci.2006.05.019.
- Lechevalier, V.; Musikaphun, N.; Gillard, A.; Pasco, M.; Guérin-Dubiard, C.; Husson, F.; Nau, F. Effects of Dry Heating on the Progression of in Vitro Digestion of Egg White Proteins: Contribution of Multifactorial Data Analysis. Food Funct. 2015, 6, 1578–1590. Royal Society of Chemistry. DOI: 10.1039/C4FO01156B.
- Li, Y.; Jia, W.; Zhang, C. H.; Li, X.; Wang, J. Z.; Zhang, D. Q.; Mu, G. F. Fluctuated Low Temperature Combined with High-humidity Thawing to Reduce Physicochemical Quality Deterioration of Beef. Food Bioprocess Technol. 2014, 7, 3370–3380. Springer. DOI: 10.1007/s11947-014-1337-3.
- Team Rs. RStudio: Integrated Development for R; RStudio, Inc: Boston, MA, http://www.rstudio.com. 2015; Vol. 42. pp. 14.
- Hughes, J.; Clarke, F.; Purslow, P.; Warner, R. High pH in Beef Longissimus Thoracis Reduces Muscle Fibre Transverse Shrinkage and Light Scattering Which Contributes to the Dark Colour. Food Res. Int. 2017, 101, 228–238. DOI: 10.1016/j.foodres.2017.09.003.
- Hamm, R.; Deatherage, F. E. Changes in Hydration, Solubility and Charges of Muscle Proteins during Heating of Meat. J. Food Sci. 1960, 25, 587–610. Wiley Online Library. DOI: 10.1111/j.1365-2621.1960.tb00004.x.
- Aaslyng, M. D.; Bejerholm, C.; Ertbjerg, P.; Bertram, H. C.; Andersen, H. J. Cooking Loss and Juiciness of Pork in Relation to Raw Meat Quality and Cooking Procedure. Food. Qual. Prefer. 2003, 14, 277–288. Elsevier. DOI: 10.1016/S0950-3293(02)00086-1.
- Oz, F.; Kizil, M.; Cakmak, I. H.; Aksu, M. I. The Effect of Direct Addition of Conjugated Linoleic Acid on the Formation of Heterocyclic Aromatic Amines in Beef Chops. J. Food Process. Preserv. 2015, 39, 2820–2833. DOI: 10.1111/jfpp.12533.
- Grossi, A.; Søltoft-Jensen, J.; Knudsen, J. C.; Christensen, M.; Orlien, V. Reduction of Salt in Pork Sausages by the Addition of Carrot Fibre or Potato Starch and High Pressure Treatment. Meat Sci. 2012, 92, 481–489. Elsevier. DOI: 10.1016/j.meatsci.2012.05.015.
- Harris, P. V.;. Structural and Other Aspects of Meat Tenderness. J. Texture Stud. 1976, 7, 49–63. Wiley Online Library. DOI: 10.1111/j.1745-4603.1976.tb01381.x.
- Huang, F.; Huang, M.; Xu, X.; Zhou, G. Influence of Heat on Protein Degradation, Ultrastructure and Eating Quality Indicators of Pork. J. Sci. Food Agric. 2011, 91, 443–448. Wiley Online Library. DOI: 10.1002/jsfa.v91.3.
- Qi, J.; Wang, H. H.; Zhang, W. W.; Deng, S. L.; Zhou, G. H.; Xu, X. L. Identification and Characterization of the Proteins in Broth of Stewed Traditional Chinese Yellow-feathered Chickens. Poult. Sci. 2018, 97, 1852–1860. DOI: 10.3382/ps/pey003.
- Dondero, M.; Figueroa, V.; Morales, X.; Curotto, E. Transglutaminase Effects on Gelation Capacity of Thermally Induced Beef Protein Gels. Food Chem. 2006, 99, 546–554. Elsevier. DOI: 10.1016/j.foodchem.2005.08.022.
- HEARNE, L. E.; PENFIELD, M. P.; GOERTZ, G. E. Heating Effects on Bovine Semitendinosus: Shear, Muscle Fiber Measurements, and Cooking Losses. J. Food Sci. 1978, 43, 10–12. Wiley Online Library. DOI: 10.1111/j.1365-2621.1978.tb09724.x.
- Hamman, D. D.;. Rheology as a Means of Evaluating Functionality in Processing Muscle Foods. Food Technol. 1988, 42, 66–71.
- Ferry, J. D.;. Viscoelastic Properties of Polymers; John Wiley & Sons, 1980.USA.
- Karaman, S.; Yilmaz, M. T.; Dogan, M.; Yetim, H.; Kayacier, A. Dynamic Oscillatory Shear Properties of O/W Model System Meat Emulsions: Linear Viscoelastic Analysis for Effect of Temperature and Oil Concentration on Protein Network Formation. J. Food Eng. 2011, 107, 241–252. Elsevier. DOI: 10.1016/j.jfoodeng.2011.06.016.
- Wang, C.; Wang, H.; Li, X.; Zhang, C. Effects of Oxygen Concentration in Modified Atmosphere Packaging on Water Holding Capacity of Pork Steaks. Meat Sci. 2019, 148, 189–197. DOI: 10.1016/j.meatsci.2018.10.001.
- Bouhrara, M.; Clerjon, S.; Damez, J.-L.; Chevarin, C.; Portanguen, S.; Kondjoyan, A.; Bonny, J.-M. Dynamic MRI and Thermal Simulation to Interpret Deformation and Water Transfer in Meat during Heating. J. Agric. Food Chem. 2011, 59, 1229–1235. ACS Publications. DOI: 10.1021/jf103384d.
- Davey, C. L.; Niederer, A. F. Cooking Tenderizing in Beef. Meat Sci. 1977, 1, 271–276. Elsevier. DOI: 10.1016/0309-1740(77)90022-5.
- Christensen, L.; Ertbjerg, P.; Aaslyng, M. D.; Christensen, M. Effect of Prolonged Heat Treatment from 48 C to 63 C on Toughness, Cooking Loss and Color of Pork. Meat Sci. 2011, 88, 280–285. Elsevier. DOI: 10.1016/j.meatsci.2010.12.035.
- Berhe, D. T.; Engelsen, S. B.; Hviid, M. S.; Lametsch, R. Raman Spectroscopic Study of Effect of the Cooking Temperature and Time on Meat Proteins. Food Res. Int. 2014, 66, 123–131. Elsevier Ltd. DOI: 10.1016/j.foodres.2014.09.010.
- Li, C.; Liu, D.; Zhou, G.; Xu, X.; Qi, J.; Shi, P.; Xia, T. Meat Quality and Cooking Attributes of Thawed Pork with Different Low Field NMR T 21. Meat Sci. 2012, 92, 79–83. Elsevier Ltd. DOI: 10.1016/j.meatsci.2011.11.015.