
ABSTRACT
The objective of this study was to observe the potential of machine vision (MV) approach for the classification of eight citrus varieties. The leaf images of eight citrus varieties that were grapefruit, Moussami, Malta, Lemon, Kinow, Local lemon, Fuetrells, and Malta Shakri. These were acquired by a digital camera in an open environment without any complex laboratory setup. The acquired digital images dataset was transformed into the multi-feature dataset that was the combination of binary, histogram, texture, spectral, rotational, scalability and translational (RST) invariant features. For each citrus leaf image, total 57 multi-features were acquired on every non-overlapping region of interest (ROI), i.e. (32x32), (64x64), (128x128), and (256x256). Furthermore, the optimized 15 features using the supervised correlation-based feature selection (CFS) technique were acquired. The optimized multi-features dataset to different MV classifiers namely Multilayer Perceptron (MLP), Random Forest (RF), J48 and Naïve Bayes using10-fold cross-validation method were plugged-in. The results produced by MLP presented an average overall accuracy of 98.14% on ROIs (256x256) outperforming the other classifiers. The classification accuracy values by MLP on the eight citrus leaf varieties, namely; Grapefruit, Moussami, Malta, Lemon, Kinow, Local lemon, Fuetrells, and Malta Shakri were observed 98%, 98.75%, 99.25%, 97.5%, 97%, 95.87%, 95.5%, and 99.37% respectively.
Introduction
In the field of precision agriculture, accurate classification of plant varieties is one of the major tasks in the current research.[1] The leaves are the basic unit of plants and they vary in shape, size, color, structure, and texture[Citation1,Citation2] and are helpful in differentiating one variety from the other. Nowadays in South Asian countries, the classification of Citrus leaf attracted a number of researchers.[Citation2,Citation3] Citrus fruit is a natural source of vitamin C, fiber, potassium and glucose. The usage of citrus fruit is very beneficial for heart and sugar patients. It contains high water content which is more than 85% and the usage of such a high water content food helps to prevent dehydration by providing energy with fewer calories to reduce the weight.[Citation3] It is also ranked as the second most important fruit after grapes in terms of cultivation and production in the world.[Citation3] In Pakistan, almost 200,000 hectares area is used for citrus cultivation. The Punjab state in Pakistan is producing almost 64% of citrus variety kinow. Pakistan is the sixth-largest producer of citrus fruit. Different varieties are produced locally such as Lemon, Malta, Moussami, and Kinow (mandarin). Among these, Citrus Reticula Kinow (Mandarin) is the most popular variety and almost 95% of this variety is produced in Pakistan and making this country as the largest supplier of this citrus variety and has become a million-dollar industry in Pakistan.[Citation4]
The classification of different types of citrus leaves is one of the most widely discussed topics in fruit and food processing tasks. The conventional methodologies have been used for the classification of several plant varieties collected during the field survey and domain knowledge and it was observed that these methodologies were time-consuming, inefficient and expansive in terms of computation resources and time. Unlike other plants, the citrus leaves occupy most of the plant area that makes it easy to discriminate it from other plants. Since there are a number of citrus varieties and it is not possible to classify the accurate citrus plant by observing the leaf, therefore, there is a need for a system that helps in automatic recognition of citrus leaves with higher accuracy. This paper focuses on the classification of citrus leaves of different varieties mentioned earlier, rather than the whole citrus plants. It is also observed that visual examination of the citrus leaves is very difficult due to the close resemblance of leaf features such as shape, size, color, texture, and geometrical features among its different varieties. The confusing statements regarding discrimination of citrus varieties may cause serious issues such as the blind use of fertilizers and pesticides that may lead to low yield production by quantity and quality etc. In order to resolve these issues, we tried to address three major challenges: (a) pre-processing the raw image to extract appropriate features; (b) embedding (or fusing)the extracted features using a linear combination; and (c) optimizing these embedded (or fused) features and applying appropriate machine learning classifiers.
A number of different citrus varieties are produced in the world. The development of the classification system of these varieties at an early stage plays a very significant role to get better-quality production and also to control the diseases.[Citation5] The majority of the plant’s diseases are recognized through leaf symptoms.[Citation6,Citation7] Similarly, a number of researchers used machine vision approaches for the classification of plants and their diseases, reported in.[Citation8–Citation10] In a noteworthy work reported in[Citation11], the authors proposed a mobile application for real-time recognition of plant species by extracting the features of the leaf. Similarly, in[Citation12] the authors categorized 32 plants by using about 12 leaf features. A variant of an artificial neural network called the Probabilistic Neural Network (PNN)is applied on a leaf image dataset of 1800 images and achieved 90%accuracy.Quite different work is observed in the work of[Citation13] in which the authors correctly identified the cotton leaves and sugarcane-plants using multispectral radiometric data with 98%accuracy.In[Citation14], two different types of temporal data of five different wheat varieties were used for classification. The data consist of radiometric information and photographic statistics and reported an accuracy rate of 96% and 93.14% respectively. A novel set of features is introduced in the work of[Citation15] that includes the color and shape features. These features are then used to classify 8 varieties of pepper seeds using the artificial neural network (ANN) and observed an accuracy of 84.94%. A similar set of features are also used in[Citation16,Citation17] and achieved an accuracy of 97% and 67% accuracy. Furthermore, in[Citation17], the classification results were significantly improved to 87%by standardizing individual kernel images in terms of their anteroposterior and dorsoventral orientation and performing additional analyzes of wrinkled regions. In[Citation18], the authors detected the fungi-caused diseases in sugarcane with an accuracy rate of 98.60% using simple and triangle threshold values for leaf and lesion-area segmentation respectively. The above-mentioned disease was further categorized by calculating the quotient of the lesion area and leaf area. The authors also claimed that the level of severity of leaf disease is also calculated quite accurately. A quite different software model was suggested in[Citation7] to identify species of leaf, pest and crop diseases using the feed-forward back-propagation neural networks (BPNN). The system was divided into modules namely: Leaf Preprocessing, Network Training, Leaf Recognition, and Expert advice. In the first module, the edge of the leaf and token values were found. The second module described the training of the leaf data to the neural network and finding the error graph. The third and fourth modules were used to recognize the species of the leaf and to identify the pest or disease incidence. The last module was aimed at matching the recognized pest or disease sample to the database wherein pest-disease image samples and correcting remedial measures for their management were stored. A similar disease in the citrus plant was identified with notable accuracy reported in.[Citation7] The citrus leaves were used to extract the colorFootnote1 texture features. The discriminant analysis was applied for feature reduction and observed an average accuracy of 95% for this optimized and efficient framework.[Citation19]
It is a non-trivial task to identify plant species in an automated classification system since this activity requires specialized related knowledge-base information. The correct knowledge would help the specialists and the layman to identify plant species quite easily. In a pioneer work reported in[Citation20], the shape descriptors were applied on the myDAUN1dataset that contain 45 tropical shrub species collected from the University of Malaya (UM), Malaysia. Based on the literature review, this was the first study in both the development of a tropical shrub species image dataset and classification using a hybrid of leaf shape and machine learning approach. Four types of shape descriptors were used in this study namely morphological shape descriptors (MSD), Histogram of Oriented Gradients (HOG), Hu invariant moments (Hu) and Zernike Moments (ZM). The single descriptor along-with the combination of hybrid descriptors was tested and compared. The tropical shrub species were classified using six different classifiers namely, artificial neural network (ANN),Random Forest (RF), Support Vector Machine (SVM), k-nearest neighbor (k-NN), linear discriminant analysis (LDA) and directed acyclic graph multi-class least squares twin support vector machine (DAGMLSTSVM).In addition, three types of feature selection methods namely Relief Correlation-based feature selection (CFS) and Pearson’s coefficient correlation (PCC) were tested in the myDAUN dataset. The well-known Flavia datasetFootnote2 and Swedish Leaf datasetFootnote3 were used as the validation dataset on the proposed methods. The results showed that the hybrid of all descriptors of ANN outperformed the other classifiers with an average classification accuracy of98.23% for the myDAUN dataset, 95.25% for the Flavia and 99.89% for the Swedish Leaf dataset. In addition, the Relief feature selection method achieved the highest classification accuracy of 98.13% after 80 or (60%) of the original features were reduced, from 133 to 53 descriptors in them yDAUN dataset with the reduction in computational time. In[Citation21], the authors described the leaf features-based identification of plants using deep learning. They also introduced a new hybrid model that helped in exploiting the correspondence of different contextual information of leaf features. It was experimentally shown that hybrid local-global features learned using DL (Deep Learning) can improve recognition performance compared to previous techniques. In a notable work[Citation22], the authors developed a deep learning-based plant identification system using discriminative features of leaf images. They used the publicly available leaf images dataset namely, Leaf SnapFootnote4, Flavia and Foliage and it was observed that a Convolutional Neural Network (CNN) provides better feature representation for leaf images as compared to hand-crafted features used in.[Citation23]
The Texture-based dense segmentation and shape-based object detection approaches were used in mango fruit detection and the results were compared to existing ones and the quite different work reported in.[Citation24] First-nearest neighbor pixel-based classification and contour segmentation along with super pixel-based classification were used in Support Vector Machine (SVM). SVM outperformed the k-nearest neighbor classifier for mango fruit counting. In a noteworthy work of[Citation25], the authors proposed a plant identification approach using 2D digital leaves images. The approach used two features of extraction methods based on one-dimensional (1D), two-dimensional (2D) and the Bagging classifier. For the1D-basedmethods, the Principal Component Analysis (PCA), Direct Linear Discriminant Analysis (DLDA), and a combination of both were applied, while 2DPCA and 2DLDAalgorithms were used for the 2D-based method. In order to classify the extracted features in both methods, the Bagging classifier with the decision tree was observed as a weak learner. The five variants of the approaches, i.e. PCA, PCA+LDA, DLDA, 2DPCA, and2 DLDA were tested using the Flavia publicly dataset that consists of 1907 colored leaves images. The accuracy of these variants was evaluated and it was observed that the 2DPCA and 2DLDA methods were much better than the other approaches. A similar set of approaches was also used in[Citation26] that presented a classification approach based on Random Forests (RF) and Linear Discriminant Analysis (LDA) algorithms for classifying the different types of plants. Since most types of plants leaves were unique, therefore the classification approach presented by the authors was dependent on the structure of plant leaves. The leaves of the dataset were different from each other by characteristic features such as shape, color, texture, and margin. The dataset used for the experiment contained data of different plant species with a total of 340 leaf images. The dataset is publicly available on the UCI-Machine Learning Repository5. This dataset was used for both training and testing purposes using 10-foldcross-validation. The experimental results showed that LDA achieved a classification accuracy of 92.65% against the RF.
Attique et al.[Citation27] proposed a new technique for the classification of four diseases in apple fruit by developing a genetic algorithm to optimize the multi-features. The One-vs.-All M-SVM classifier was used as a base classifier and achieved a classification result of 98.10%. Similarly, in[Citation28], the authors developed an automated system for disease detection in grapes. A number of different features namely, texture, color and geometric were extracted and fused by using the canonical correlation analysis (CCA).Furthermore, the feature optimization was performed by Neighborhood Component Analysis (NCA) and acquired 92% classification accuracy by using an M-class SVM classifier. A quite different approach was adopted and reported in[Citation29] in which the authors proposed a classification model based on correlation coefficient and deep features (CCDF) for different fruit diseases. The suggested model comprised of two main steps: (a) features extraction used for detecting infected regions, (b) classification of healthy and non-healthy fruits based on infected regions. A genetic algorithm was developed for feature optimization and achieved results with 98% accuracy from the experimental work performed on two publicly available datasets, plant-village and CASC-IFW.[Citation29] A noteworthy article[Citation30] reviewed a number of plant diseases in general and also covers the classification of citrus plant diseases in specific. It also covered the limitations and research dimensions of different machine learning techniques in citrus plant diseases. Hafiz et al.[Citation31] produced an image dataset of citrus fruits, leaves, and stems. The dataset comprises healthy and unhealthy plants with diseases description. It is pertinent to mention that the produced dataset is available publicly that would help the researchers performing research activities related to plant diseases. In[Citation32], the authors presented the visible to near-infrared spectroscopy model for pomegranate fruit. They explored the different maturity stages of pomegranate fruit with spectral ranges 400 nanometers to 1100 nanometers and measured different quality features by using the principal component analysis (PCA).Similarly, in[Citation33], a group of researchers presented the machine vision model for the classification of ten potato varieties. A number of different features were acquired and optimized using the PCA. Artificial Neural network was then used to perform classification and achieved some noteworthy accuracy rate. Same approaches were used in[Citation34] in which the authors introduced the short near-infrared spectroscopy model for three Thai orange varieties. They explored different maturity stages of orange varieties with spectral ranges 643 nanometers to 970 nanometers by measuring different quality features using PCA. Finally, they used kernel principle component analysis with kernel least-square forward selection (KLS-FS) with SVM and reported acceptable accuracy results. Other significant related works also recommended the use of machine learning approaches in crop identification[Citation35–Citation37], land cover classification and medical image analysis.[Citation38–Citation41] It is concluded from the literature, there is dearth in research work for the classification of citrus plant varieties using a multi-feature approach. Therefore, there is a need for an efficient, cost-effective, automatic and reliable system for the identification of citrus plants varieties using a machine vision approach.
The objectives of this study were: (i) to introduce a new technique, Linearly Optimized Fused Feature (LOFF) Classification framework, for classification citrus varieties using leaf features. This framework comprises four steps, (ii) First, the citrus images are preprocessed to prepare it for further processing (iii)Second, a new segmentation technique, Threshold oriented Clustering Segmentation (TCS) is used to extract the area of interest by eliminating the background and foreground of the image, (iv) Then extract out the multi-features in the third step(iv) Then we fused the multi-features through linear combinations procedure in order to get the optimal feature set which is then plugged into ML classifiers and achieved higher classification accuracy. This study describes the novel approach for the classification of citrus leaves using fused features.
Materials and methods
As mentioned earlier, this study depicts the classification of different varieties of citrus plants namely, Grapefruit, Moussami, Malta, Lemon, Kinow, Local Lemon, Fuetrells and Malta Shakri. The whole image data acquisition was performed in a natural environment at the Islamia University of Bahawalpur, Pakistan agricultural farms located at 29◦23.44”Nand71◦41.1”E.These images were captured using a digital Nikon Coolpix camera with a resolution of 10.1 megapixels. Local citrus varieties cultivars in Pakistan are briefly discussed in .
Table 1. Local citrus varieties cultivar in Pakistan.[Citation42]
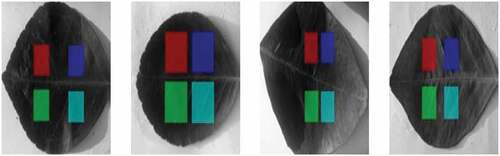
For experimental work, about 20 healthy plants with 200 fresh leaves were selected for each variety of citrus. All images were captured at one feet height using a still-mounted camera to have a sun shadow effect as least as possible. Furthermore, all images were captured at noontime on an open sunny day. Finally, a high-quality image dataset of 200 × 8 = 1600 colored images of pixel-dimension 4190 × 3010 was developed with a 24-bit JPEG format used to perform our experimental work. shows a sample of 8 different varieties of citrus leaf images selected for experimentation. In order to get a precise image, a white paper sheet was placed under the leaves before acquiring the leaf images and scanned at 300 dpi using a flatbed scanner. Afterward, the images were preprocessed using picture manager software, available in Microsoft-Office. All the 1600 color images of citrus leaf were resized to 800 × 600 for generalization and converted into the 8-bit gray-level and stored in Bitmap (BMP) format as shown in . Four non-overlapping Regions Of Interest (ROIs) of different pixel dimensions, 32 × 32, 64 × 64, 128 × 128 and 256 × 256 respectively were developed in order to augment the dataset and also to retain maximum information for each leaf image. shows a sample of leaves showing four non-overlapping areas of interest.
Figure 1. Digital images of 8 citrus leaf varieties
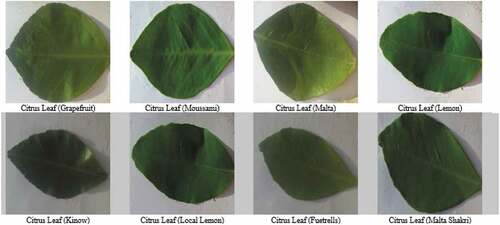
Figure 2. Gray level images of 8 citrus varieties
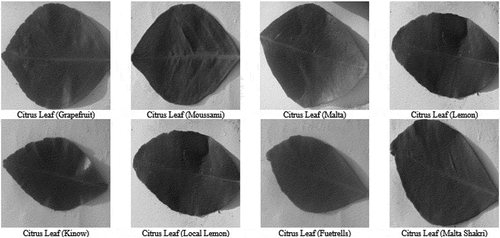
Figure 3. Gray level citrus leaf images of four non- overlapping regions of interest (ROIs)
Multispectral imaging data was extracted using Multispectral radiometer (MSR5)[Citation37] comprising a total of 5 features in spectral bands namely Blue (B), Green (G), Red (R), Near Infrared (NIR) and Shortwave Infrared (SWIR) ranging from 450 nanometers to1550 nanometers. These spectral features were then embedded with statistical and geometrical features of the leaf images like the first-order histogram, second-order statistical texture, binary, RST (Rotational, Scalability, and Translational) features. As a result, a total of 57 fused multi-featured datasets was developed for each sub-image (or ROI). In this way total, 6400 × 57 = 364800 fused multi-feature dataset was developed for each size of ROIs.
Proposed methodology
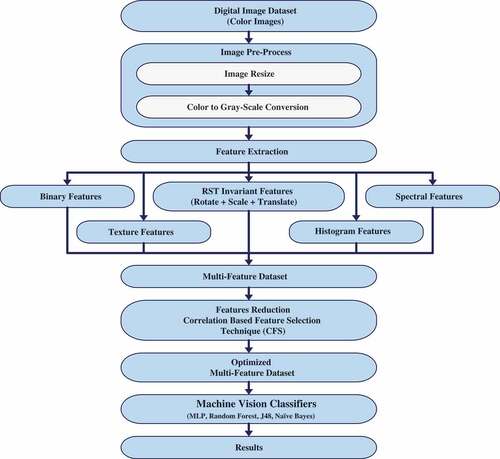
A detailed description of the proposed methodology is given in steps in this section. The first step was Image acquisition followed by the pre-processing phase. For segmentation, a new segmentation technique called Threshold oriented Clustering Segmentation (TCS) (see Algorithm 1) was used successfully. Our proposed approach comprises three main steps:
First, the TCS technique was applied to compute the background pixels (BP) values at a particular threshold by considering a complete cluster as the background of the image. Secondly, this threshold level (BP) was used as a base pixel value to compare all neighboring pixels and complete the whole image. Finally, if the gray level pixel value (GP) was found greater than (BP), we consider it a foreground pixel (FP) region and grow up the whole cluster by considering it as the foreground or region of interest (ROI).
Algorithm 1. Threshold Oriented Clustering Segmentation [TCS]
Start{
For total image pixel TiP= 1 to n
Background Pixel threshold value = (BP)
Grey level Pixel value = (GP)
Count cluster1 = 0
If (GP) > (BP)
Count cluster1 ++
Foreground Pixel count
Region of interest (ROI)
Else
Not Segmented Region count
Background Pixel count
End for TiP
}
Multi-feature acquisition
In order to produce a multi-feature dataset of leaf images, the first-order histogram, second-order statistical texture, binary, spectral, rotational, scalability, and translational (RST) features were extracted for every leaf image of the dataset. Furthermore, these features include 5 first-order histogram, 5 texture features comprises on 5 average texture values in all four dimensions, 28 binary features composed of 10 pixel-height and -width of normalized projected values, 6 spectral features including 3 rings and 3 sectors with an additional average value of these spectral features and 7 RST invariant features. A total of 57 multi-feature datasets was developed for each sub-image (or ROI). Based on these multi-faceted features, a total of 364800 (6400 × 57) multi-feature dataset was developed for each size of ROIs. All these features were acquired using a computer vision and image processing (CVIP) tool. The following subsequent sections provide detail about some of the features used in our dataset.
First order histogram features
First order histogram features were calculated using intensity values of the individual pixels. These features are based on histogram features and are also known as first-order statistical features. The first order histogram probability P (h) is described in EquationEquation (i(i) ).
It is clear that M represents the total pixel in the image and L(h) shows the complete instances of grayscale value of h. The first order five histogram features were calculated that were Mean, Standard Deviation, Skewness, Energy, and Entropy. Mean describes the values in average form; it shows the Mean in bright and dark value of the image. Equation (ii) describes the mean.
The value of j represents the gray-scale values ranging from 0 to 255. The (rows) and (column’s) pixel values are shown in a and b. The image contrast describes the Standard deviation (SD). SD is shown in Equation (iii).
When no symmetry has been observed around the center value, it shows the asymmetry and described as a skew and described in Equation (iv).
The distribution of grayscale values defined the Energy and describes in EquationEquation (v(v) ).
The total image data contents describe the Entropy and are defined in Equation (vi)
Second-order histogram features
Second-order statistical features are also called texture features. These features are based on the gray level co-occurrence matrix (GLCM). For this study five second-order texture features were calculated in four dimensions (0°, 45°, 90°,and 135°) up to the 5-pixel distance. Five-second order texture features were extracted namely, entropy, inertia, correlation, inverse difference, and energy. The first “energy” is defined in Equation (vii). Energy is calculated in the distribution between gray level values.
Correlation described the pixel similarity at particular pixel distance. It is defines in Equation (viii).
Entropy describes the total content of the image. It is defined in Equation (ix).
Local homogeneity of the image is called the Inverse difference and described in Equation (x).
The contrast describes the inertia which is defined in Equation (xi).
Rotation, scaling and translation (RST) features
RST values are the invariant features that were extracted by using structural information and histogram oriented descriptor and acquired seven RST invariant features for this work.
Spectral Features: These are the frequency domain based features. Spectral features are useful when classifying the image on texture-based. These features were calculated in the form of power in different regions and these regions were called rings and sectors. Spectral region power was defined in Equation (xii).
Binary features
These features are also called shape features such as area, axis of least second moments, Euler number, the center area, projection, thinness, aspect ratio. For this study, 28 binary object features were extracted by projections with normalizing width and height (10, 10). The ith object area (Ai) was defined in Equation (xiii) below.
The Centroid is defined as with respect of rows and column coordinates to the center of the ith object, and described in Equation (xiv).
Similarly, Orientation is defined as the angel of the axis relative to the vertical axis and described in Equation (xvi).
Perimeter defines the total number of the pixel that constitutes the boundary of the image. It provides the shape of the object. After labeling, it counts the number of pixels ‘1ʹ with neighboring pixel’0ʹ. The edge detector can be used to measure the pixel ‘1ʹ
The thinness ratio is calculated from the object. It is the ratio of area and perimeter and described in Equation (xvii).
Aspect ratio is also called elongation it can be found by observing the object the maximum and minimum values in columns and rows and described in Equation (xviii).
Euler number is expressed in the form of difference among the number of objects and the number of holes and described in Equation (xix).
Projection provides useful information about object shape. When summing the rows it gives horizontal projection and when summing columns, it gives vertical projection and described in Equations (xx) and (xxi).
Feature selection
It was observed that the extracted 57 fused multi-features for each (ROIs) on citrus leaf image were not significant for classification and to handle this 364800 large size feature space consumes more CPU time in model making. This issue was resolved by making the feature size as optimal as possible, as described in[Citation30]so that the faithful representation of the whole data remain persistent and gives appropriate classification result with minimum error rate. The PCA approach showed better results on linearly separable data since the PCA helped in the linear transformation of the input data. Moreover, it was also used as a feature selection. The most expressive feature set (MEF) was acquired using PCA that contained fewer features as of original feature vectors space. Unfortunately, this optimized feature set was not giving the true picture of the whole dataset since the PCA was not capable of maintaining the huge linearly non-separable data. Moreover, the PCA approach was one of the unsupervised techniques but our citrus leaves dataset was labeled and PCA results were not so impressive on labeled data. Therefore, we applied the supervised correlation-based feature selection (CFS) technique to get the optimal feature space from this large-scale and high dimensional dataset. This technique was superior to PCA and has the ability to get the optimal feature dataset for this large size dataset. A supervised correlation-based feature selection (CFS) technique was expressed in the Equation (xxii).
Here shows the heuristic of subset feature T with the
feature space. Whereas
describes the correlation in features and
depicts the average inter-correlation feature value. The numerator in Equation (xxii) shows the projection of the within-class feature while denominator shows the redundancy in features. When CFS was used in the large-scale dataset, it produced an optimized 15 feature space of each leaf image. The optimized features are shown in . It was observed that 364800 (6400 × 57) multi-feature vector-space was reduced into 96000 (6400 × 15) feature vector-space. Finally, this low-dimensional fused multi-feature space was plugged into different machine vision classifiers. For experimental purposes, the 10-fold stratified cross-validation method was used to remove the confusion about the training/testing ratio. This validation process was then repeated 10 times, with each of the 10 subsamples used exactly once as the validation data. The results obtained were then accumulated thus producing an average single estimation. The experimental framework of citrus varieties was shown in . For evaluation purposes, the efficiency of our proposed model, some classical machine vision classifiers namely, Multilayer Perceptron (MLP), Naïve Bayes (NB), Random Forest (RF) and J48 were also tested on our proposed fused multi-featured citrus leaves dataset. It was observed that the above-mentioned classifiers produced a very low average accuracy result (less than 60%) on ROIS of size 32 × 32 and 64 × 64 respectively as compared to the experimental results produced by our proposed approach. However, the same set of classifiers with the same tuning parameters showed an average accuracy of 88% on ROIs of 128 × 128. Furthermore, on ROIs of 256 × 256, the accuracy achieved by MLP was far more promising than the other approaches since MLP was proficient in open and noisy data.[Citation43]The detail about the parameter settings for MLP used in our experimental work is given in below.
Table 2. Correlation-based Feature Selection (CFS)
Table 3. Values of the parameters of MLP used in our experimental work
Figure 4. Multi-feature data fusion framework for leaf-based citrus varieties classification
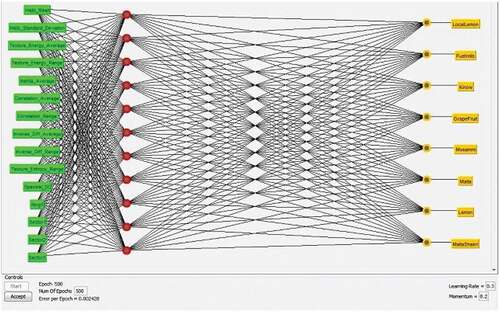
The proposed model of MLP (with all tuning parameters) used in our experimental work is shown in . In the first layer, 15 features are shown in “green” describing the input layer while the second layer (in red) showing the hidden layer with 11 neurons. The third layer with 8 “yellow” nodes depicting the weighted sum of the hidden layers, is the output layer. The tuning parameters with their values are also shown in the bottom.
Figure 5. Multi-feature data fusion framework for leaf-based citrus varieties classification
Results and discussion
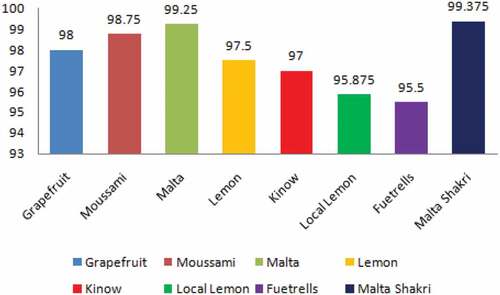
In this paper, we applied four machine vision classifiers namely, NB, RF, J48, and MLP to conduct a comparative analysis of the classification of 8 citrus plant varieties using a fused multi-feature dataset. In the first set of experiments, we used 10-fold cross-validation method. The results obtained were then compared with the results of the classifiers mentioned above. It was observed that MLP outperformed the rest of the approaches in classifying the input images. Furthermore, for the ROIs of pixel size, 32 × 32, 64 × 64 the classifiers failed to provide promising results. In the second set of experiments, we used ROI of size 128 × 128 thus achieving accuracy of 87.03%, 81.75%, 80.34% and 75.70% using the MLP, RF, J48, and NB respectively. It was clear from the results that only MLP showed better accuracy of 87.03% among the other classifiers, as shown in . The individual accuracy results of eight varieties of citrus plant namely Grapefruit, Moussami, Malta, Lemon, Kinow, Local Lemon, Fuetrells and Malta Shakri were 86.875%, 84.375%, 78.75%, 82.875%, 81.25%, 75.625%, 76.875%, and 74.375% respectively, as shown in . The confusion matrix (CM) of MLP classifier on ROIs images 128 × 128 of citrus leaves were shown in in which the diagonal values (shaded) depict the classification accuracy in respective classes, while non-diagonal values showed the misclassified instances. It is noteworthy that the total number of instances in each class was 800.In order to achieve promising results, the same set of the classifier was also applied to citrus leaf images with 256 × 256 ROI. The individual accuracy achieved by MLP, RF, J48, and NB was 98.14%, 97.51%, 91.93%, and 96.36% respectively as shown in . It was pertinent to mention that the accuracy achieved was much better than the accuracy achieved on images having 64 × 64 and 128 × 128 ROIs. The individual accuracy results of eight varieties of citrus leaf images of ROIs 256 × 256 is shown in . The average accuracy was about 91.93–98.14% with little variation. Also, the confusion matrix (CM) of MLP classifier on ROIs 256 × 256 was shown in . The diagonal values (shaded) depict the classification accuracy in respective classes, while other values depict the misclassified data items. The proposed model was better when compared to the literature cited in.[Citation7,Citation9–Citation14,Citation17,Citation18] As mentioned in[Citation25], only CNN showed better accuracy results in the Swedish Leaf dataset but the execution time was more as compared to the proposed LOFF model, while the two dataset myDAUN and Flavia showed relatively less accuracy. So, our proposed model is comparable and found better with the existing state of art techniques.
Table 4. The overall accuracy of machine learning classifiers on ROIs of citrus leaves images of size (128 × 128)
Table 5. The confusion matrix showing the classification of citrus leaves images (128 × 128) using MLP
Table 6. The overall accuracy of machine learning classifiers on ROIs of citrus leaves images of size (256 × 256)
Table 7. The confusion matrix showing the classification of citrus leaves images (256 × 256) using MLP
Figure 6. Accuracy results of leaf-images classification of eight citrus plants (ROI 128 × 128) using MLP
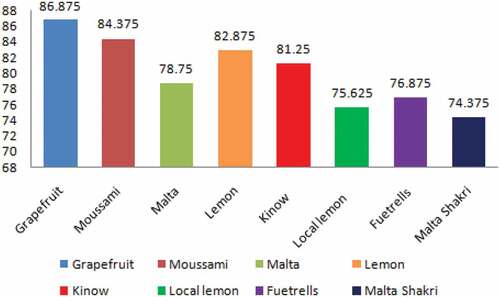
Figure 7. Accuracy results of citrus leaf-images classification of eight citrus plants (ROI 256 × 256) usingMLP
There are some factors, given below, that helped us in achieving the promising results.
Acquired the images of healthy citrus leaves.
Pre-processing steps and TCS oriented segmentation approaches helped us in reducing the outliers.
A fusion-based multi-feature dataset was developed to visualize all dimensions of the feature dataset in a principled way.
The CFS approach was found quite helpful for fusion and the optimal features set.
Finally, one of the promising features of a Multi-layer perceptron is that it gives better results on noisy and open collected environment data, most of the time.[Citation43] It is deduced from our experimental work that the fused multi-featured citrus leaf-images dataset gave better results in accuracy as compared to the existing approaches.[45] A detailed comparison of the proposed approach with existing approaches was presented in . Our proposed system has the capability to discriminate the citrus varieties based on fused features which can help the farmers, plant breeders, seed growers, and other end-users to accurately identify the best varieties. It is a robust and efficient technique to reduce human error and can be implemented on large datasets. All digital cameras have their own specific resolution. Change in camera resolution may affect the results. A modality difference may change the accuracy results. The total numbers of digital images used in this study were less. For general model testing and verification, the dataset should be comprehensive and concise enough and included more varieties as possible. We would like to encourage others in developing a public share network for horticulture or agriculture datasets where we can address the issues related to plant research in some professional and principled ways.
Table 8. Comparison of our proposed approach with existing approaches
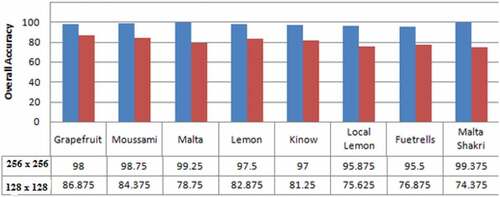
As mentioned earlier, the MLP produces proficient results in classifying the citrus leaf images of ROI 128 × 128 and 256 × 256 using a fused multi-featured dataset. The detailed analysis of results on the above mentioned ROIs is given in and . Finally, comparative analysis on citrus plants varieties classification of the multi-feature dataset using MLP classifier was shown in . This graph shows the better overall accuracy” blue color” series 1 of citrus varieties by using MLP classifier on ROIs(256 × 256) as compared to “Dark Brown” series 2 on ROIs(128 × 128). Furthermore, a comparison graph of classification accuracy of eight citrus varieties using MLP classifier on ROIs (128 × 128) and(256 × 256) have shown in .
Figure 8. Comparison analysis of accuracy achieved by MLP in classifying eight citrus leaf images having ROIs 128 × 128 and 256 × 256
Conclusion
This study focuses on the classification of eight citrus plant varieties using a novel fused multi-featured leaf dataset. For evaluation purposes, four machine vision classifiers namely MLP, RF, NB, and J48 were applied successfully using the proposed fused dataset. A different set of parameters are used in the evaluation of the data set while classifying the citrus leaves. All the classifiers provided efficient results but MLP outperformed with exceptionally promising results by achieving 98.14% accuracy on the eight citrus plant varieties. The achieve accuracy rate concludes that the proposed method is robust and can be used in real-time applications. For this study, it is pertinent to mention that in the fused multi-feature dataset, it is quite helpful to optimize the dataset dimensions using any appropriate dimensionality reduction approach in order to get the results in time. In the future, we planned to use the variation of the values in texture features with the illumination factors as an additional attribute to the same dataset. Another future contribution of this study on citrus leaf classification may lead to the identification of the citrus disease by a simple and less-economic approach, without using complex systems and expensive equipment.
Notes
1. HJYap Lab http://hjyaplab.com/project-1/.
2. Flaviahttp://flavia.sourceforge.net/.
3. Swedish Leaf Datasethttps://www.cvl.isy.liu.se/en/research/datasets/swedish-leaf/.
4. Leafsnap Datasethttp://leafsnap.com/dataset/.
References
- Ellis, B.; Daly, D. C.; Hickey, L. J.; Johnson, K. R.; Mitchell, J. D.; Wilf, P.; Wing, S. L. Manual of Leaf Architecture; Cornell University Press: Ithaca, 2009; Vol. 190.
- Miller, S. A.; Beed, F. D.; Harmon, C. L. Plant Disease Diagnostic Capabilities and Networks. Annu. Rev. Phytopathol. 2009, 47, 15–38. DOI: 10.1146/annurev-phyto-080508-081743.
- Gorinstein, S.; Caspi, A.; Libman, I.; Lerner, H. T.; Huang, D.; Leontowicz, H.; Leontowicz, M.; Tashma, Z.; Katrich, E.; Feng, S.;; et al. Red Grape Fruit Positively Influences Serum Triglyceride Level in Patients Suffering from Coronary Atherosclerosis: Studies In-vitro and in Humans. J. Agric. Food Chem. 2006, 54, 1887–1892. DOI: 10.1021/jf058171g.
- Johnson, G. Pakistan Citrus Industry Challenges: Opportunities for Australia-Pakistan Collaboration in Research, Development, and Extension; Citrus Industry Survey and Workshops: Pakistan, 2006.
- Chaudhary, P.; Chaudhari, A. K.; Cheeran, A.; Godara, S. Color Transform Based Approach for Disease Spot Detection on Plant Leaf. Int. J. Comput. Sci. Telecommun. 2012, 3, 65–70.
- Al Bashish, D.; Braik, M.; Bani-Ahmad, S. Detection and Classification of Leaf Diseases Using K-means-based Segmentation And. Inf. Technol. J. 2011, 10, 267–275. DOI: 10.3923/itj.2011.267.275.
- Babu, M. P.; Rao, B. S. Leaves Recognition Using Backpropagation Neural Network-advice for Pest and Disease Control on Crops. IndiaKisan. Net: Expert Advisory Syst. 2007.
- Kamilaris, A.; Prenafeta-Boldu, F. X. Deep Learning in Agriculture: A Survey. Comput. Electron. Agric. 2018, 147, 70–90. DOI: 10.1016/j.compag.2018.02.016.
- Hamuda, E.; Glavin, M.; Jones, E. A Survey of Image Processing Techniques for Plant Extraction and Segmentation in the Field. ComputersandElectronicsinAgriculture. 2016, 125, 184–199.
- Singh, V.; Misra, A. K. Detection of Plant Leaf Diseases Using Image Segmentation and Soft Computing Techniques. Information Process. Agric. 2017, 4, 41–49. DOI: 10.1016/j.inpa.2016.10.005.
- Wang, S.; He, D.; Li, W.; Wang, Y. Plant Leaf Disease Recognition Based on the Kernel K-means Clustering Algorithm. Nongye Jixie Xuebao = Trans. Chin. Soc. Agric. Mach. 2009, 40, 152–155.
- Wu, S. G.; Bao, F. S.; Xu, E. Y.; Wang, Y. X.; Chang, Y. F.; Xiang, Q. L. A Leaf Recognition Algorithm for Plant Classification Using A Probabilistic Neural Network. 2007 IEEE international symposium on signal processing and information technology, IEEE, Cairo, Egypt, 2007, pp 11–16.
- Shifa, M. S.; Naweed, M. S.; Omar, M.; Jhandir, M. Z.; Ahmed, T. Classification of Cotton and Sugarcane Plants on the Basis of Their Spectral Behavior. PakistanJournalofBotany. 2011, 43, 2119–2125.
- REHMANI, E.; NAWEED, M.; SHAHID, M.; QADRI, S.; ULLAH, M.; GILANI, Z. A Comparative Study of Crop Classification by Using Radiometric and Photographic Data. Sindh Univer. Res. J-SURJ (Science Series). 2015, 47.
- Kurtulmus¸, F.; Alibas¸, I.; Kavdır, I. Classification of Pepper Seeds Using Machine Vision Based on Neural Network. Int. J. Agric. Biol. Eng. 2016, 9, 51–62.
- Olgun, M.; Onarcan, A. O.; Özkan, K.; Is¸ik, S. ¸.; Sezer, O.; Özgis¸i, K.; Ayter, N. G.; Bas¸çiftçi, Z. B.; Ardiç, M.; Koyuncu, O. Wheat Grain Classification by Using Dense SIFT Features with SVM Classifier. Comput. Electron. Agric. 2016, 122, 185–190. DOI: 10.1016/j.compag.2016.01.033.
- Szczypin´ski, P. M.; Klepaczko, A.; Zapotoczny, P. Identifying Barley Varieties by Computer Vision. Comput. Electron. Agric. 2015, 110, 1–8. DOI: 10.1016/j.compag.2014.09.016.
- Patil, S. B.; Bodhe, S. K. Leaf Disease Severity Measurement Using Image Processing. Int. J. Eng. Technol. 2011, 3, 297–301.
- Pydipati, R.; Burks, T.; Lee, W. Identification of Citrus Disease Using Color Texture Features and Discriminant Analysis. Comput. Electron. Agric. 2006, 52, 49–59. DOI: 10.1016/j.compag.2006.01.004.
- Murat, M.; Chang, S. W.; Abu, A.; Yap, H. J.; Yong, K. T. Automated Classification of Tropical Shrubs Pecies: A Hybrid of Leaf Shape and Machine Learning Approach. PeerJ. 2017, 5, e3792. DOI: 10.7717/peerj.3792.
- Lee, S. H.; Chan, C. S.; Mayo, S. J.; Remagnino, P. How Deep Learning Extracts and Learns Leaf Features for Plant Classification. Pattern Recognit. 2017, 71, 1–13. DOI: 10.1016/j.patcog.2017.05.015.
- Barré, P.; Stöver, B. C.; Müller, K. F.; Steinhage, V. LeafNet: A Computer Vision System for Automatic Plant Species Identification. Ecol. Inf. 2017, 40, 50–56. DOI: 10.1016/j.ecoinf.2017.05.005.
- Kadir, A.; Nugroho, L. E.; Susanto, A.; Santosa, P. I. Neural Network Application on Foliage Plant Identification. arXiv Preprint arXiv:1311. 2013, 5829.
- Qureshi, W.; Payne, A.; Walsh, K.; Linker, R.; Cohen, O.; Dailey, M. Machine Vision for Counting Fruit on Mango Tree Canopies. Precis. Agric. 2017, 18, 224–244. DOI: 10.1007/s11119-016-9458-5.
- Tharwat, A.; Gaber, T.; Hassanien, A. E. One-dimensional Vs. Two-dimensional Based Features: Plant Identification Approach. J. Appl. Logic. 2017, 24, 15–31. DOI: 10.1016/j.jal.2016.11.021.
- Elhariri, E.; El-Bendary, N.; Hassanien, A. E. Plant Classification System Based on Leaf Features. 2014 9th International Conference on Computer Engineering & Systems (ICCES), IEEE, Cairo, Egypt, 2014, pp 271–276. doi: 10.1177/1753193414528859.
- Khan, M. A.; Lali, M. I. U.; Sharif, M.; Javed, K.; Aurangzeb, K.; Haider, S. I.; Altamrah, A. S.; Akram, T. An Optimized Method for Segmentation and Classification of Apple Diseases Based on Strong Correlation and Genetic Algorithm Based Feature Selection. IEEE Access. 2019, 7, 46261–46277. DOI: 10.1109/ACCESS.2019.2908040.
- Adeel, A.; Khan, M. A.; Sharif, M.; Azam, F.; Umer, T.; Wan, S. Diagnosis and Recognition of Grape Leaf Diseases: An Automated System Based on a Novel Saliency Approach and Canonical Correlation Analysis Based Multiple Features Fusion. Sustainable Comput. 2019, 24.
- Khan, M. A.; Akram, T.; Sharif, M.; Awais, M.; Javed, K.; Ali, H.; Saba, T. CCDF: Automatic System for Segmentation and Recognition of Fruit Crops Diseases Based on Correlation Coefficient and Deep CNN Features. Comput. Electron. Agric. 2018, 155, 220–236. DOI: 10.1016/j.compag.2018.10.013.
- Iqbal, Z.; Khan, M. A.; Sharif, M.; Shah, J. H.; Ur Rehman, M. H.; Javed, K. An Automated Detection and Classification of Citrus Plant Diseases Using Image Processing Techniques: A Review. Comput. Electron. Agric. 2018, 153, 12–32. DOI: 10.1016/j.compag.2018.07.032.
- Rauf, H. T.; Saleem, B. A.; Lali, M. I. U.; Khan, M. A.; Sharif, M.; Bukhari, S. A. C. A Citrus Fruits and Leaves Dataset for Detection and Classification of Citrus Diseases through Machine Learning. Data Brief. 2019, 26, 104340. DOI: 10.1016/j.dib.2019.104340.
- Khodabakhshian, R.; Emadi, B.; Khojastehpour, M.; Golzarian, M. R.; Sazgarnia, A. Non-destructive Evaluation of Maturity and Quality Parameters of Pomegranate Fruit by Visible/near Infrared Spectroscopy. Int. J. Food Prop. 2017, 20, 41–52. DOI: 10.1080/10942912.2015.1126725.
- Azizi, A.; Abbaspour-Gilandeh, Y.; Nooshyar, M.; Afkari-Sayah, A. Identifying Potato Varieties Using Machine Vision and Artificial Neural Networks. Int. J. Food Prop. 2016, 19, 618–635. DOI: 10.1080/10942912.2015.1038834.
- Suphamitmongkol, W.; Nie, G.; Liu, R.; Kasemsumran, S.; Shi, Y. An Alternative Approach for the Classification of Orange Varieties Based on near Infrared Spectroscopy. Comput. Electron. Agric. 2013, 91, 87–93. DOI: 10.1016/j.compag.2012.11.014.
- Qadri, S.; Khan, D.; Ahmad, F.; Qadri, S.; Rehman, M. U.; Muhammad, S.; Ullah, M. A Novel Optimized Land Cover Classification Framework Using Data Mining Techniques. Sindh Univer. Res. J-SURJ (Science Series). 2017, 49.
- Qadri, S.; Khan, D. M.; Ahmad, F.; Qadri, S. F.; Babar, M. E.; Shahid, M.; Ul-Rehman, M.; Razzaq, A.; Shah Muhammad, S.; Fahad, M.; et al. A Comparative Study of Land Cover Classification by Using Multispectral and Texture Data. Biomed Res. Int. 2016, 2016.
- Qadri, S.; Khan, D. M.; Qadri, S. F.; Razzaq, A.; Ahmad, N.; Jamil, M.; Nawaz Shah, A.; Shah Muhammad, S.; Saleem, K.; Awan, S. A. Multi Source Data Fusion Framework for Land Use/land Cover Classification Using Machine Vision. J. Sens. 2017, 2017.
- Eklund, A.; Dufort, P.; Forsberg, D.; LaConte, S. M. Medical Image Processing on the GPU–Past, Present and Future. Med. Image Anal. 2013, 17, 1073–1094. DOI: 10.1016/j.media.2013.05.008.
- Strzelecki, M.; Szczypinski, P.; Materka, A.; Klepaczko, A. Classification and Segmentation of 2D/3D Medical Images. Nucl. Instrum. Methods Phys. Res. Section A. 2013, 702, 137–140. DOI: 10.1016/j.nima.2012.09.006.
- Ewers, M.; Walsh, C.; Trojanowski, J. Q.; Shaw, L. M.; Petersen, R. C.; Jack, C. R., Jr; Feldman, H. H.; Bokde, A. L.; Alexander, G. E.; Scheltens, P.; et al. Prediction of Conversion from Mild Cognitive Impairment to Alzheimer’s Disease Dementia Based upon Biomarkers and Neuropsychological Test Performance. Neurobiol. Aging. 2012, 33, 1203–1214. DOI: 10.1016/j.neurobiolaging.2010.10.019.
- Malik, F.; Farhan, S.; Fahiem, M. A. An Ensemble of Classifiers Based Approach for Prediction of Alzheimer’s Disease Using fMRI Images Based on Fusion of Volumetric, Textural and Hemodynamic Features. Adv. Electr. Comput. Eng. 2018, 18, 61–71. DOI: 10.4316/aece.
- Siddique, M. I.; Garnevska, E. Citrus Value Chain (S): A Survey of Pakistan Citrus Industry. Agric. Value Chain. 2018, 37.
- Rodrigues, S. A. M.;. Motivations, Experiences and Potential Impacts of Visitors to A Monastery in New Zealand: A Case Study; New Zealand: University of Waikato, 2012.
- Park, S. C.; Pu, J.; Zheng, B. Improving Performance of Computer-aided Detection Scheme by Combining Results from Two Machine Learning Classifiers. Acad. Radiol. 2009, 16, 266–274. DOI: 10.1016/j.acra.2008.08.012.