
 ?Mathematical formulae have been encoded as MathML and are displayed in this HTML version using MathJax in order to improve their display. Uncheck the box to turn MathJax off. This feature requires Javascript. Click on a formula to zoom.
ABSTRACT
The glycemic indices (GI) of pea and chickpea are normally lower than 60, which are commonly considered as middle or low GI foods. Different processing conditions would influence proportions of rapidly digestible starch (RDS), slowly digestible starch (SDS), and resistant starch (RS) in the processed pea and chickpea. In general, high-temperature cooking followed by high-temperature drying (HCHD) largely kept total starch (68.58% and 61.99% of dry matter in pea and chickpea, respectively), increased RDS (29.89% and 33.40% of total starch in pea and chickpea, respectively) and RS proportions (25.78% and 17.08% of total starch in pea and chickpea, respectively) while the opposite effect in pea and chickpea was observed. Glycemic response of panelists after consuming HCHD pea or chickpea would cause a faster increase of incremental plasma glucose concentration within 30 min, followed by a rapid decrease to baseline compared with the pea or chickpea processed by low-temperature cooking followed by low-temperature drying (LCLD). The GI of HCHD pea and chickpea were 59.02 and 49.15, respectively, which were significantly higher than those processed by LCLD (pea: 32.63, chickpea: 31.91). Both in vitro and in vivo digestibility indicated that LCLD was more suitable to process pea and chickpea powder.
Introduction
Pea is an annual climbing herb of Leguminosae, mainly distributed in Asia and Europe, Mediterranean and Central Asia. Peas have been cultivated in many countries as treated as a type of both human food and animal feed. The cultivated peas are normally classified as Pisum sativum ssp. hortense (aka. garden peas), Pisum sativum ssp. arvense (aka. field peas), and Cicer arietinum L. (aka. chickpeas). The cultivated pea has ranked the fourth regarding the production of food legumes in the world, which is only after soybeans, peanuts, and dry beans.[Citation1] The yield of pure starch of field pea was normally in a range of 35–40%.[Citation2] Pea proteins are composed of albumins and globulins, and the curd pea protein coverall ranged from 20.2% to 26.7%.[Citation3] In addition, the common bean diet had the high content of dietary fiber (17.0 ± 0.2 g/100 g).[Citation4] Therefore, the cultivated pea is regarded as a good source of human food because of high content of starch, protein, and dietary fiber. Among these contents, pea starch has drawn much attention due to high percentage of resistant starch (RS) and slowly digestible starch (SDS).
Rapidly digestible starch (RDS) is defined as that is digested within 20 min based on the rate of hydrolysis; the SDS refers to digested starch between 20 and 120 min, and RS is undigested starch after 120 min.[Citation5] Compared with rapidly digestible starch (RDS), the SDS has an advantage on slowing increase of postprandial blood glucose levels, and subsequently maintaining blood glucose levels over a long period.[Citation6] Therefore, routinely consuming food products with the high content of RS and SDS would assist in controlling cardiovascular diseases and noninsulin-dependent diabetes, and furthermore provide some therapeutic effects on these diseases.[Citation7] The total starch in pea seeds is normally reaching from 55% to 70%, and more than 60% of starch belongs to either RS or SDS. Therefore, the glycemic index (GI) of pea starch becomes much lower compared with the most of grains due to the high content of RS and SDS. As a good replacement of wheat starch, the pea starch has been utilized in the food industry due to its high amylose level; and the physicochemical properties of the starches are significantly influenced by the amylose content, microstructure, and particle size.[Citation8] For example, Pietrasik and Janz[Citation9] developed a low fat bologna with the addition of pea flour instead of wheat starch without compromising consumer acceptability. A novel pea starch noodle was developed with an increase of yellowness color, dough moisture, expansion ratio, and the percentage of RS in particular; meanwhile, the cooking loss was reduced compared with conventional noodles.[Citation10] It is noticeable that different processing conditions would give a significant impact on physical property changes of pea starch and lead to the change of pea starch digestibility after processing. de Almeida Costa, da Silva Queiroz-Monici, Pissini Machado Reis, and de Oliveira[Citation11] reported a cooking loss of RS and SDS in pea and chickpea, which is around 33% and 66%, respectively, compared with the unprocessed one. In a study targeting on the effects of different processing procedures, i.e. cooking, soaking, soaking-cooking, and canning on common beans (Phaseolus vulgaris L.), Kutoš, Golob, Kač, and Plestenjak[Citation12] indicated that the RS content would be significantly increased after soaking and cooking procedures; however, the total insoluble fiber content was significantly decreased as a consequence of thermal processing. Thermal processing would also decrease the antinutrients in chickpeas, such as tannin (33.1–47.5%) and phytic acid (28.0–51.6%); but in turn, increase the digestibility of protein (95.7–105%) and starch (117–138%) in chickpeas after 10-min cooking at 121°C.[Citation13] Peas and chickpeas are normally cooked either by a pressure cooker or a simple nonpressurized cooking. Different types of drying (for drying) would be also utilized in the food industry to process pea and chickpea powder. The structure of starches has always been an important focus for food research and processing technologists. For example, the chain length distributions had a significant effect on the digestion properties of waxy corn starches.[Citation14] Zhang, Zhang, Xu, Li, and Tan[Citation15] conducted a detailed study on revealing structural characterization of starches from Chinese jackfruit seeds. Therefore, evaluating different processing conditions on the influence of pea and chickpea starch is of important in the food industry.
The test of digestion in vitro may be only partially reflected the real scenario and failed to detect the effect of differences in gastric emptying; meanwhile, the effects of viscosity on absorption rate of digested products were unable to determine through the in vitro digestion. The digestion in vivo is much more recommended to study the digestion of carbohydrates in foods.[Citation16] Therefore, the present study was undertaken to reveal the digestibility of pea and chicken pea starch through in vitro and in vivo digestibility after combining the two processing procedures, i.e. high-temperature cooking followed by HCHD and low-temperature cooking followed by LCLD.
Materials and methods
Materials
The origin of peas was Canada, which were imported by Geliang Co., Ltd. (China). The chickpeas (Desi, China) were the production in Xinjiang Province, China. The α-amylase from porcine pancreas and amyloslucosidase from Aspergillus niger was obtained from Sigma-Aldrich (US). All chemicals were purchased from Sinopharm Co., Ltd. (China), including D-glucose, 3,5-dinitrosalicylic acid, NaOH, HCl, methanol, and ethanol.
Combined cooking and drying of pea and chickpea
Combined cooking and drying were adopted to process pea and chickpea, and the experimental design is shown in . Briefly, either 50 g of dried pea or chickpea were soaked overnight and peeled off the skin and hypocotyl, followed by adding water (300 mL) and cooking for 3 h at three temperature levels, i.e. 100°C, 110°C, and 121°C, respectively. The cooked pea and chickpea were subsequently stirred for 10 min and separated cooked water and solids by filtration. The solids cooked at 100°C were then transferred to an electric oven for a further low-temperature-long time drying at 60°C for 12, 13, and 14 h, respectively. For the solids cooked at 121°C were, they were transferred to an electric oven for a high-temperature-short time drying at 160°C for 2.0, 2.5, and 3.0 h, respectively. All the drying procedures achieved adequately dried of pea or chickpea powder. All cooked samples and combined cooking and drying samples were subjected to evaluate in vitro digestibility. The HCHD-processed pea and chickpea were obtained by cooking them at 121°C for 3 h followed by drying at 160°C for 3 h, and the LCLD-processed pea and chickpea were obtained by cooking the raw materials at 100°C for 3 h followed by drying at 60°C for 12 h. Both HCHD- and LCLD-processed pea and chickpea were subjected to evaluate their in vitro and in vivo digestibility.
Figure 1. Flow chart of experimental design.
Amylose and amylopectin
Amylose and amylopectin contents in the processed pea and chickpea were analyzed by using amyloglucosidase/α-amylase assay kit (Bray Business Park Bray,Co., Wicklow, Ireland) and followed according to the recommendation of the manufacturer. The amylose/amylopectin ratio was calculated accordingly.
Rapid digested starch, slow digested starch, and resistant starch content through in vitro digestion
The determination of RDS, SDS, and RS was followed by Englyst, Kingman, and Cummings[Citation5] with slight modifications. Briefly, the processed pea and chickpea powder was subjected to be digested at pH of 5.2 at 37°C by two enzymes, i.e. α-amylase (from porcine pancreas, 700–1400 units mg−1 protein, Sigma-Aldrich, US), and amyloslucosidase (from Aspergillus niger, ≥40 units mg−1 protein, Sigma-Aldrich, US). The glucose content of supernatant was measured at 0, 20, and 120 min, respectively. The proportions of RDS, SDS, and RS were determined based on EquationEqs. (1(1)
(1) )–(Equation4
(4)
(4) ) as follows:
where G0 min, G20 min, and G120 min refer to the glucose level in the supernatants collected at 0, 20, and 120 min, respectively. The G∞ was quantified when the starch was completely hydrolyzed into glucose by the enzymes. The amount of reducing sugar during the in vitro digestibility was quantified based on 3,5-dinitrosalicylic acid (DNS) method as described in Miller.[Citation17] In brief, equal volume of DNS reagent and the supernatants were transferred to a reaction tube and mixed vigorously, followed by cooking in water for 15 min to develop a red-brown color. After cooling down to the room temperature, the samples were subjected to measure the absorbance at 575 nm by using a UV-Vis spectrophotometer (UV-1280, Shimadzu, Japan). The reducing sugar concentration was calculated based on a glucose calibration curve of y = 0.5935 x + 0.0124 with R2 = 0.9987, where y refers to the absorbance at 575 nm and x represents the concentration of glucose in mg mL−1.
In vivo glycemic response
This study of in vivo digestibility was under supervision of the Ethic Committee in School of Biology, Food and Environment, Hefei University. The committee has approved protocol of in vivo study. All methods were performed in accordance with the relevant guidelines and regulations. Written informed consent was obtained from all study participants. All the procedure, indications, and preparation were properly explained, and all participants indicated their understanding and obtained written informed consent.
Subjects
About 10 panelists, including five of males and five of females, were recruited with the age ranging from 21 to 24 in Hefei, Anhui province, China. The body mass indices (BMIs) of the panelists were in a range of 18.26–22.04 kg m−2. All the panelists were in healthy condition without habit of smoking and family history of chronic diseases. The overall experimental design was followed by Johnson, Thomas, and Hall[Citation18] with modifications.
Test foods
Five of test foods were prepared as follows: HCHD- and LCLD-processed pea and chickpea as described in section “ Combined cooking and drying of pea and chickpea”. The glucose powder (Food grade, Jiangnuo, Shantou, China) was also prepared.
Study protocol
All tests were started at 8:00 am, and all the panelists were fasted for 10 h before the tests. On the first experimental day, the panelists were asked to consume 50 g of glucose powder with water (200 mL) in 10–15 min. Capillary blood samples from panelists’ fingers were taken before consuming any food as well as 30, 60, 90, and 120 min after taking the test food. The blood samples were transferred to a test tip, and subsequently analyzed by a blood glucose tester (Accu-chek, Performa Connect, Roche Diagnostics Co., US). The next in vivo study was conducted after 48 h. The 50 g of HCHD- and LCLD-processed pea or chickpea powder were prepared as test foods, and consumed by the panelists on the third, fifth, seventh, and ninth experimental day, respectively. All the test procedures were the same as those conducted on the first experimental day.
Glycemic index (GI)
The GI was calculated as described in Goñi and Valentı́n-Gamazo.[Citation19] In brief, the total blood glucose level of the test food was calculated based on integral of above area between baseline and the blood glucose response curve. The incremental blood glucose area was in relation to the corresponding area obtained after consuming glucose powder as the reference food.
Statistical analysis
In study, all experiments were conducted in triplicates except for the in vivo study. For detecting significant difference (p < 0.05), all the data were subject to the analysis of variance (ANOVA) in the SPSS statistical software (V24.0, IBM, US) with Duncan’s new multiple range test.
Results and discussion
Effects of cooking temperature on digestibility of pea and chickpea slush through in vitro study
In order to simulate cooking procedure and further reveal effects of processing temperature on digestibility of pea and chickpea, three temperature levels were chosen to boil pea and chickpea in water for 3.0 h. The pea and chickpea slushes were guaranteed to be fully cooked under the three temperature levels. The proportions of RS, SDS, and RDS in pea and chickpea were determined by the method of Englyst, Kingman, and Cummings,[Citation5] as shown in and , respectively. The content of RDS was increased with the increased cooking temperature, and the proportion of RDS detected in pea (15.02 ± 1.30%) and chickpea (16.80 ± 1.15%) reached to the highest level at 121°C among the three temperature levels. However, a significant decrease of RS content was observed with the increased of cooking temperatures, and the lowest content of RS was detected in pea (12.10 ± 2.76%) and chickpea (9.82 ± 0.86%) at 121°C. There was no significant difference on the SDS content in the pea and chickpea slushes that processed under the three temperature levels except for a significantly low SDS content of processed pea slush at 100°C was observed in the pea, and no significant difference of SDS content was detected at the rest of four temperature levels. The content of RS increased while RDS content decreased with an increase of temperature.
Figure 2. Effects of temperature after 3.0-h processing in water on the content of RDS, SDS, and RS in pea (a) and chickpea (b).
Results of Pearson correlation study are shown in . The cooking temperature and the content of RS showed a significantly negative correlation (−0.91 and −0.96 for pea and chickpea, respectively); a positive correlation between the processing temperature and the content of either RDS or RS was observed in the pea and chickpea. A previous study on evaluating different processing methods on starch digestibility in plantain (Musa paradisiaca L.) flour also supports our findings: RDS content in the plantain flour after autoclaved processing (121°C, 60 min) was 19.1 g/100 g, which was significantly higher than the plantain flour after a 2-h-parboiled processing (5.35 g/100 g) at 60°C. Similarly, the content of SDS in the autoclaved sample was 39.9 g/100 g that was 1.3 times higher than the plantain flour after the parboiled processing (17.1 g/100 g).[Citation20]
Table 1. Pearson correlation study on revealing relationship of processing temperature and duration of drying at 160°C and 60°C as well as content of RDS, SDS, and RS in pea and chickpea.
Combined effects of cooking and drying on digestibility of pea and chickpea powder through in vitro study
Drying is another critical step for obtaining pea and chickpea powder in the food industry. In this study, two common methods were used in this study, such as low-temperature-long time drying and high-temperature-short time drying. For further evaluating the combined effect of high-temperature cooking followed by high-temperature-short time drying, the pea and chickpea powder were prepared after 3 h cooking in water at 121°C, and then dried them at 160°C for 2.0, 2.5, and 3.0 h, respectively. The pea and chickpea powders were adequately dried under the drying conditions. As shown in and , the overall trends for the changes of pea and chickpea starch include a significant increase of RDS and RS content, and meanwhile, a significant decrease of SDS content in the pea and chickpea powder with the extended drying duration at 160°C. After the drying at 160°C for 3 h, it particularly obtained the highest proportion of RDS (29.89 ± 1.03% and 33.40 ± 2.67%) and RS (44.33 ± 1.90% and 49.52 ± 1.81%) as well as the lowest proportion of SDS (25.78 ± 1.27% and 17.08 ± 0.30%) in the processed pea and chickpea, respectively.
Figure 3. Effects of duration of 160°C drying on the content of RDS, SDS, and RS in pea (a) and chickpea (b); and effects of duration of 60°C drying on the content of RDS, SDS, and RS in pea (c) and chickpea (d).
The low-temperature-long time drying is also widely used in the food industry. A further investigation was conducted to determine the content of RDS, SDS, and RS in the pea and chickpea powders that were prepared at 100°C after 3 h cooking in water, and then dried them at 60°C for 12, 14, and 16 h, respectively. The pea and chickpea powders were adequately dried under the drying conditions. As shown in for the dried pea powder, there was no significant difference among the proportion of SDS and RS with the extended of drying time from 12 to 14 h; furthermore, 15.13% increase in the RDS content was observed after the 14 h drying compared with the 12-h drying of pea powder. Moreover, the similar trend was observed for the dried chickpea powder as shown in . The proportions of RDS and RS were increased from 12.71% to 17.03%, and 10.95% to 18.20% with increase of drying time from 12 to 14 h, respectively; the content of SDS was decreased in 11.57% when the drying time was extended for 4 h. Compared with the high-temperature-short time drying, the extent of three types of starch conversion was not significantly promoted when drying temperature was maintained at 60°C. This phenomenon indicates that the processing temperature and duration of heat treatment is a dominant influence factor the digestibility of starch.
A previous study on the determination of RS content in baking bread at different temperature level showed that the RS content of bread crumb drying at a central temperature of 98°C was determined to be 1.0 mg/dry matter, which was significantly higher than that baking at central temperatures of 83°C (0.8 mg/dry matter) and 29°C (0.3 mg/dry matter).[Citation21] Due to a low water concentration during drying process, the increase of glucose-based fiber was more pronounced with the increased treatment time. It may be attributed to degradation or chemical modification of oligosaccharides containing 1,6-anhydroglucose end unites. Another study on reporting effects of baking time on digestibility of water-soaked Indian legumes also supported our finding: with the extended baking time from 30 to 180 min, the content of digestible starch in the moth bean as an India legume was kept increasing from 19.55 ± 2.19 at 30 min to 38.18 ± 3.43 at 180 min.[Citation22] Starch in raw foods is barely digestible, therefore, in order to increases the digestibility of foods, we make the starch gelatinization. In this study, it is understandable that the RDS content of pea or chickpea was always increased with the extended duration of drying.[Citation23]
Effects of HCHD and LCLD processing on digestibility of pea and chickpea powder through in vitro study
According to industrial practice for processing pea and chickpea powder, two methods were adopted to process pea and chickpea, and subsequently evaluated digestibility of the processed pea and chickpea powder through in vitro study. The total starch content and proportions of RDS, SDS, and RS in pea and chickpea after either HCHD or LCLD processing are shown in . The amylose/amylopectin ratio of raw pea and chickpea was determined to be 0.36 ± 0.05 and 0.50 ± 0.04, respectively. In general, the processed chickpea in this study contained about 60% of total starch, which was about 6–8% lower than the total starch of pea; these results are also in accordance with previous study.[Citation11] For the pea after the two processing conditions, the total starch in HCHD group was 68.58% ± 1.02%, which was significantly higher than the total starch in LCLD group (65.86% ± 0.85%). The similar trend was observed in chickpea after the two processing methods, which were 61.99% ± 1.04% and 60.11% ± 0.38% for the HCHD- and LCLD-processed chickpea, respectively.
Table 2. Amylose/amylopectin ratio of raw pea and chickpea, as well as total starch and content of RDS, SDS, and RS in pea and chickpea before and after HCHD and LCLD processing.
Looking at the proportion of RS in pea and chickpea after the two processing, the proportion of RS in the pea (25.78% ± 1.27%) and chickpea (17.08% ± 1.40%) powder after HCHD processing was significantly higher than that after LCLD processing (pea: 18.98% ± 2.85%; chickpea: 10.95% ± 0.50%). The higher proportion of RS determined in the HCHD-processed pea and chickpea may due to amylose retrogradation converted more starch to the RS.[Citation24,Citation25] Escarpa, González, Mañas, García-Diz, and Saura-Calixto[Citation26] reported that RS was formatted by high-pressure autoclave process, and concluded that the yield of RS obtained by high-pressure autoclave process was significantly higher than that obtained by cooking in water at 100°C as a gelatinization procedure.
When the comparison was made on the proportion of SDS, a significantly lower proportion of SDS was observed in both pea (44.33% ± 1.90%) and chickpea (49.52% ± 2.77%) powder after HCHD processing compared with those after LCLD processing (pea: 64.50% ± 4.12%; chickpea: 76.34% ± 4.20%). However, the proportion of RDS was significantly higher in both pea (29.89% ± 1.03%) and chickpea (33.40% ± 2.06%) powder after HCHD processing compared with that after LCLD processing (pea: 16.52% ± 2.13%; chickpea: 12.71% ± 1.54%). Another study on different processing conditions on RDS and SDS proportion in potato has also reported a similar finding. In raw potato, less than 5% of RDS and SDS were present; however, cooking would result in a significant conversion to RDS, followed by a post-cooking cold treatment that further transferred RDS to SDS.[Citation27]
Although the results of in vitro digestion have clearly indicated the proportion of different starch, it is still very hard to argue at this stage which processed products would be beneficial on human body in terms of achieving a better control of glucose level after consuming the processed pea or chickpea. As reported by Brand-Miller and Holt,[Citation16] it is recommended to test GI of foods in vivo instead of in vitro estimation in order to consider the differences in gastric emptying and the effect of viscosity on rate of absorption of digested foods.
Effects of HCHD and LCLD processing on digestibility of pea and chickpea powder through in vivo study
Pea and chickpea are normally considered as low GI foods which would improve tolerance of glucose in both healthy and diabetic subjects.[Citation18] In this section, the two processed pea and chickpea powder were consumed by healthy panelists for testing glycemic response of human body and determining GIs of them.
Glycemic response
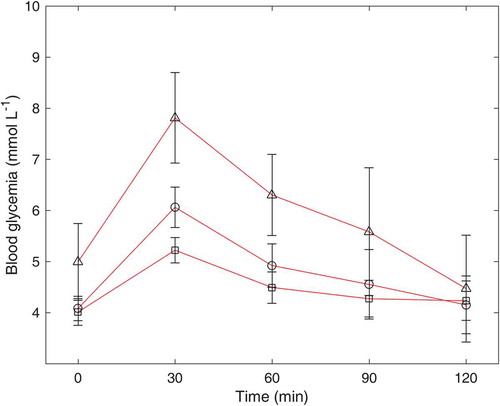
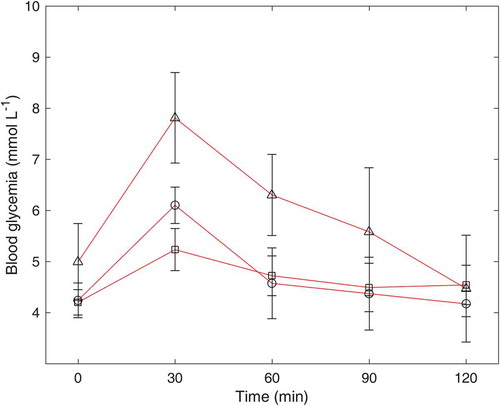
The incremental glycemic responses to the pea powder after HCHD and LCLD processing are shown in . Incremental plasma glucose concentration reached to its peak at 30 min after consuming the provided food, and subsequently fell down until 120 min. At 30 min, the concentration of incremental plasma glucose for pea after HCHD processing (6.06 ± 0.12 mmol L−1) was significantly higher than the incremental plasma glucose of pea after LCLD processing (5.22 ± 0.25 mmol L−1). This phenomenon is mainly attributed to a significantly higher content of RDS in the HCHD-processed pea powder (29.89%) than the RDS content in LCLD-processed pea powder (16.52%) as reported by in vitro study. Due to high content of SDS and RS in both HCHD- and LCLD-processed pea powder, the decrease of incremental plasma glucose concentration from 60 to 120 min was only 0.77 and 0.26 mmol L−1, respectively.
Figure 4. Blood glucose response to 50 g of glucose powder (Δ), HCHD-processed pea (○), and LCLD-processed pea (□) in healthy subjects (n = 10).
The incremental glycemic responses to the chickpea powder after HCHD and LCLD processing are shown in . The similar trend was observed which the peak value was reached at 30 min after consuming the HCHD- (6.10 ± 0.36 mmol L−1) and LCLD- (5.23 ± 0.41 mmol L−1) processed chickpea powder. The decrease of incremental plasma glucose concentration from 30 to 60 min after consuming HCHD chickpea powder (1.14 mmol L−1) was faster than the incremental plasma glucose concentration of LCLD one (0.51 mmol L−1), which may be attributed to the higher content of RDS in the HCHD chickpea powder. After 60 min, the incremental plasma glucose concentration of HCHD chickpea powder kept at a relatively lower level, but still slightly decreased from 60 to 120 min (from 4.92 to 4.15 mmol L−1). However, the incremental plasma glucose concentration was remained unchanged after 60 min in the LCLD group.
Figure 5. Blood glucose response to 50 g of glucose powder (Δ), HCHD-processed chickpea (○), and LCLD-processed chickpea (□) in healthy subjects (n = 10).
Overall, the peak values of glycemic response curve of pea and chickpea were always significantly lower than those after consuming glucose powder. After 60 min, the incremental plasma glucose concentration was almost decreased to the based level after consuming pea or chickpea powder; compared with the glucose as the reference, it would take 120 min to decrease to the baseline. It is again proved the benefit of consuming pea or chickpea that would not cause a significant increase of incremental plasma glucose concentration and swiftly fall down to the based level.
Glycemic index
The GIs of the two processed pea and chickpea are shown in . In this study, 5 male and 5 female panelists were chosen with the similar BMI and age; therefore, the gender was taken into consideration when calculated the GIs of the four foods. Although the GIs for four foods consumed by the male panelists were slightly higher than those consumed by the female panelists, there was no significant difference between the two groups. Therefore, the gender of panelists would not give an impact on calculating GI with the similar BMI and age of panelists.
Table 3. In vivo digestibility parameters, including number, age, and BMI of panelists; and GI of the four processed pea and chickpea.
Normally, the GI was divided into three groups: low GI with the value equal or less than 55, medium GI with the range from 56 to 69, and high GI with the value equal or higher than 70.[Citation28] The pea processed by HCHD had a significantly higher GI (59.02 ± 12.63) compared with those processed by LCLD (32.63 ± 10.56). The similar trend was observed in the processed chickpea, which the HCHD-processed chickpea powder (49.15 ± 17.52) had a significantly higher GI compared with that processed by LCLD (31.91 ± 12.22). In addition, there was no significant difference of GI between pea and chickpea after the same processing method. Results indicate that the LCLD-processed pea and chickpea powder as well as HCHD-processed chickpea powder can be regarded as low GI foods; however, HCHD-processed pea powder can be only considered as a medium GI food.
In vitro digestibility of starch and in vivo glycemic response results were in agreement, which showed the same ranking for the four processed samples. HCHD-processed pea had the highest glycemic response, followed by HCHD-processed chickpea, LCLD-processed pea and chickpea. Results indicated that the RDS had a predominantly impact on the glycemic response where the proportions of RDS in the HCHD-processed pea and chickpea were significantly higher than those in the LCLD-processed pea and chickpea. The Pearson correlation coefficients among digestibility properties of the pea and chickpea prepared by HCHD and LCLD are shown in . RDS showed a significant positive correlation (p < 0.05) for both GI of pea (HCHD: 0.94, LCLD: 0.93) and chickpea (HCHD: 0.93, LCLD: 0.93). Similarly, the SDS showed a significant positive correlation (p < 0.05) for both GI of pea (HCHD: 0.91, LCLD: 0.90) and chickpea (HCHD: 0.91, LCLD: 0.91). The RS, however, was relatively too slow to trigger the increase of incremental plasma glucose concentration, and a significantly negative correlation was obtained between RS content and GI of pea (HCHD: −0.98, LCLD: −0.97) and chick pea (HCHD: −0.98, LCLD: −0.98). A previous study on conducting correlation analysis of digestibility properties of extrusion-modified jackfruit seed starch also obtained the similar trends, which the RDS and SDS showed a significantly positive correlation, and the RS showed a significantly negative correlation to its GI value.[Citation29]
Table 4. Pearson correlation coefficients among digestibility properties of the pea and chickpea prepared by HCHD and LCLD.
It is reported that a modest increase of incremental plasma glucose concentration is also helpful on reducing the long-term risk of developing type II diabetes.[Citation30] In addition, an increased level of blood glucose is associated with the development of cardiovascular diseases.[Citation31] The relatively low GIs indicated their benefit on consuming pea and chickpea as good replacements of other food ingredients with high GIs, such as rice, white bread, etc. Giuberti, Gallo, Cerioli, Fortunati, and Masoero[Citation32] developed a gluten-free pasta with up to 40% w/w of bean flour, and reported an increased content of RS with significantly low GI compared with the conventional one. With the development of food products containing pea or chickpea, it would be helpful on broadening the range of low GI foods, for instant pasta, bread, etc. Results of this study have revealed the effects of processing conditions on digestibility of pea and chickpea, which the LCLD processing is recommended as a guidance to produce the healthier pea and chickpea products in the food industry or daily cooking in normal families; meanwhile, innovative processing methods are also recommended to be developed for producing pea and chickpea products as low GI foods.[Citation33]
Conclusion
This study firstly demonstrated that the different processing conditions, i.e. HCHD and LCLD, resulted in different in vitro and in vivo digestibility of pea and chickpea. The contents of RS in HCHD-processed pea and chickpea were significantly higher but the proportions of RDS and SDS was lower than those in LCLD-processed chickpea. It may be attributed to the HP processing that would trigger the amylose retrogradation that converted more to the RS during HCHD processing. The glycemic response also supported the findings, which the peak of incremental plasma glucose concentration at 30 min after consuming HCHD-processed pea and chickpea were significantly higher than those processed by LCLD. Among the four processed foods, only HCHD-processed pea was determined to be the medium GI food, and the rest were classified as the low GI foods. This finding could become a guidance on how to process or cook the raw pea and chickpea in order to get the final product with lowered GI in the food industry or normal families.
Acknowledgments
This work described in this article was supported by Provincial Quality Engineering Project of Colleges and Universities (2017jyxm1179), Hefei University Bioengineering Specialty Major (2018hfppzy04), Science and Technology Major Project in Anhui Province (17030701015), Education and Training Plan for Bioengineering Outstanding Engineers (2018zygc039), and Research on Construction Standards of Bioengineering Modular Speciality (2018jyxm). The authors would also like to thank Dr. Hang Yu for his kind assistances during the preparation of manuscript. Authors declare no competing interests that include financial and nonfinancial interests. Study concept and design: Z. Yu. Data analysis: Z. Yu, X. Wang, and M. Xia. Wrote the manuscript: Z. Yu, Y. Cai; study supervision: Z. Yu.
Additional information
Funding
References
- Ratnayake, W. S.; Hoover, R.; Warkentin, T. Pea Starch: Composition, Structure and Properties—a Review. Starch‐Stärke. 2002, 54, 217–234.
- Ratnayake, W. S.; Hoover, R.; Warkentin, T. Pea Starch: Composition, Structure and Properties — A Review. Starch - Stärke. 2002, 54(6), 217–234. DOI: 10.1002/1521-379X(200206)54:6<217::AID-STAR217>3.0.CO;2-R.
- Wang, N.; Daun, J. K. Effect of Variety and Crude Protein Content on Nutrients and Certain Antinutrients in Field peas(Pisum Sativum). J. Sci. Food Agric. 2004, 84(9), 1021–1029. DOI: 10.1002/jsfa.1742.
- Queiroz-Monici, K. D. S.; Costa, G. E. A.; da Silva, N.; Reis, S. M. P. M.; de Oliveira, A. C. Bifidogenic Effect of Dietary Fiber and Resistant Starch from Leguminous on the Intestinal Microbiota of Rats. Nutrition. 2005, 21(5), 602–608. DOI: 10.1016/j.nut.2004.09.019.
- Englyst, H. N.; Kingman, S.; Cummings, J. Classification and Measurement of Nutritionally Important Starch Fractions. Eur. J. Clin. Nutr. 1992, 46, S33–50.
- Lehmann, U.; Robin, F. Slowly Digestible Starch–its Structure and Health Implications: A Review. Trends Food Sci. Technol. 2007, 18, 346–355. DOI: 10.1016/j.tifs.2007.02.009.
- Yao, W.; Liu, C.; Xi, X.; Wang, H. Impact of Process Conditions on Digestibility of Pea Starch. Int. J. Food Prop. 2010, 13(6), 1355–1363. DOI: 10.1080/10942910903177368.
- Zhang, Y.; Zhu, K.; He, S.; Tan, L.; Kong, X. Characterizations of High Purity Starches Isolated from Five Different Jackfruit Cultivars. Food Hydrocolloids. 2016, 52, 785–794. DOI: 10.1016/j.foodhyd.2015.07.037.
- Pietrasik, Z.; Janz, J. A. M. Utilization of Pea Flour, Starch-rich and Fiber-rich Fractions in Low Fat Bologna. Food Res. Int. 2010, 43(2), 602–608. DOI: 10.1016/j.foodres.2009.07.017.
- Wang, N.; Maximiuk, L.; Toews, R. Pea Starch Noodles: Effect of Processing Variables on Characteristics and Optimisation of Twin-screw Extrusion Process. Food Chem. 2012, 133(3), 742–753. DOI: 10.1016/j.foodchem.2012.01.087.
- de Almeida Costa, G. E.; da Silva Queiroz-monici, K.; Pissini Machado Reis, S. M.; de Oliveira, A. C. Chemical Composition, Dietary Fibre and Resistant Starch Contents of Raw and Cooked Pea, Common Bean, Chickpea and Lentil Legumes. Food Chem. 2006, 94(3), 327–330. DOI: 10.1016/j.foodchem.2004.11.020.
- Kutoš, T.; Golob, T.; Kač, M.; Plestenjak, A. Dietary Fibre Content of Dry and Processed Beans. Food Chem. 2003, 80(2), 231–235. DOI: 10.1016/S0308-8146(02)00258-3.
- Rehman, Z.-U.; Shah, W. H. Thermal Heat Processing Effects on Antinutrients, Protein and Starch Digestibility of Food Legumes. Food Chem. 2005, 91(2), 327–331. DOI: 10.1016/j.foodchem.2004.06.019.
- Kim, H. R.; Choi, S. J.; Park, C.-S.; Moon, T. W. Kinetic Studies of in Vitro Digestion of Amylosucrase-modified Waxy Corn Starches Based on Branch Chain Length Distributions. Food Hydrocolloids. 2017, 65, 46–56. DOI: 10.1016/j.foodhyd.2016.10.038.
- Zhang, Y.; Zhang, Y.; Xu, F.; Li, S.; Tan, L. Structural Characterization of Starches from Chinese Jackfruit Seeds (Artocarpus Heterophyllus Lam). Food Hydrocolloids. 2018, 80, 141–148. DOI: 10.1016/j.foodhyd.2018.02.015.
- Brand-Miller, J.; Holt, S. Testing the Glycaemic Index of Foods: In Vivo, Not in Vitro. EurJ. Clin. Nutr. 2004, 58, 700. DOI: 10.1038/sj.ejcn.1601856.
- Miller, G. L.;. Use of Dinitrosalicylic Acid Reagent for Determination of Reducing Sugar. Anal. Chem. 1959, 31(3), 426–428. DOI: 10.1021/ac60147a030.
- Johnson, S. K.; Thomas, S. J.; Hall, R. S. Palatability and Glucose, Insulin and Satiety Responses of Chickpea Flour and Extruded Chickpea Flour Bread Eaten as Part of a Breakfast. Eur. J. Clin. Nutr. 2004, 59, 169. DOI: 10.1038/sj.ejcn.1602054.
- Goñi, I.; Valentı́n-Gamazo, C. Chickpea Flour Ingredient Slows Glycemic Response to Pasta in Healthy Volunteers. Food Chem. 2003, 81(4), 511–515. DOI: 10.1016/S0308-8146(02)00480-6.
- Niba, L. L.;. Processing Effects on Susceptibility of Starch to Digestion in Some Dietary Starch Sources. Int. J. Food Sci. Nutr. 2003, 54(1), 97–109. DOI: 10.1080/0963748031000042038.
- Siljeström, M.; Asp, N.-G. Resistant Starch Formation during Baking -effect of Baking Time and Temperature and Variations in the Recipe. Zeitschrift für Lebensmittel-Untersuchung und Forschung. 1985, 181, 4–8. DOI: 10.1007/BF01124798.
- Bravo, L.; Siddhuraju, P.; Saura-Calixto, F. Effect of Various Processing Methods on the in Vitro Starch Digestibility and Resistant Starch Content of Indian Pulses. J. Agric. Food Chem. 1998, 46(11), 4667–4674. DOI: 10.1021/jf980251f.
- Hsu, R. J.-C.; Chen, H.-J.; Lu, S.; Chiang, W. Effects of Cooking, Retrogradation and Drying on Starch Digestibility in Instant Rice Making. J. Cereal Sci. 2015, 65, 154–161. DOI: 10.1016/j.jcs.2015.05.015.
- García-Alonso, A.; Goñi, I.; Saura-Calixto, F. Resistant Starch and Potential Glycaemic Index of Raw and Cooked Legumes (Lentils, Chickpeas and Beans). Zeitschrift für Lebensmitteluntersuchung und -Forschung A. 1998, 206(4), 284–287. DOI: 10.1007/s002170050258.
- Osorio-Díaz, P.; Bello-Pérez, L. A.; Sáyago-Ayerdi, S. G.; Benítez-Reyes, M. D. P.; Tovar, J.; Paredes-López, O. Effect of Processing and Storage Time on in Vitro Digestibility and Resistant Starch Content of Two Bean (Phaseolus Vulgaris L) Varieties. J. Sci. Food Agric. 2003, 83(12), 1283–1288. DOI: 10.1002/jsfa.1413.
- Escarpa, A.; González, M. C.; Mañas, E.; García-Diz, L.; Saura-Calixto, F. Resistant Starch Formation: Standardization of a High-Pressure Autoclave Process. J. Agric. Food Chem. 1996, 44, 924–928. DOI: 10.1021/jf950328p.
- Mishra, S.; Monro, J.; Hedderley, D. Effect of Processing on Slowly Digestible Starch and Resistant Starch in Potato. Starch‐Stärke. 2008, 60, 500–507. DOI: 10.1002/star.200800209.
- Lau, E.; Soong, Y. Y.; Zhou, W.; Henry, J. Can Bread Processing Conditions Alter Glycaemic Response? Food Chem. 2015, 173, 250–256. DOI: 10.1016/j.foodchem.2014.10.040.
- Zhang, Y.; Zhang, Y.; Li, B.; Wang, X.; Xu, F.; Zhu, K.; Tan, L.; Dong, W.; Chu, Z.; Li, S. In Vitro Hydrolysis and Estimated Glycemic Index of Jackfruit Seed Starch Prepared by Improved Extrusion Cooking Technology. Int. J. Biol. Macromol. 2019, 121, 1109–1117. DOI: 10.1016/j.ijbiomac.2018.10.075.
- Buyken, A. E.; Mitchell, P.; Ceriello, A.; Brand-Miller, J. Optimal Dietary Approaches for Prevention of Type 2 Diabetes: A Life-course Perspective. Diabetologia. 2010, 53(3), 406–418. DOI: 10.1007/s00125-009-1629-8.
- Danaei, G.; Lawes, C. M.; Hoorn, S. V.; Murray, C. J.; Ezzati, M. Global and Regional Mortality from Ischaemic Heart Disease and Stroke Attributable to Higher-than-optimum Blood Glucose Concentration: Comparative Risk Assessment. The Lancet. 2006, 368(9548), 1651–1659. DOI: 10.1016/S0140-6736(06)69700-6.
- Giuberti, G.; Gallo, A.; Cerioli, C.; Fortunati, P.; Masoero, F. Cooking Quality and Starch Digestibility of Gluten Free Pasta Using New Bean Flour. Food Chem. 2015, 175, 43–49. DOI: 10.1016/j.foodchem.2014.11.127.
- Yu, H.; Liu, Y.; Li, L.; Guo, Y.; Xie, Y.; Cheng, Y.; Yao, W. Ultrasound-involved Emerging Strategies for Controlling Foodborne Microbial Biofilms, Trends Food Sci. Technol. 2020, 96, 91–101.