
 ?Mathematical formulae have been encoded as MathML and are displayed in this HTML version using MathJax in order to improve their display. Uncheck the box to turn MathJax off. This feature requires Javascript. Click on a formula to zoom.
ABSTRACT
The effect of ingredients on the sensory acceptability of milk chocolate containing okra pectin as emulsifier was investigated and optimized. A four-component constrained mixture design (Simplex lattice) was used for the recipe formulations using Minitab Statistical software. The lower and upper constraints of the component variables (sugar, milk, cocoa butter, and cocoa liquor) were determined from an existing milk chocolate recipe. The formulated products were evaluated by fifteen (15) trained panel of judges for its sensory characteristics including mouthfeel, aftertaste, flavor, taste, appearance, and overall acceptability on a nine-point hedonic scale. At okra pectin level of 0.145%, the optimal proportion of the ingredients in the milk chocolate based on sensory characteristics was found to be 36.08% sugar, 25.92% milk, 20.00% butter, and 18.00% liquor. At these levels, the chocolate samples were either liked moderately or very much, which suggested high overall acceptability (~90%). Validation of the model indicated a good agreement between the predicted and observed ratings for the sensory attributes of the chocolate samples with okra pectin as emulsifier.
Introduction
Chocolate is one of the most popular foods and common confectionery material in the world, people enjoyed for its taste and health benefits. Chocolate is a product of cocoa, made by mixing cocoa masse, cocoa butter, sugar, and other ingredients to produce a solid confectionery.[Citation1] Ghana is currently the second largest cocoa-producing country in the world.[Citation2] West Africa produces more than 70% of the world’s cocoa.[Citation3] However, the consumption pattern for these cocoa-producing countries in the West African sub-region is low.[Citation4] This low patronage may be attributed to the price of the product, purchasing power of citizens in these developing countries, and the stability of these products on the shelves.[Citation5] Different types of chocolate have been developed to suit various uses in the confectionery industry and demands of different markets.[Citation6,Citation7] Both dark and milk chocolate are suspension of solid particles from sugar and cocoa dispersed in a fat continuous phase in a process assisted by an emulsifier.[Citation1,Citation5]
Chocolate has become a product of interest to consumers for its nutritional and health benefits. It has become a perfect gift for many, but it becomes unattractive and unappealing when the box is unwrapped only to find out that there are gray streaks on the bar compromising its quality. Chocolate can have a shelf-life of about 12 months, but the stability depends on parameters such as storage temperature, humidity, accessibility of oxygen, and ingredients.[Citation8] During storage and in distribution, oil migration may occur causing a defect called fat bloom. Sugar bloom occurs when the temperature over the surface of the chocolate product drops below the dew point.[Citation9] The likeness of chocolate by consumers mostly depends on the sensory characteristics and its acceptance.[Citation5,Citation10]
In chocolate, the primary emulsifier used is soy lecithin.[Citation11] Mostly, emulsifiers provide control over flow properties when used in chocolates, although they may have other effects such as controlling the viscosity, influencing the fat crystallization, and acting as bloom inhibitors. The addition of low levels of emulsifiers can reduce viscosity equivalent to several percent addition of cocoa butter. Therefore, emulsifiers are cost-saving ingredients in chocolate.[Citation12] Different emulsifiers have been used in chocolate manufacturing. Examples include ammonium phosphatide and polyglycerol polyricinoleate (PGPR), each having different flow properties.[Citation13]
The okra plant (Abelmoschus esculentus) is a native from Africa but found in several areas worldwide. In Ghana, okra fruit/pod is the fourth most popular vegetable after tomato, pepper, and garden egg.[,Citation14,Citation15] Pectin extracted from okra pods has been found to be a strong candidate for emulsification in an acidic environment.[Citation16,Citation17]
Reducing cost and ensuring consistent product quality, maintaining tight recipe control, and using no more cocoa butter than necessary are of paramount importance for any chocolate manufacturer. Cocoa butter is the most expensive ingredient in chocolate and accounts for one-third of the cost of the final product.[Citation18] It is economically prudent therefore, for manufacturers to look more closely at replacing cocoa butter with emulsifiers to realize cost savings.
Lecithin (E322) is the most commonly used emulsifier in chocolate. However, for a developing country such as Ghana, lecithin is imported, adding to the cost of chocolate production.[Citation11] Some consumers also have concerns about soy lecithin in products because soy is considered a “major food allergen” by the Food and Drug Administration of the United State of America.[Citation19] Alternative chocolate emulsifiers such as polyglycerol polyricinoleate (E476) and ammonium phosphatide (E442) will equally have to be sourced from another country if they are to be used. The ingredients used in chocolate preparation in Ghana that is obtained locally is cocoa. With this in mind, it is extremely important to investigate the use of indigenous ingredients such as okra pectin as an emulsifier in chocolate.
In our previous study, the effect of okra pectin as an emulsifier on the yield, textural properties, sensory, and consumer acceptability of different chocolate formulations was investigated.[Citation11] It was shown that it was feasible to use okra pectin as lecithin substitute to produce acceptable chocolate. In this context, further investigations are therefore necessary to understand the impact of the okra pectin as an emulsifier on sensory properties of milk chocolate, allowing for optimization of the chocolate recipe. The objective of this study, therefore, was to evaluate and optimize the sensory acceptability of chocolate developed with okra pectin as lecithin substitute.
Materials and methods
Materials
The ingredients namely cocoa butter, cocoa liquor, milk powder, and sugar were obtained from Research and Development Department of Cocoa Processing Company Limited, Tema, Ghana. The asha okra pectin used as an emulsifier in the milk chocolates was extracted at the Department of Food Science and Technology, KNUST-Kumasi, Ghana as previously reported.[Citation11,Citation20]
Design of experiment
A four-component constrained mixture design (Simplex lattice) was used for the recipe formulations using Minitab Statistical Software (version 17, Minitab Inc., US). The components were sugar (X1), milk (X2), cocoa butter (X3), and cocoa liquor (X4). The lower and upper constraints of the component variables were determined from an existing milk chocolate recipe from the Cocoa Processing Company Limited, Tema, Ghana (). The emulsifier, okra pectin (0.145%) was held constant in all the formulations. This is because from okra pectin added at 0.145% of the total weight of the ingredients produced chocolate with similar flow and yield as compared to standard milk chocolate produced with lecithin.[Citation11] The component proportions were expressed as fractions of the mixture, and the sum (X1+ X2+ X3+ X4) of the proportions equaled 1 (or 100%) ().
Preparation of milk chocolate samples
For each experiment, a 2000 g batch of milk chocolate was produced using an attrition ball mill (WIENEROTO, Wiener and co., The Netherlands). The chocolate production starts with the manual feeding of ingredients, cocoa butter, cocoa liquor, sugar, and milk into the jacketed mill grinding chamber, that has been pre-heated to about 60°C. The milling temperatures were controlled by thermostat so that the product does not suffer product damage. The products were allowed to mill for about 45 min after which the okra pectin was added. The milling was continued for another 15 min. After the established refining time, the milk chocolate was discharged in a stainless-steel container. The milled chocolate with a particle size of less than 20 microns was conched for about 4 h in a laboratory mini conche. The time was an adaptation as previously described.[Citation21] The chocolate masses were tempered at 32°C using Table Top Temperer (ACMC, USA) before molding and packaging.
Packaged samples were kept at a temperature-controlled (25 ± 5°C) storage room for a day before the sensory evaluation. For the validation evaluation, the samples were kept at the sample temperature for three (3) more days after the first sensory test. All samples were wrapped in an aluminum foil to prevent environmental effects.
Sensory evaluation
Chocolate quality may be defined by consumer tasting which evaluates the eating quality in terms of characteristics such as appearance, taste, mouthfeel, flavor, and aftertaste.[Citation1] The formulated products were evaluated by fifteen (15) trained judges/panelists for its sensory characteristics such as mouthfeel, aftertaste, flavor, taste, appearance, and overall acceptability on a nine-point hedonic scale.
The sensory evaluations were performed in a room illumined with fluorescent light. The temperature of the room was below 30°C. The judges were asked to allow a minute interval between tasting of samples and then score for the attributes of each sample based on the agreed numbers on the 9-point hedonic scale (with 1 = dislike extremely; 2 = dislike very much; 3 = dislike moderately; 4 = dislike slightly; 5 = neither like nor dislike; 6 = like slightly; 7 = like moderately; 8 = like very much; 9 = liked extremely). About three (3) pieces of 10 g of each formulation were presented to each judge in a disposal trays coded with three-digit random numbers. Panelists were provided with water and were allowed to reevaluate samples. To cope with fatigue of analyzing all these 15 formulated samples for each attribute, the Balanced Incomplete Block Design, Plan 11.24, Type I[Citation22] was used as:
where t is the number of treatments, k is the number of experimental units per block, r is the number of replications of each treatment, b is the number of blocks, λ is the number of blocks in which each pair of treatment occurred together, and E is the efficiency factor.
Statistical analysis
Statistical analysis of the data was performed using Minitab statistical software (v.17, Minitab Inc., US). Mixture regression analysis was used to fit the data to polynomial models as:
where Y = predicted response, and β1, β2, β3, β4, β12, β13, β14, β23, β24, β34 are the corresponding parameter estimates for each linear and cross-product terms. Also, analyzed from the sensory evaluation were the cox response trace plot, and the overlaid contour plots.
Results and discussion
Mean ratings for the sensory attributes
The mean scores for the sensory attributes are presented in on the milk chocolate prepared from mixtures containing 30–44% sugar, 18–32% milk powder, 20–34% cocoa butter, and 18–32% cocoa liquor (with okra pectin remaining constant in all the formulations). Ratings on appearance, mouthfeel, taste, aftertaste, and overall acceptability were above 5.0 for fourteen out of the fifteen samples. However, flavor had a minimum statistic below 5.0 (4.17). These suggest, generally that the fifteen formulated samples were liked on the hedonic scale.
Table 4. Analysis of variance for the sensory attributes.
Table 5. Regression model for sensory attributes.
Table 6. Formulations for validation experiments.
Table 7. Predicted and validated ratings for sensory attributes within and outside optimum region.
Table 1. Lower and upper bound constraints for each mixture component.
Table 2. Simplex lattice design for fifteen (15) chocolate formulations.
Table 3. Mean ratings of the sensory attributes for the various formulations.
shows the p-values for each attribute after the Analysis of Variance (between groups). The results indicated that at 5% significance level, aftertaste, and overall acceptability were considered significantly different (p < .05). Mixture regression analysis () was used to fit the response data (of sensory attributes) to quadratic polynomial models as indicated below:
The R2 values of the models ranged from 0.656 to 0.9307 with the adjusted R2 ranging from 0.0367 to 0.8059. The R2 value indicated the goodness of a developed model, with the value approaching one for the best model and approaching zero for the worst model. Generally, a higher value of R2 means that the developed model can better predict the results.
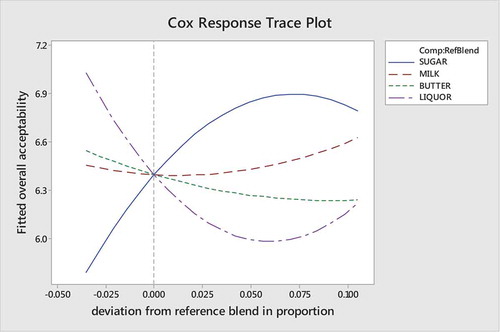
The response trace plot or the cox plots ( and ) were applied to statistically analyze the effect of sugar, milk, butter, and liquor (when the okra pectin which served as an emulsifier was held constant) on the sensory characteristics of milk chocolate in this study. Theoretically, a response trace plot can show the effect of each component on the corresponding response. Several response traces, which are a series of predictions from the fitted model, are plotted along a component direction. The trace curves indicate the effect of changing the corresponding component along an imaginary line (direction). The points along a trace direction of a component are connected, thereby producing as many curves as there are components in the mixture. The response trace plots were very useful for this study, because components in the mixture were more than three.
Figure 1. Cox response trace plot for appearance.
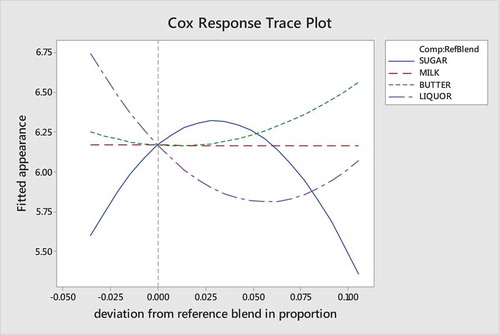
Figure 2. Cox response trace plot for overall acceptability.
Effects of components on appearance
Appearance is an important attribute for chocolate.[Citation7,Citation23] This is because it gives an indication on whether the chocolate was well tempered or there had been an initiation of fat or sugar bloom. The minimum and maximum statistical values for the appearance were 5.29 (neither liked nor disliked) to 7.00 (liked moderately). The magnitudes of the coefficients for the four pure mixtures indicated that cocoa liquor (64.8) produced a milk chocolate with higher likeness for appearance than cocoa butter (31.4), milk (6.3), and sugar (−62.7). The regression model for appearance was reasonably accurate (R2 = 84.64%).
Positive coefficients for two-blend mixtures, Sugar*Milk (175.9), Sugar*Butter (108.6), and Sugar*Liquor (78.5) for appearance indicate that the two components acted synergistically or were complementary. On the other hand, negative coefficients for Milk*Butter (−58.6), Milk*Liquor (−189.9), and butter*liquor (−210.4) blend for appearance indicates that the two components are antagonistic toward one another. The butter by liquor mixture is the only two-blend mixture that can be judged as significant (p = .039).
The Cox Response plot () suggests that an increase in the proportion of the milk had relatively no significant effect on the appearance of the milk chocolate, but as the proportion of the butter increases, there was an increase in the appearance. The proportion of liquor and sugar in the reference blend can be said to be near optimal. A previous study which utilized simplex lattice mixture design for the formulation of sucrose-free chocolate produced in a ball mill indicated that the presence of sucrose influences more color scattering and that impact its color and more sensory acceptance for appearance as compared to polyols which have different arrangement of crystals.[Citation7] It has also been shown that replacing sucrose with inulin and polydextrose resulted in a darker chocolate compared to the reference.[Citation23]
Effect of component on mouthfeel
Mouth feel is an important sensory attribute for consumer acceptability of chocolate. This because it measures the feel of smoothness, grainy, chalky, heat, and coolness among others on the tongue when the product is in the mouth.[Citation24] The minimum and maximum statistical values for the mouthfeel were 5.0 (neither liked nor disliked) to 8.00 (liked very much). The coefficient in the pure mixture indicated that cocoa liquor (64.98) produced a milk chocolate with higher likeness for mouthfeel than cocoa butter (11.54), milk (−87.4), and sugar (−58.36). The regression model for mouth feel was reasonably accurate (R2 = 92.48%). The only two-blend mixture that can be judged as significant (p = .009) was Sugar*Milk.
As the proposition of sugar in the blend increases, the mouthfeel decreases. Same can be said for the milk. There was either an increase or decrease in mouthfeel as the liquor increase. However, there was a directly proportional increase in the mouthfeel when butter in the reference blend was increased. Chocolate has a unique mouthfeel because cocoa butter has a narrow melting point, very close to body temperature.
Smoothness may either be the absence of particles, lumps, bumps, or any other noticeable texture in the product. The effect of the increase in the butter may also be because it lubricates further any unpleasant grainness that may be coming fromeither the sugar or milk. Only low-quality chocolates are grainy. Fat brings about satiety in a food product thereby making the food feel smooth in the mouth.
Effect of component on flavor
The flavor profile of chocolate has over 600 different volatile compounds that contribute to consumer perception of taste and aroma.[Citation25] The minimum and maximum statistical values for the flavor were 4.17 (disliked slightly) and 7.33 (liked moderately), respectively. The coefficient in the pure mixture indicated that cocoa liquor (91.4) produced a milk chocolate with higher likeness for flavor than the rest of the components. The coefficient two-blend mixture (98.6) for sugar and milk indicated a high likeness for flavor. The regression model for flavor was averagely accurate (R2 = 65.60%) compared to the other attributes. This did not fit very well with the model. None of the pure mixture or the two-blend mixtures can be judged as significant. The flavor matrix of chocolates is greatly dependent on the concentration of volatile components and is influenced by the rate of release from chocolate which is dependent on temperature, molecular interactions, and partition coefficients of the particular compounds.[Citation26] The differences between chocolate flavors are usually based on the type of cocoa bean, how it was fermented and roasted. The liquor and butter used in the formulation were all from the same batch, hence a negligible effect on the flavor variation. The chocolate flavor is also affected by the conching process as well as the type and proportion of ingredients included in each chocolate formula. All the 15 samples were subjected to the same conching and tempering processes, hence temperature may not have affected the flavor of the 15 samples.
As the proposition of milk in blend increases, there was a direct increase in the flavor. Milk chocolate flavor has a lot to do with the type of milk or cream product that is used, as well as the strength and taste of the cocoa liquor. Usually, harsh cocoa solids may hide the milky creamy flavours, but once the cocoa intensity is reduced as it can be seen in the Plot, the creaminess comes to the fore, thereby enhancing the flavor.
Effect of component on taste
One of the key determinants of chocolate acceptance or rejection is its taste. The taste of chocolate products being sweet, bitter, sour, or salty was used as a critical factor for quality and dictates their preference and marketability by consumers. The minimum and maximum statistical values for the taste were 5.6 (liked slightly) to 8.43 (liked very much). The least rating for taste was obtained for formulation 5 (5.6), while the highest mean score (8.43) was obtained for formulation 11 (). The magnitudes of the coefficients for the four pure mixtures indicated that milk (65.5) produced a milk chocolate with higher likeness for taste than the other attributes. The regression model for taste was reasonably accurate (R2 = 93.07%). The milk by liquor mixture is the only two-blend mixture that can be judged as significant (p = .044).
To a very large extent, ingredient composition has an influence on the Chocolate taste than processing technology. The Cox Response plot suggests that as the proportion of the sugar increases there was an increase in the taste. Likewise, as the proportion of the butter decrease, there was a decrease in the taste of the product.
Effect of component on aftertaste
The lingering taste after eating foods is an important attribute for judging the acceptability of foods. In this study, high mean score of the recipe meant low lingering after-taste. The minimum and maximum statistical values for the aftertaste were 5.2 (neither liked nor disliked) and 8.43 (liked very much), respectively. The magnitudes of the coefficients for the four pure mixtures indicated that milk (119) produced a milk chocolate with higher likeness for lower lingering aftertaste than the other attributes. The regression model for the aftertaste was reasonably accurate (R2 = 85.87%). None of the pure or the two-blend mixture could be judged as significant. The Cox Response plot for aftertaste was quite similar as that for taste.
Effect of component on overall acceptability
The minimum and maximum statistical values for the appearance were 5.66 (neither liked nor disliked) and 7.16 (liked moderately), respectively. The magnitudes of the coefficients for the four pure mixtures indicated that cocoa liquor (67.2) produced a milk chocolate with higher likeness for overall acceptability than other compositions. The regression model for overall acceptability was reasonably accurate (R2 = 87.62%). The milk by liquor mixture was the only two-blend mixture that can be judged as significant (p = .035) factor influencing the overall acceptability (; ).
Optimal formulation
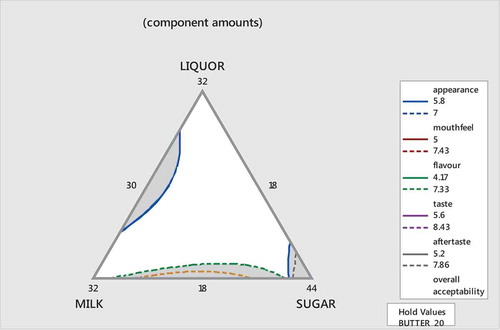
Optimization in sensory evaluation is defined as a procedure for developing the best possible product in its class.[Citation27] By holding one attribute constant, Contour plots of the other attributes were overlaid, using Minitab statistical software (v.17, Mintab Inc., US) and the optimum regions (of the component formulations) where the criteria for all the sensory attributes (appearance, mouthfeel, flavor, taste, aftertaste, and overall acceptability) were satisfied. The feasible regions that satisfy optimum response variable settings are illustrated as the white area inside each plot. The shaded areas on the graphical optimization plot refer to responses that do not meet the selection criteria. By holding the milk powder at minimum proposition of 0.18 (18%), the optimum region is illustrated in . , and show the optimum region when holding sugar, liquor, and butter, respectively.
Figure 3. Overlaid contour plot when milk in addition to okra pectin are held constant.
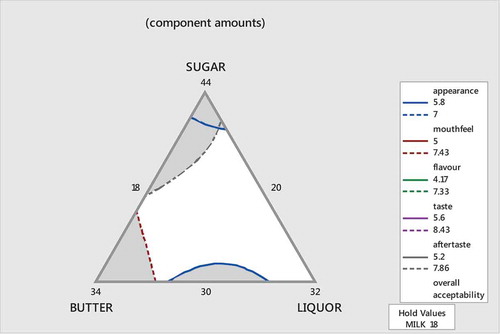
Figure 4. Overlaid contour plot when sugar in addition to okra pectin are held constant.
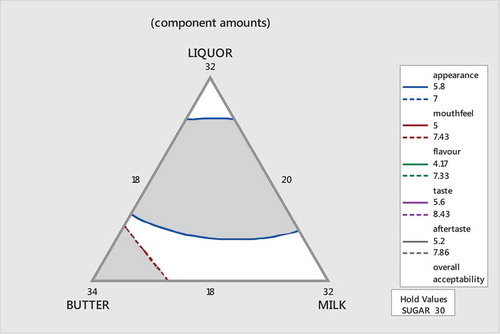
Figure 5. Overlaid contour plot when liquor in addition to okra pectin are held constant.
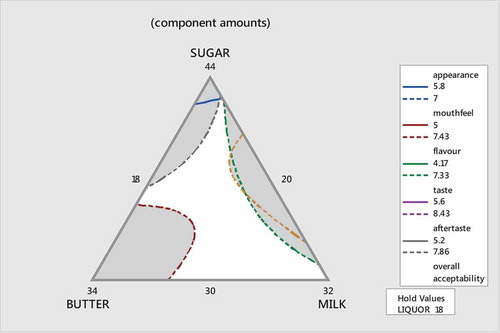
Figure 6. Overlaid contour plot when butter in addition to okra pectin are held constant.
Response optimization
Optimal settings of the design variables for one response may be far from optimal or even physically impossible for another response. Hence, the response optimization was used to allow for compromise among the various responses. It provided an optimal solution for the input variable combinations and the optimization plot. The optimization plot was interactive. This meant that one could adjust input variable settings on the plot in the Minitab software to search for more desirable solutions.
The Minitab response optimizer analysis result is shown in . Desirability function for milk chocolate maximizing appearance, mouthfeel, flavor, taste, aftertaste, and overall acceptability based on a 9-point Hedonic scale (1 = extremely dislike, 9 = like extremely). Lower boundary was set to 5 (neither like nor dislike) and maximum to 8 (like very much). Weight and importance of each Y was set to 1.
Figure 7. Optimization plot for sensory acceptability.
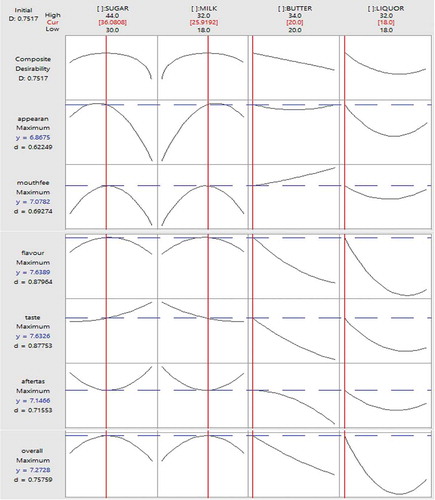
Overall desirability (D) was determined to be 0.7517 based on individual D-values ranging from 0.62249 to 0.87753 (). From these values, the optimal blend was found to be 36.08% sugar, 25.92% milk, 20.00% butter, and 18.00% liquor. The predicted responses at these optimum levels were liked moderately for appearance (6.87), mouthfeel (7.08), aftertaste (7.15), and overall acceptability. Liked very much for flavor (7.64) and taste (7.63).
It has been previously indicated that okra pectin added at 0.145% of the total weight of the ingredients produced chocolate with similar flow and yield to standard milk chocolate produced when lecithin was used.[Citation11] The addition of lecithin reduces the viscosity of chocolate dramatically and this brings about the reductions in the fat content without changing the flow properties. It is possible, therefore, to reduce the fat content with approximately 4% without changing the flow properties by adding 0.4% lecithin to the chocolate. It was suggested that okra pectin at 0.145% with similar flow properties may have similar effect. Any value above this may bring about thickening effect and off-flavor.
Just by considering the sensory evaluation in this study, the acceptable chocolate developed had its butter at the minimum region of 20% (). So was the cocoa liquor (18%), which contains more than half of butter. Therefore, if manufactures can produce milk chocolate at these low levels of butter and liquor using the okra pectin, and still be acceptable in terms of appearance taste and smoothness, then this will go a long way to increase the marketability of the product, hence greatly enhancing the profit margin.
Model validation
To determine whether the predictive models obtained were sufficient and adequate, two formulations that fell within all the optimum regions and two formulations outside the region were selected for the validation process.
Formulations in were subjected to sensory evaluation by the same panel of judges. Results from the validation study () indicated that the ratings for appearance, mouthfeel, flavor, taste, aftertaste, and overall acceptability compared well with the predicted ratings. The validation results indicate a good agreement between the observed and predicted ratings.
Conclusion
The optimal proportion of the ingredients in the milk chocolate based on sensory characteristics was found to be 36.08% sugar, 25.92% milk, 20.00% butter, and 18.00% liquor at okra pectin level of 0.145%. At these levels, the chocolate may be liked moderately in terms of its overall acceptability. The model validation revealed a good agreement between the predicted and observed ratings for the sensory attributes of the chocolate samples with okra pectin as emulsifier.
Acknowledgments
The authors declare that there is no conflict of interest.
References
- Afoakwa, E. O.; Paterson, A.; Fowler, M.; Vieira, J. Particle Size Distribution and Compositional Effects on Textural Properties and Appearance of Dark Chocolates. J. Food Eng. 2008, 87(2), 181–190. DOI: 10.1016/j.jfoodeng.2007.11.025.
- Bangmarigu, E.; Qineti, A. (2018). Cocoa Production and Export in Ghana (No. 2038-2018-3066).
- ICCO. Quarterly Bulletin of Cocoa Statistics, Vol. XLV, No.1; Cocoa year 2018/19, 2019.
- ICCO. The World Cocoa Economy: Past and Present. Report Presented to The Executive Committee at the 146th Meeting, London, 2012. EX/146/7.
- Afoakwa, E. O. Chocolate Production and Consumption Patterns. Chocolate Sci. Technol. 2010, 1–11.
- Rad, A. H.; Pirouzian, H. R.; Konar, N.; Toker, O. S.; Polat, D. G. Effects of Polyols on the Quality Characteristics of Sucrose-free Milk Chocolate Produced in a Ball Mill. RSC Adv. 2019, 9(51), 29676–29688. DOI: 10.1039/C9RA04486H.
- Rad, A. H.; Pirouzian, H. R.; Toker, O. S.; Konar, N. Application of Simplex Lattice Mixture Design for Optimization of Sucrose-free Milk Chocolate Produced in a Ball Mill. LWT. 2019b, 115, 108435. DOI: 10.1016/j.lwt.2019.108435.
- Tuorila, H.;. Hedonic Responses to Flavour and Their Implications for Food Acceptance. Trends Food Sci. Technol. 1996, 7(12), 453–456. DOI: 10.1016/S0924-2244(96)10048-0.
- Čopíková, J.;. Technologie Čokolády a Cukrovinek, (Technology of Chocolate and Confectionery), 1st ed.; Praha VŠCHT, 1999; pp 168.
- Voltz, M.; Beckett, S. T. Sensory of Chocolate. Manuf. Conf. 1997, 77, 49–53.
- Datsomor, D. N.; Agbenorhevi, J. K.; Kpodo, F. M.; Oduro, I. N. Okra Pectin as Lecithin Substitute in Chocolate. Sci. Afr. 2019, 3, e00070. https://doi.org/10.1016/j.sciaf.2019.e00070
- Hasenhuettl, G. L.; Hartel, R. W., Eds. Food Emulsifiers and Their Applications, Springer: New York, 2008; Vol. 19.
- Afoakwa, E. O.; Paterson, A.; Fowler, M. Factors Influencing Rheological and Textural Qualities in Chocolate – A Review. Trends Food Sci. Technol. 2007, 18, 290–298. DOI: 10.1016/j.tifs.2007.02.002.
- Oppong-Sekyere, D.; Akromah, R.; Nyamah, E. Y.; Brenya, E.; Yeboah, S. Evaluation of Some Okra (Abelmoschus Spp L.) Germplasm in Ghana. Afr. J. Plant Sci. 2012, 6(5), 166–178. DOI: 10.5897/AJPS11.248.
- Agbenorhevi, J. K.; Kpodo, F. M.; Banful, B. K. B.; Oduro, I. N.; Abe-Inge, V.; Datsomor, D. N.; Atongo, J.; Obeng, B. Survey and Evaluation of Okra Pectin Extracted at Different Maturity Stages. Cogent Food Agric. 2020, 6, 1760476. DOI: 10.1080/23311932.2020.1760476.
- Alba, K.; Ritzoulis, C.; Georgiadis, N.; Kontogiorgos, V. Okra Extracts as Emulsifiers for Acidic Emulsions. Food Res. Int. 2013, 54(2), 1730–1737. DOI: 10.1016/j.foodres.2013.09.051.
- Kpodo, F. M.; Agbenorhevi, J. K.; Alba, K.; Oduro, I. N.; Morris, G. A.; Kontogiorgos, V. Structure-function Relationships in Pectin Emulsification. Food Biophys. 2018, 13(1), 71–79. DOI: 10.1007/s11483-017-9513-4.
- Dimick, P. S.;. Compositional Effect on Crystallization of Cocoa Butter. Phy. Prop. Fats Oils Emulsif. 1999, 140–162.
- USFDA. Food Allergies: What You Need to Know. Retr. May. 2009, 27, 2010.
- Kpodo, F. M.; Agbenorhevi, J. K.; Alba, K.; Bingham, R. J.; Oduro, I. N.; Morris, G. A.; Kontogiorgos, V. Pectin Isolation and Characterization from Six Okra Genotypes. Food Hydrocolloids. 2017, 72, 323–330. DOI: 10.1016/j.foodhyd.2017.06.014.
- Abbasi, S.; Farzanmehr, H. Optimization of the Formulation of Prebiotic Milk Chocolate Based on Rheological Properties. Food Technol. Biotechnol. 2009, 31(4), 396. https://hrcak.srce.hr/43898.
- Cochran, W. G.; Cox, G. M. Some Methods for the Study of Response Surfaces. Exp. Desig. 1957, 335–375.
- Aidoo, R. P.; Afoakwa, E. O.; Dewettinck, K. Optimization of Inulin and Polydextrose Mixtures as Sucrose Replacers during Sugar–free Chocolate Manufacture–rheological, Microstructure and Physical Quality Characteristics. J. Food Eng. 2014, 126, 35–42. DOI: 10.1016/j.jfoodeng.2013.10.036.
- Folkenberg, D.; Bredie, W. L.; Martens, M. Sensory Rheological Relationships in Instant Hot Cocoa Drinks. J. Sens. Stud. 1999, 14(2), 181–195. DOI: 10.1111/j.1745-459X.1999.tb00111.x.
- Counet, C.; Callemien, D.; Ouwerx, C.; Collin, S. Use of Gas Chromatography−olfactometry to Identify Key Odorant Compounds in Dark Chocolate: Comparison of Samples before and after Conching. J. Agric. Food Chem. 2002, 50(8), 2385–2391. DOI: 10.1021/jf0114177.
- Kinsella, J. E. Flavour Perception and Binding. Int. News Fats Oils Related Mat. (USA). 1990.
- Sidel, J. L.; Stone, H. An Introduction to Optimization Research. Food Technol. 1983, 37(11), 36–38.