
ABSTRACT
Taste is one of the main chicken soup characteristic quality factors as it affects palatability as well as consumer acceptability. Metabolomics coupled with sensory analysis method were applied to explore the differences of taste-chemical compositions in chicken carcasses and their correlation to the sensory qualities. Results showed that organic acid were the main taste compounds contained in the five kinds of chicken soup samples. The umami taste intensity of chicken breast meat soup was significantly higher than that of the other four parts (p < 0.05). Seven organic acids (oxalic acid, tartaric acid, formic acid, lactic acid, acetic acid, citric acid, and succinic acid) and a small peptide (anserine) were the main differential taste compounds among chicken soup with five different parts, and they contributed significantly to the taste of chicken soup (taste activity value (TAV) >1).
Introduction
Chicken protein is considered to contain high-quality proteins that confer health and metabolic benefits based on the digestible levels of the essential amino acids in it.[Citation3] During stewing, there is a diffusion process of different compounds from the solid ingredients added to water, which contributes to the taste characteristics of soups.[Citation4] Clarifying the influencing factors of the taste components in chicken soup was the key to promote the industrialization of chicken soup products. There are differences in the skeletal muscle fibers of different parts of the chicken owing to the functional differences of chicken tissues, which is one of the important factors contributing to the taste of soup.[Citation5] Researches on the taste components of chicken soup involved different parts of chicken. The inosine 5´-monophosphate (5´-IMP) was found to contribute to the taste of yellow-feather chicken soup (whole chicken). However, amino acids, adenosine 5´-monophosphate (5´-AMP) and guanosine 5´-monophosphate disodium salthydrate (5´-GMP) had no significant effect on the taste of chicken soup.[Citation6] Histidine (His), lactic acid, and succinic acid were considered to play an active role in the taste of chicken soup prepared by Sanhuang chicken breast.[Citation7] Qi et al. reported that only the taste activity value (TAV) of 5´-IMP was greater than 1 in the strewed soup prepared by yellow-feather chicken without neck and feet.[Citation8] Wang et al. reported that the alanine (Ala), His, 5´-AMP, 5´-GMP and 5´-IMP contributed to the taste of chicken soup prepared by Sanhuang chicken breast, while proline (Pro), Ala, lysine (Lys), His, 5´-GMP and 5´-IMP contributed to the taste of chicken soup prepared by Sanhuang chicken thigh.[Citation9] The Ala, His, 5´-AMP, 5´-GMP and 5´-IMP contributed to the taste of chicken soup prepared by Black-bone silky fowl chicken breast, while Ala, His, 5´-GMP and 5´-IMP contributed to the taste of chicken soup prepared by Black-bone silky fowl chicken thigh.[Citation9]
Metabolomics is a systematic approach to qualitatively and quantitatively analyze changes in a system induced by exogenous or endogenous stimuli.[Citation10] The combination of metabonomics and sensory evaluation was widely used as an effective means to clarify the taste mechanism of food in pufferfish meat,[Citation11] different types of dry-cured hams,[Citation12] etc. To get a better understanding of the taste-chemical compound, which contributes to the taste and sensory quality of chicken soup, it is essential to make a comprehensive study the differences of taste compounds in chicken soup with different parts. Although the taste components of chicken soup with different parts have been reported, there is by far no systematic comparative analysis of taste compounds of different parts of Hy-Line brown chicken in the cooking process.
In this work, the differences among five different parts of chicken (whole chicken, whole chicken leg, chicken leg meat, chicken breast meat, and chicken skeleton) and the relationship between the taste-chemical compounds and taste profiles were investigated. The aims of this work including: (1) isolate and quantify of the taste compounds from five different parts of chicken; (2) do a sensory evaluation of the taste profiles of the five chicken soup; (3) investigate the differences of taste compounds among the five chicken soup by metabolomics coupled with multivariate data analysis (principal component analysis (PCA) and orthogonal projections to latent structures discriminant analysis (OPLS-DA)).
Materials and methods
Materials and chemicals
Sixty-week-old chickens (Hy-Line brown) raised on a corn-soybean diet were purchased in the family farm owned by Zhongcui family in Daiyue District (Taian, China), with the content of moisture 61.2%, ash 3.8%, crude protein 16.6%, crude fat 16.6%, glucose 0.28%. The chickens in the middle and later stages of laying were reared in three-layer ladder cages. The temperature of the henhouse was between 17 °C and 26 °C. Two rows and three walkways layout with good lighting and ventilation were adopted in henhouse. Chickens were slaughtered by cutting the jugular and carotid veins, bled for 3 min, scalded at approximately 80 °C for 1 min, and then manually defeathered and eviscerated. The meat was frozen and stored in vacuum at – 26 °C for further processing.
All chemicals were of analytical reagent grade except methanol. Formic acid (98%), acetic acid (99.5%), tartaric acid (99%), propionic acid (99.5%), lactic acid (85%), succinic acid (99.5%), ascorbic acid (99.7%), oxalic acid dihydrate (99.8%), citric acid monohydrate (99.8%), fumaric acid (99%) and potassium dihydrogen phosphate (99.5%) were obtained from Sinopharm Chemical Reagent Co. (Shanghai, China). Malic acid (99%) was purchased from Bailingwei Technology Co., Ltd. (Beijing, China). Pyroglutamic acid (99%) and pyruvic acid (98%) were purchased from Macklin Biochemical Co. Ltd. (Shanghai, China). Perchloric acid (HClO4, 71%) was purchased from Xinyuan Chem Ltd. (Tianjin, China). 5´-IMP (98%), 5´-AMP (97%), 5´-GMP (99%), cytidine 5´-monophosphate assay (5´-CMP) (99%), DL-O-Phosphoserine (Phser) (98%), taurine (Taur) (99%), O-phosphorylethanolamine (Pea) (96%), L-hydroxyproline (Hypro) (98.5%) and DL-3-aminoisobutyric acid (Baiba) (98%) were purchased from Sigma-Aldrich (St. Louis, Mo., U.S.A.). Urea (99%), aspartic acid (Asp) (99%), threonine (Thr) (99%), serine (Ser) (99%), glutamic acid (Glu) (99%), Pro (99%), glycine (Gly) (99%), Ala (99%), cystine (≥99.5%), valine (Val) (99%), methionine (Met) (99%), isoleucine (Ile) (99%), leucine (Leu) (99%), tyrosine (Tyr) (99%), phenylalanine (Phe) (99%), His (99%), Lys (98%), ammonium chloride (Amm) (99.5%), arginine (Arg) (98%), asparagine (Asn) (98%), glutamine (Gln) (99%), sarcosine (Sarc) (98%), L-2-aminoadipic acid (AAAA) (98%), citrulline (Citr) (98%), L(+)-2-aminobutyric acid (Aaba) (99%), cystathionine (Cysth) (98%), beta-alanine (β-ala) (98%), homocystine (Homocys) (98%), 4-aminobutyric acid (Gaba) (99%), ethanolamine (Ethan) (99%), 5-hydroxy-DL-lysine hydrochloride (Hylys) (97%), L(+)-ornithine hydrochloride (Orn) (98%), 1-methyl-L-histidine (1-Mhis) (98%), 3-methyl-L-histidine (3-Mhis) (98%), L-anserine nitrate (Ans) (98%), and carnosine (Car) (98%) were purchased from Aladdin Biochemical Technology Co., Ltd. (Shanghai, China). Methanol (99.9%) was chromatographically pure and purchased from Fisher Scientific (Shanghai, China). The ultra-pure water was purchased from Hangzhou Wahaha Group Co., Ltd. (Hangzhou, China).
Mixed standards I: Ala, Amm, Arg, Asp, Cys, Glu, Gly, His, Ile, Leu, Lys, Met, Phe, Pro, Ser, Thr, Tyr, Val, Phser, Taur, Pea, Urea, Asn, Sarc, AAAA, Citr, Aaba, Cysth, β-ala, Baiba, Homosys, Gaba, Ethan, Hylys, Orn, 1-Mhis, 3-Mhis, Ans, Car, Hypro and Gln were dissolved in 0.1 mol/L hydrochloric acid solution to prepare 2.5 mmol/L standard mixture solution (the concentration of Urea was 25.0 mmol/L).
Preparation of chicken soup
Five different parts of chicken were investigated in this work, including whole chicken, whole chicken leg, chicken leg meat, chicken breast meat, and chicken skeleton. The whole chicken was the carcass part with the ass of the chicken removed. The whole chicken leg was a leg cut from the heel of the chicken thigh, and the chicken feet were removed. The chicken leg meat was the part of the whole chicken leg with skin, bone, and visible fat was removed. The chicken breast meat did not contain skin, bone, and visible fat. The chicken skeleton was the bones of the chicken after removing the head, neck, wings, and legs.
Five different parts were cut into small pieces with the length of 5 cm, and then blanched in boiling water for 1 min. Chicken nuggets and water (1:1.5, m:V) were added in an electric cooker (DGD32-32BG, Tonze, Guangdong, China), and stewed in a nutrient soup model for 4 h to obtain whole chicken soup (WCS), whole chicken leg soup (WCLS), chicken leg meat soup (CLMS), chicken breast meat soup (CBMS), and chicken skeleton soup (CSS).
Sensory evaluation
In this work, the quantitative descriptive analysis (QDA) method was used. The sensory evaluation panel was composed of five females and five males (aged from 22 to 29), who were recruited from the Beijing Technology and Business University (Beijing, China). They were able to distinguish the basic tastes (bitterness, sweetness, sourness, saltiness, and umami) and had certain experiences in QDA analysis in meat products. Panelists were trained to distinguish and reorder the 5 basic taste solutions in different concentrations for 20 min three times per week (3 weeks).[Citation13] Five kinds of chicken soup were served to the subjects during the training for providing a broad range of sensory variability for each attribute and further stimulating the formation of descriptors. The final evaluation criteria of sensory evaluation were determined by a panel discussion.
Six descriptive terms and their evaluation criteria were defined as follows: (1) sourness: 0.05 g citric acid/100 mL water = sour 5, 0.1 g citric/100 mL water = sour 10; (2) sweetness: 2 g sucrose/100 mL water = sweet 5, 4 g sucrose/100 mL water = sweet 10; (3) bitterness: 0.00075 g quinine/100 mL water = bitter 5, 0.0015 g quinine/100 mL water = bitter 10; (4) saltiness: 0.3 g sodium chloride/100 mL in water = salty 5, 0.6 g sodium chloride/100 mL in water = salty 10; (5) umami: 0.08 g monosodium glutamate/100 mL in water = umami 5, 0.16 g monosodium glutamate/100 mL in water = umami 10; (6) overall taste: the combination of different tastes. Panelists were trained 4 times within 2 weeks according to the defined sensory evaluation criteria. Finally, all panelists were capable of recognizing the six descriptor terms and using them consistently.
Sensory evaluation was performed in a sensory panel room at (23 ± 2) °C with a humidity of 55%. The panelists were asked to drink one sip of sample and to keep it in the mouth for 10 s and spit it out. The panelists were then asked to score the intensity of each attribute. To avoid fatigue and carryover effect, the panelists were asked to wash their mouth with 50–60 mL drinkable water in the interval of the testing of two different samples. Eating, drinking, or smoking was not allowed 1 hour before the sensory evaluation.[Citation14] All scorecards were collected at the end of each session, and the average values given by all 10 panelists in three repeated experiments for all the descriptors were calculated for multivariate statistical analysis.
Amino acid and its derivative (AAD) and small peptide analysis
The analysis of AAD and small peptide was performed using the method proposed by Kong et al. with some modifications.[Citation7] Five kinds of chicken soup samples were placed in the refrigerator for 24 h at 4 °C, and then centrifuged in 50 mL centrifuge tubes for 15 min at 4 °C (the relative centrifugal force (RCF) was 10,610 g). The fat-free supernatants were lyophilized to get Powder Ⅰ-V. 20 mg of powder was added into 1 mL Lithium Loading Buffer (Biochrom Ltd., Cambridge, UK) before centrifugated for 15 min at 4 °C (the RCF was 10,610 g). After being filtered through 0.22 µm nylon filter membrane (Cleman, Beijing, China), the solutions were subjected to an automatic amino acid analyzer (Biochrom 30+, Biochrom Ltd., Cambridge, UK). Absorbance was recorded at 570 nm and 440 nm respectively. The injection volume was 20 µL. The quantitative analysis of the AAD and small peptides were calibrated by the external standard method.
Organic acid analysis
The analysis of organic acid was performed using a reported method with some modifications.[Citation7] Chicken soup was placed in the refrigerator for 24 h at 4 °C, and then centrifuged in 50 mL centrifuge tubes for 15 min at 4 °C (the RCF was 10,610 g). The supernatant was added to an equal volume of 8% HClO4. The mixture stood for 30 min and was then centrifuged for 15 min at 4 °C (the RCF was 10,610 g) to collect the supernatant. After filtering through a 0.22 µm nylon filter membrane, clear supernatant extraction was used for organic acid analysis. A Thermo U3000 UPLC system (Thermo Scientific, Waltham, Mass., U.S.A.) was employed for analysis. The chromatography column (Venusil MP C18(2), 4.6 mm× 250 mm, 5 µm) was obtained from Agela Technologies (Tianjin, China). Data were collected, processed, and analyzed using Chromeleon software (Shimadzu Corp., Kyoto, Japan). The column temperature was 25 °C. The organic acid was detected at 205 nm. The mobile phase was methanol-0.01 mol/L KH2PO4 (pH = 2.8, adjust with 0.01 mol/L H3PO4) (5:95, V:V) with a flow rate of 1.0 mL/min. The injection volume was 10 µL. Oxalic acid, formic acid, tartaric acid and pyroglutamic acid concentrations were calculated by external calibration curve prepared with a concentration ranging from 15 to 3,000 µg/mL. Lactic acid, pyruvic acid, malic acid, acetic acid, and citric acid concentrations were calculated by the external calibration curve prepared with a concentration ranging from 25 to 5,000 µg/mL. Ascorbic acid, fumaric acid, and propionic acid concentrations were calculated by an external calibration curve prepared with a concentration range from 1 to 200 µg/mL.
Nucleotide analysis
The analysis of nucleotide was performed using the reported method with modifications.[Citation7] Chicken soup was placed in the refrigerator for 24 h at 4 °C, then centrifuged in 50 mL centrifuge tubes for 15 min at 4 °C (the RCF was 10,610 g). The supernatant was diluted with ultrapure water for twofold. After being filtered through 0.22 µm nylon filter membrane, the clear supernatant extraction was used for nucleotide analysis. The nucleotide analysis was carried out using the same UPLC system with the organic acid analysis and the nucleotide were detected at 254 nm. The mobile phase was methanol-0.05 mol/L KH2PO4 (5:95, V:V) with a flow rate of 1.0 mL/min. The injection volume was 10 µL. The nucleotide was quantified using external calibration curves. A mixed nucleotide calibration standard solutions ranging from 1 to 100 µg/mL (including 5´-AMP, 5´-GMP, 5´-IMP, and 5´-CMP) were prepared.
Calculation of the Taste activity value (TAV)
The TAV was calculated between the content of each compound measured in chicken soup samples and its threshold value was normally determined in water or a simple matrix.[Citation12] The compound whose TAV was greater than 1 was regarded as the contributor of chicken soup taste.
Statistical analysis
The processed three-dimensional data, including sample name, compounds name, and compounds contents were all collated into a software package SIMCA14.1 (V14.1, MKS Data Analytics Solutions, Umea, Sweden), which was used for PCA and OPLS-DA analysis. All models used a sevenfold cross-validation to assess the predictive variables of the model (Q2). An S-plot was used to identify the most discriminating variables and their variable importance for the projection (VIP) values. Statistical analyses were performed using SPSS software version 19.0 (IBM Corp., Armonk, New York).
Results and discussion
Differences of taste compounds in 5 kinds of chicken soup samples
Principal components analysis
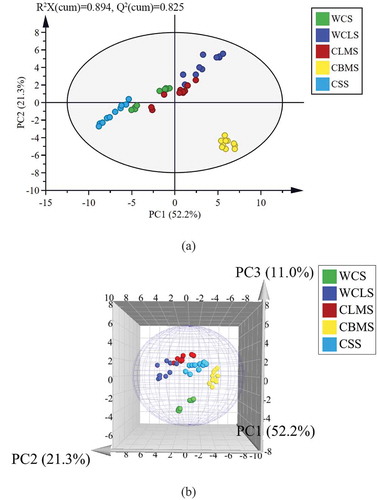
The quantitative results of four kinds of taste compounds were shown in . The statistical significance among them was carried out using one-way ANOVA analysis (p < 0.05). The PCA model for the principal component analysis of five kinds of chicken soup samples was established. The PCA score plot and three-dimensional score plot which were applied to analyze the five kinds of chicken soup samples data were shown in ,b, respectively. Three principal components, PC1 (52.2%), PC2 (21.3%), and PC3 (11.0%), were extracted to explain 84.5% variance information of the characteristic variables of chicken soup with different parts. From , 5 kinds of chicken soup samples were concentrated within 95% confidence intervals of the scatter plot. The CBMS samples with the highest PC1 value and the lowest PC2 value showed good clustering characteristics. The WCS, WCLS, CLMS, and CSS samples were discrete and overlapped in the first, second, and third quadrants of the ellipse. Through the PCA score plot (), it could be seen that the taste compounds of CBMS were quite different from those of the other four kinds of chicken soup samples in the PC1 and PC2. Three-dimensional score plot () showed profile variation of the obvious taste compounds in the five kinds of chicken soup samples.
Table 1. Taste compounds and their contents in five kinds of chicken soup
Figure 1. The PCA scores plot (a) and three-dimensional scores plots (b) for 5 kinds of chicken soup (WCS, whole chicken soup; WCLS, whole chicken leg soup; CLMS, chicken leg meat soup; CBMS, chicken breast meat soup; CSS, chicken skeleton soup)
Orthogonal projections to latent structures discriminant analysis
Multivariate statistical analysis was carried out to expound the effect of different parts on the taste profile of chicken soup. The OPLS-DA was used to eliminate the random errors irrelevant to the research purpose to highlight the differences of taste compounds in chicken soup. Four OPLS-DA models were established, in which WCS/WCLS investigated the differences of two different combinations of skin, meat, and bone; WCLS/CLMS investigated the differences of skin, meat, bone, and meat; CLMS/CBMS investigated the differences of meat in different parts; WCS/CSS investigated the differences of chicken bone and whole chicken. The OPLS-DA score plots, corresponding permutation plot, OPLS-DA loading plot, and corresponding S-plot of four groups of chicken soup were shown in (1. WCS/WCLS; 2. WCLS/CLMS; 3. CLMS/CBMS; 4. WCS/CSS). The number of permutation to use was 200 in the permutation test. According to our data ( (1(A), 2(A), 3(A) and 4(A))), OPLS-DA score plot provided a comparison and showed obvious intergroup taste compound differences between the four groups of chicken soup samples. In addition, the differences within the sample groups of each kind of chicken soup could also be observed. The R2X, Q2, and the ratio of R2X to Q2 in four groups of chicken soup samples were all close to 1 ( (1(A), 2(A), 3(A) and 4(A))), which indicated that the models were reliable. The internal verification of the model showed that the intercept of R2 and Q2 in the Y-axis of the four models were all less than 0.4 and 0.05, respectively ( (1(B), 2(B), 3(B) and 4(B))), indicating that the four models have not been over-fitted.
Figure 2. The OPLS-DA scores plots (1(A), 2(A), 3(A) and 4(A)), permutation plot (1(B), 2(B), 3(B) and 4(B)), OPLS-DA loading plot (1(C), 2(C), 3(C) and 4(C)) and corresponding S-plot (1(D), 2(D), 3(D) and 4(D)) based on the comparison of 4 groups of chicken soup data (1. WCS/WCLS; 2. WCLS/CLMS; 3. CLMS/CBMS; 4. WCS/CSS)
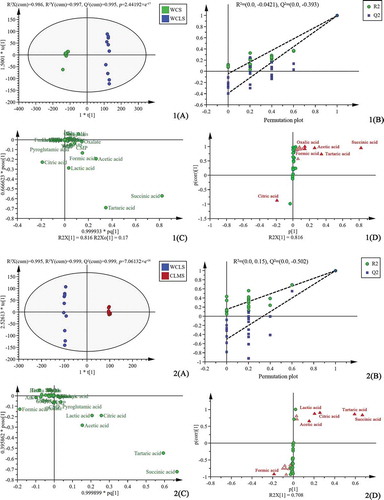
Figure 2. (continued)
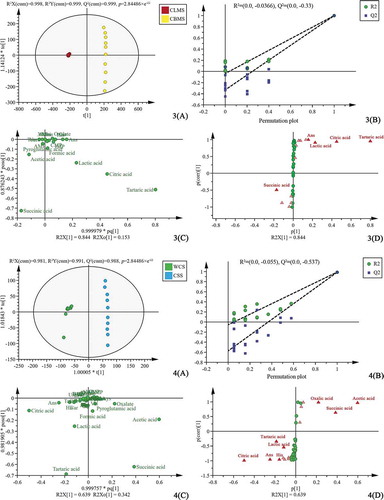
The OPLS-DA loading plot of four groups of chicken soup samples ( (1(C), 2(C), 3(C) and 4(C))) showed that formic acid, succinic acid, tartaric acid, acetic acid, citric acid, and lactic acid were distinguished among the samples. As an important statistical method, OPLS-DA could be used to analyze the changes in taste compound level among the different chicken parts. According to their VIP values, the top 15 compounds that changed in relative amount were triangulated in S-plot. In general, a higher VIP value means a higher contribution of the corresponding compound for the discrimination of samples, and variants with a VIP value greater than 1.0 possess significant differences.[Citation15] The compounds with VIPs ≥1.0 were highlighted in bright red in S-plot ( (1(D), 2(D), 3(D), and 4(D))). VIP values of the taste compounds were listed in . Generally, (1(D), 2(D), 3(D), and 4(D)) clearly showed that the VIP values of succinic acid, tartaric acid, and citric acid were greater than 1.0 in the 5 kinds of chicken soup samples.
Table 2. P-value, fold change (FC) and variable importance for the projection value (VIP) of each compound in four groups of chicken soup samples
The p-value is a measure of the statistical significance of the expression difference. It is generally believed that there is a significant difference between the two groups when p-value is less than 0.05.[Citation16] Fold change is a multiple of changes of compound concentration between two groups of samples. Usually, the compounds with FC ≥ 1.2 or higher are selected as differential compounds.[Citation17] To further screen for differential taste compounds between groups, three indicators were used to constrain the compounds simultaneously. According to the VIP value (VIP ≥ 1.0), p-value (p-value < 0.05) and fold change (FC ≥ 1.2) (), five organic acids (oxalic acid, tartaric acid, formic acid, acetic acid, and succinic acid) were selected as differential taste compounds for WCS and WCLS samples. Similarly, five organic acids (tartaric acid, lactic acid, acetic acid, citric acid, and succinic acid) were selected as differential taste compounds for WCLS and CLMS samples. Three organic acids (tartaric acid, lactic acid, and citric acid) and a small peptide (Ans) were selected as differential taste compounds for CLMS and CBMS samples. Two organic acids (oxalic acid and acetic acid) were selected as differential taste compounds for WCS and CSS samples. In general, organic acids were the main compounds of differences among five kinds of chicken soup samples. The Ans were also differential compounds in CLMS and CBMS samples. The Car and Ans were also reported to be the differential compounds in breast and leg meat of Wuding chicken (Local chicken breed in Yunnan, China), and the content of them in breast meat was higher than those in leg meat.[Citation18]
Sensory taste properties and taste-active compounds of 5 kinds of chicken soup samples
Sensory attributes of 5 kinds of chicken soup samples
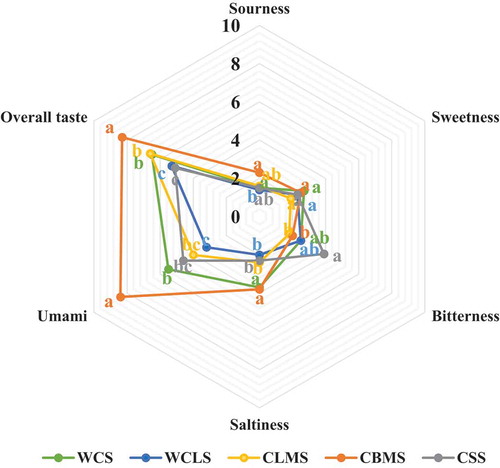
Taste properties of five kinds of chicken soup (WCS, WCLS, CLMS, CBMS, and CSS) were shown in . Sensory evaluation showed that there were significant differences in taste attributes of chicken soup with five different parts. This result also corresponded with the PCA score plot (). From , the CBMS samples had the highest scores of umami. The contents of total AAD and small peptide, organic acid, and nucleotide were the highest in CBMS sample, followed by CLMS, WCLS, WCS, and CSS samples. The overall taste scores of chicken soup samples were not positively correlated with the contents of total AAD and small peptide, organic acid, and nucleotide, which might be related to the interaction of taste compounds.
Figure 3. Taste properties of 5 kinds of chicken soup (WCS, whole chicken soup; WCLS, whole chicken leg soup; CLMS, chicken leg meat soup; CBMS, chicken breast meat soup; CSS, chicken skeleton soup)
Small peptide
Two small peptides were quantified in this work. Both Car and Ans belong to a family of histidyl dipeptides, consisting of L-histidine and β-alanine. Among the 5 kinds of chicken soup samples tested, the content of Ans and Car in CBMS was the highest (3,069 mg/kg (Ans), 1,969 mg/kg (Car)), followed by WCLS (1,006 mg/kg (Ans), 500 mg/kg (Car)). The content of Ans and Car in CSS sample was the lowest (197 mg/kg (Ans), 108 mg/kg (Car)). The contents of Ans and Car in chicken soup with five different parts were significantly different (p < 0.05), which might be the different compositions of muscle fiber type I (slow convulsive oxidized red fiber), IIA (fast convulsive oxidized glycolytic white fiber), and IIB (rapid-twitched glycolysis) White fiber) in chicken meat. The ratios of Car to Ans in WCS, WCLS, CLMS, CBMS, and CSS samples were 0.32, 0.50, 0.50, 0.64, and 0.55, respectively. This was consistent with the ratio range reported in the literature, that is, the ratio of chicken Car to Ans was between 0.28 and 0.81.[Citation19] The Car and Ans in meat could be leached into boiling water because of their high water-solubility, which might be the reason for the high content of Car and Ans in five kinds of chicken soup samples. Meanwhile, the TAVs of Ans were all greater than 1 () in chicken soup samples, except for CSS samples, which indicated that it was important contributor to chicken soup taste. The Car could contribute to sour taste.[Citation20] Although taste threshold of Car was very high (5.135 mg/mL) (), the TAV was greater than 1 in CBMS samples, suggesting that it could play an important role in the taste of CBMS samples. As native peptides occurring in meat, Ans and Car could enhance the sour note at pH 5.7, which contributed to the flavor of bouillon.[Citation21]
Table 3. Taste activity value (TAV) of taste compound in five kinds of chicken soup
Amino acid and its derivatives
The AAD was the main evaluation indexes of taste. Quantification of AAD () showed that His, Taur and Glu were the most abundant compounds in five kinds of chicken soup samples. The total amount of these five taste compounds accounted for 66.45%, 71.88%, 72.46%, 76.51%, and 59.76% of total AAD content in WCS, WCLS, CLMS, CBMS, and CSS samples, respectively.
The His was considered an essential amino acid for humans in the field of nutrition, mainly in children. Zhan et al. investigated the content of free amino acids in 10 different chicken breeds, and the content of His was between 600 and 1, 000 mg/kg.[Citation31,Citation32] In this work, the contents of His in chicken soup with five different parts were 385 (WCS), 828 (WCLS), 639 (CLMS), 1,192 (CBMS), and 132 mg/kg (CSS), respectively. The content of His in CBMS was the highest. The possible reason is that the main muscle composition of breast is of glycolysis, which needs a large amount of buffer (histidine-containing dipeptides) to maintain pH homeostasis within the intracellular environment in order to resist the acidosis caused by high-intensity exercise.[Citation33] Therefore, it was necessary for His with high content to be used to synthesize histidine-containing dipeptides. In this work, the content of His in WCS, WCLS, CLMS, and CSS samples was second only to that of Ans, and the content of His was lower than that of Ans and Car in CBMS samples. Meanwhile, the TAVs of His were all greater than 1 in 5 kinds of chicken soup samples (), which meant that His contributed to chicken soup taste. Although His was related to bitterness, its bitterness could be partially suppressed by sugar, salt, and so forth.[Citation34]
Taurine is a sulfur‐containing amino acid, which exists in mammalian tissues and in particular in skeletal muscle. Xiao et al. reported that there was a significant difference in Taur content between chicken leg meat and chicken breast meat, and the content of Taur in chicken changing varies to varied with chicken age.[Citation18] Among the five kinds of chicken soup samples tested in this study, the content of Taur in WCLS was the highest, followed by CLMS, WCS, CBMS, and CSS samples. Taurine content in two leg-containing samples was significantly higher than that in CBMS samples, which was consistent with the study by Xiao et al.[Citation18] Taurine was considered as the producer of serum-like flavors.[Citation21,Citation24] The TAVs of Taur were all less than 1 in 5 kinds of chicken soup samples because of the high threshold (12.5 mg/mL), suggesting that it was not the potent key taste compounds to the taste of chicken soup samples. It was found in medical research that Taur can significantly improve the taste and smell changes caused by chemotherapy (p < 0.05).[Citation35] In addition, taurine, as an agonist of the GABA receptor, could reduce patients’ perception of bitterness by decreasing taste sensation.[Citation35] Therefore, although Taur has no direct contribution to the taste of chicken soup, its taste-reducing effect could reduce people’s taste perception of bitterness in chicken soup samples.
The Glu was a typical umami amino acid. In this work, shows that the content of Glu in WCLS (174 mg/kg) was significantly higher than that in the other four chicken soup samples. There was no significant difference in Glu content between CLMS (120 mg/kg) and CBMS (117 mg/kg) samples. The minimum content of Glu in CSS samples was 42 mg/kg. The large difference in Glu content in WCLS and CLMS samples might be due to the high collagen content of WCLS samples compares with CLMS samples without chicken skin, whereas Glu was abundant in collagen. The conclusion that skeletal muscle remaining on bones used for bone broth preparation lead to the high Glu levels was drawn by Shaw and Flynn,[Citation36] which might be the reason for the lowest Glu levels in CSS samples. Meanwhile, the TAVs of Glu were all greater than 1 in 5 kinds of chicken soup samples (), which meant that Glu contributed to the taste of chicken soup samples. Meanwhile, the synthetic effects of Glu and nucleotide should not be ignored.
In addition to the above AAD, it was found that 4-aminobutyric acid (Gaba) with TAV > 1 in 5 kinds of chicken soup samples () also contributed to the taste of chicken soup. The content of 4-aminobutyric acid in five kinds of chicken soup samples were 1.6 (WCS), 1.5 (WCLS), 1.5 (CLMS), 1.9 (CBMS), and 1.3 mg/kg (CSS), respectively. 4-Aminobutyric acid was a four-carbon, non-protein amino acid widely found in vertebrates, plants, and microorganisms. It has been proved that 4-aminobutyric acid, as an inhibitory neurotransmitter in taste buds, could be used as a bitterness inhibitor because of its neurotransmitter activity.[Citation37]
Other AAD (Asp, Thr, Ser, Pro, Gly, Ala, Val, Met, Ile, Leu, Tyr, Phe, Lys, Amm, Arg, Phser, Urea, Asn, Sarc, Cysth, β-ala, Ethan, Hylys, Orn, 1-Mhis, 3-Mhis, and cystine) have also been observed in this work, and some of them were reported to contribute to taste. The AAD of Asp and Asn were umami.[Citation22] The AAD of Ser, Pro, Gly, Thr, Ala, β-ala and Sarc were sweet.[Citation23,Citation26] The AAD of Val, Met, Ile, Phe, Lys, Leu, Arg, His, Urea and Tyr all bitter.[Citation7,,Citation25] The AAD of Amm was salty.[Citation22] The AAD of Phser was sour.[Citation23] In this work, the TAVs () of these 20 amino acids (Asp, Thr, Ser, Pro, Gly, Ala, Val, Met, Ile, Leu, Tyr, Phe, Lys, Amm, Arg, Phser, Urea, Asn, Sarc, and β-ala) were all less than 1, which meant that these AAD were not the potent key taste compounds to chicken soup taste. However, the contribution of seven amino acids (cystine, Cysth, Ethan, Hylys, Orn, 1-Mhis, and 3-Mhis) on the taste of chicken soup were unclear because none of their taste thresholds have been reported in references.
Nucleotide
As shown in , 5´-CMP, 5´-GMP, 5´-IMP, and 5´-AMP were determined and identified in five kinds of chicken soup samples. The content of total nucleotide in CBMS sample (884 mg/kg) was the highest, followed by CLMS (343 mg/kg) and WCLS (336.9 mg/kg) samples. Among them, 5´-IMP and 5´-GMP were flavor nucleotides, which made a great contribution to the umami taste intensity.Citation7 These two nucleotides not only have umami taste but also have a synergistic effect with sodium glutamic acid. It was reported that the umami taste might be greatly increased by the synergistic effect of the MSG-like amino acids with 5´-GMP, 5´-IMP and 5´-AMP.[Citation38] The CBMS samples had higher contents of 5´-AMP, 5´-IMP and 5´-CMP than CLMS samples. Although the TAVs of four nucleotides (5´-GMP, 5´-IMP, 5´-AMP, and 5´-CMP) were all less than 1 (), their contribution to the umami taste of chicken soup can not be ignored due to the synergy effect between glutamic acid and nucleotides.
Organic acid
Organic acid plays an important role in taste. They were the most abundant compound in this work. In , citric acid, succinic acid, and tartaric acid were the major components in five kinds of chicken soup samples. The contents of total organic acid accounted for more than 90% of the total compounds in the 5 kinds of chicken soup samples (). Organic acids, such as formic acid, acetic acid, citric acid, and fumaric acid, were generally used as the feed additives in chicken, and they had a positive outcome on the performance, irrespective of type and level of acid used.[Citation38] Lactic acid was a mild acid and derived from glycolysis and glycogenolysis. Lactic acid level kept decreasing in the processing of boneless dry-cured hams, which gave the final product a better water-holding capacity and tenderness.[Citation12] Acetic acid was the main end product of lactic acid metabolism and could also be produced by the Maillard reaction. Diversified diet of chicken might also contribute to the levels of organic acids such as oxalic acid, tartaric acid, pyroglutamic acid.[Citation38] Organic acids (acetic acid, formic acid, fumaric acid, and lactic acid) were quantified, and they were the most abundant compounds in Chinese Wuding chicken.[Citation18] Lactic acid and succinic acid were determined in Sanhuang chicken breast, and they were considered to be the main flavor of organic acid in chicken soup.[Citation7] With respect to taste, nine quantified organic acids (oxalic acid, tartaric acid, formic acid, lactic acid, acetic acid, pyroglutamic acid, citric acid, fumaric acid, and succinic acid) served the sour taste,[Citation21,Citation27,Citation31] and the TAVs of five of them (tartaric acid, lactic acid, acetic acid, citric acid, and succinic acid) were greater than 1 in 5 kinds of chicken soup samples (), indicating that they were important contributors to the sourness of chicken soup. Although there were significant differences in organic acid content, the sensory evaluation values of sourness among five kinds of chicken soup samples were not significant. The reasons for this result might be that the interaction between taste compounds weakens the stimulation of organic acids on taste.
In short, combined with TAVs value (), the Glu was the major contributor to umami taste; the His was the major contributor to bitter taste; 4-aminobutyric acid, Ans, Car, oxalic acid, tartaric acid, formic acid, lactic acid, acetic acid, citric acid, and succinic acid were the major contributor to sour taste. In addition, compounds with taste-reducing effects, such as 4-aminobutyric acid and Taur, might also contribute to the taste perception of chicken soup.
Conclusion
In summary, the differences of taste compositions in chicken carcasses related to the sensory quality were investigated in this work. There were significant differences in PCA and sensory analysis among the chicken soup with five different parts under the experimental conditions. The umami taste of chicken soup with chicken breast meat was significantly higher than that of the other four parts. Organic acids were the most abundant compounds in five chicken soup samples. In addition to succinic acid, lactic acid, acetic acid, citric acid, and oxalic acid that were often reported in the literature, tartaric acid, formic acid, pyroglutamic acid, and fumaric acid had also been observed in chicken soup with Hy-Line brown chicken. Seven organic acids (oxalic acid, tartaric acid, formic acid, lactic acid, acetic acid, citric acid, and succinic acid) and a small peptide (Ans) were the main differential taste compounds among five kinds of chicken soup samples, and they contributed significantly to the taste of chicken soup (TAV > 1). Considering that chicken soup made from different parts has not been studied extensively, the information obtained in this study not only provides insight into the unique taste of chicken (Hy-Line brown) soup, but also provides guidelines for the improvement of the stewing process.
Acknowledgments
The authors declare that there are no conflicts of interest.
Additional information
Funding
- Li, Y. F.; He, R. R.; Tsoi, B.; Kurihara, H. Bioactivities of Chicken Essence. J. Food Sci. 2012, 77(4), R105–R110. DOI: 10.1111/j.1750-3841.2012.02625.x.
- Xin, H.; Hayes, M.; Ibarburu, M. A.; Millman, S. T.; Parsons, R. L.; Brehm-Stecher, B. F.; Kim, J. H.; Li, H.; Comprehensive, A. Assessment of Aviary Laying-Hen Housing System for Egg Production in the Midwest. J. Jpn. Assoc. Pet. Tech. 2012, 77(6), 428–434.
- Pasiakos, S. M.; Agarwal, S.; Lieberman, H. R.; Fulgoni, V. L. Sources and Amounts of Animal, Dairy, and Plant Protein Intake of US Adults in 2007-2010. Nutrients. 2015, 7(8), 7058–7069. DOI: 10.3390/nu7085322.
- Pérez-Palacios, T.; Eusebio, J.; Ferro Palma, S.; Carvalho, M. J.; Mir-Bel, J.; Antequera, T. Taste Compounds and Consumer Acceptance of Chicken Soups as Affected by Cooking Conditions. Int. J. Food Prop. 2017, 20(sup1), S154–S165.
- Dashdorj, D.; Amna, T.; Hwang, I. Influence of Specific Taste-active Components on Meat Flavor as Affected by Intrinsic and Extrinsic Factors: An Overview. Eur. Food Res. Tech. 2015, 241(2), 157–171. DOI: 10.1007/s00217-015-2449-3.
- Li, X.; Zhu, J.; Qi, J.; Wang, P.; Xu, X.; Zhou, G. Superchilled storage (−2.5±1°C) extends the retention of taste-active and volatile compounds of yellow-feather chicken soup. Anim. Sci. J. 2018, 89(6), 906–918. DOI: 10.1111/asj.13004.
- Kong, Y.; Yang, X.; Qi, D.; Zhang, Y. Y.; Sun, B. G.; Chen, H. T.; Sun, Y. Comparison of Non-volatile Umami Components in Chicken Soup and Chicken Enzymatic Hydrolysate. Food Res. Int. 2017, 102, 559–566.
- Qi, J.; Liu, D. Y.; Zhou, G. H.; Xu, X. L. Characteristic Flavor of Traditional Soup Made by Stewing Chinese Yellow‐feather Chickens. J. Food Sci. 2017, 82(9), 2031–2040. DOI: 10.1111/1750-3841.13801.
- Wang, L. H.; Qiao, K. N.; Ding, Q.; Zhang, Y. Y.; Sun, B. G.; Chen, H. T. Effects of Two Cooking Methods on the Taste Components of Sanhuang Chicken and Black‐bone Silky Fowl Meat. J. Food Process. Pres. 2018, 42(11), e13772.1-e13772.10. DOI: 10.1111/jfpp.13772.
- Locci, E.; Noto, A.; Lanari, M.; Lazzarotto, T.; Fanos, V.; Atzori, L. Metabolomics: A New Tool for the Investigation of Metabolic Changes Induced by Cytomegalovirus. J. Matern-Fetal Neo. M. 2013, 26(sup2), 17–19. DOI: 10.3109/14767058.2013.829684.
- Yang, L.; Dai, B.; Ayed, C.; Liu, Y. Comparing the Metabolic Profiles of Raw and Cooked Pufferfish (Takifugu Flavidus) Meat by NMR Assessment. Food Chem. 2019, 290, 107–113. DOI: 10.1016/j.foodchem.2019.03.128.
- Zhang, J.; Yi, Y.; Pan, D.; Zhou, G.; Wang, Y.; Dang, Y.; He, J.; Li, G.; Cao, J. 1H NMR-based Metabolomics Profiling and Taste of Boneless Dry-cured Hams during Processing. Food Res. Int. 2019, 122, 114–122. DOI: 10.1016/j.foodres.2019.04.005.
- Pu, D.; Zhang, H.; Zhang, Y.; Sun, B.; Ren, F.; Chen, H.; Xie, J. Characterization of the Oral Breakdown, Sensory Properties, and Volatile Release during Mastication of White Bread. Food Chem. 2019, 298, 125003. DOI: 10.1016/j.foodchem.2019.125003.
- Pu, D.; Duan, W.; Huang, Y.; Zhang, L.; Zhang, Y.; Sun, B.; Ren, F.; Zhang, H.; Tang, Y. Characterization of the Dynamic Texture Perception and the Impact Factors on the Bolus Texture Changes During Oral Processing. Food Chem. 2020, 339. DOI: 10.1016/j.foodchem.2020.128078.
- Shin, G. R.; Lee, S.; Jang, E. S.; Shin, H. W.; Moon, B. S.; Lee, C. H. Metabolomics Reveal that Amino Acids are the Main Contributors to Antioxidant Activity in Wheat and Rice Gochujangs (Korean Fermented Red Pepper Paste). Food Res. Int. 2016, 87, 10–17. DOI: 10.1016/j.foodres.2016.06.015.
- Altman, D. G.; Bland, J. M. Statistics Notes: Absence of Evidence Is Not Evidence of Absence. BMJ. 1995, 311(7003), 485.
- Zhang, A.; Yan, G.; Zhou, X.; Wang, Y.; Han, Y.; Guan, Y.; Sun, H.; Wang, X. High Resolution Metabolomics Technology Reveals Widespread Pathway Changes of Alcoholic Liver Disease. Mol. BioSyst. 2016, 12(1), 262–273. DOI: 10.1039/C5MB00603A.
- Xiao, Z.; Ge, C.; Zhou, G.; Zhang, W.; Liao, G. 1H NMR-based Metabolic Characterization of Chinese Wuding Chicken Meat. Food Chem. 2019, 274, 574–582. DOI: 10.1016/j.foodchem.2018.09.008.
- Juniper, D.; Rymer, C. The Effect of Rearing System and Cooking Method on the Carnosine and Anserine Content of Poultry and Game Meat. J. Food, Nutr. Agric. 2018, 1(1), 35–39.
- Sonntag, T.; Kunert, C.; Dunkel, A.; Hofmann, T. Sensory-guided Identification of N-(1-methyl-4-oxoimidazolidin-2-ylidene)-α-amino Acids as Contributors to the Thick-sour and Mouth-drying Orosensation of Stewed Beef Juice. J. Agric. Food Chem. 2010, 58(10), 6341–6350. DOI: 10.1021/jf100591c.
- Schlichtherle-Cerny, H.; Grosch, W. Evaluation of Taste Compounds of Stewed Beef Juice. Zeitschrift für Lebensmitteluntersuchung und-Forschung A. 1998, 207(5), 369–376. DOI: 10.1007/s002170050347.
- Hufnagel, J. C.; Hofmann, T. Quantitative Reconstruction of the Nonvolatile Sensometabolome of a Red Wine. J. Agric. Food Chem. 2008, 56(19), 9190–9199. DOI: 10.1021/jf801742w.
- Stark, T.; Bareuther, S.; Hofmann, T. Molecular Definition of the Taste of Roasted Cocoa Nibs (Theobroma Cacao) by Means of Quantitative Studies and Sensory Experiments. J. Agric. Food Chem. 2006, 54(15), 5530–5539.
- Warendorf, T.; Belitz, H. D.; Gasser, U.; Grosch, W. The Flavour of Bouillon. 2. Sensory Analysis of Non-volatiles and Imitation of a Bouillon. Zeitschrift fuer Lebensmittel-Untersuchung und-Forschung (Germany). 1992, 195(3), 215–223. DOI: 10.1007/BF01202798.
- Gomez, F. E.; Cassis-Nosthas, L.; Morales-de-Leon, J. C.; Bourges, H. Detection and Recognition Thresholds to the 4 Basic Tastes in Mexican Patients with Primary Sjögren’s Syndrome. Eur. J. Clin. Nutr. 2004, 58(4), 629–636. DOI: 10.1038/sj.ejcn.1601858.
- Wieser, H.; Jugel, H.; Belitz, H. D. Zusammenhänge zwischen Struktur und Süßgeschmack bei Aminosäuren. Zeitschrift für Lebensmittel-Untersuchung und Forschung. 1977, 164(4), 277–282. DOI: 10.1007/BF01147306.
- Rotzoll, N.; Dunkel, A.; Hofmann, T. Quantitative Studies, Taste Reconstitution, and Omission Experiments on the Key Taste Compounds in Morel Mushrooms (Morchella Deliciosa Fr.). J. Agric. Food Chem. 2006, 54(7), 2705–2711. DOI: 10.1021/jf053131y.
- Warendorf, T.; Belitz, H. D.; Gasser, U.; Grosch, W. Zum Geschmack von Fleischbrühe 2. Sensorische Analyse der Inhaltsstoffe und Imitation einer Brühe. Zeitschrift für Lebensmittel-Untersuchung und Forschung. 1992, 195(3), 215–223.
- Li, H.; Liu, F. The Chemistry of Sour Taste and the Strategy to Reduce the Sour Taste of Beer. Food Chem. 2015, 185, 200–204. DOI: 10.1016/j.foodchem.2015.03.135.
- Zhan, H.; Hayat, K.; Cui, H.; Hussain, S.; Ho, C.-T.; Zhang, X. Characterization of Flavor Active Non-volatile Compounds in Chicken Broth and Correlated Contributing Constituent Compounds in Muscle through Sensory Evaluation and Partial Least Square Regression Analysis. LWT. 2020, 118, 108786. DOI: 10.1016/j.lwt.2019.108786.
- Dolan, E.; Saunders, B.; Dantas, W. S.; Murai, I. H.; Roschel, H.; Artioli, G. G.; Harris, R.; Bicudo, J. E. P. W.; Sale, C.; Gualano, B. A Comparative Study of Hummingbirds and Chickens Provides Mechanistic Insight on the Histidine Containing Dipeptide Role in Skeletal Muscle Metabolism. Sci. Rep-UK. 2018, 8(1), 14788. DOI: 10.1038/s41598-018-32636-3.
- Bakke, A. J.; Stubbs, C. A.; McDowell, E. H.; Moding, K. J.; Johnson, S. L.; Hayes, J. E. Mary Poppins Was Right: Adding Small Amounts of Sugar or Salt Reduces the Bitterness of Vegetables. Appetite. 2018, 126, 90–101. DOI: 10.1016/j.appet.2018.03.015.
- Islambulchilar, M.; Asvadi, I.; Sanaat, Z.; Esfahani, A.; Sattari, M. Taurine Attenuates Chemotherapy-induced Nausea and Vomiting in Acute Lymphoblastic Leukemia. Amino Acids. 2015, 47(1), 101–109. DOI: 10.1007/s00726-014-1840-x.
- Shaw, M.; Flynn, N. Amino Acid Content of Beef, Chicken and Turkey Bone Broth. J. Ugrd. Chem. Res. 2019, 18(4), 15–17.
- Ley, J. P.;. Masking Bitter Taste by Molecules. Chemosens. Percept. 2008, 1(1), 58–77. DOI: 10.1007/s12078-008-9008-2.
- Dermiki, M.; Phanphensophon, N.; Mottram, D. S.; Methven, L. Contributions of Non-volatile and Volatile Compounds to the Umami Taste and Overall Flavour of Shiitake Mushroom Extracts and Their Application as Flavour Enhancers in Cooked Minced Meat. Food Chem. 2013, 141(1), 77–83. DOI: 10.1016/j.foodchem.2013.03.018.
- Adil, S.; Banday, T.; Bhat, G. A.; Mir, M. S.; Rehman, M. Effect of Dietary Supplementation of Organic Acids on Performance, Intestinal Histomorphology, and Serum Biochemistry of Broiler Chicken. Vet. M. Int. 2010, 2010(4), 1–7. DOI: 10.4061/2010/479485.
- Martins, S. I. F. S.; Van Boekel, M. A. J. S. A Kinetic Model for the Glucose/glycine Maillard Reaction Pathways. Food Chem. 2005, 90(1), 257–269. DOI: 10.1016/j.foodchem.2004.04.006.