
 ?Mathematical formulae have been encoded as MathML and are displayed in this HTML version using MathJax in order to improve their display. Uncheck the box to turn MathJax off. This feature requires Javascript. Click on a formula to zoom.
ABSTRACT
The effects of long-term deep freezing and standard storage temperatures on mackerel and croaker qualities were evaluated. Fishes were packed in air-containing packages and stored at −60°C, −50°C, and −18°C for six months. Drip losses of the thawed deep-frozen fishes (−60°C) were lowest throughout the storage period (p< .05), whereas the WHC values were the highest (p<.05), and TBARS and TVBN levels were the lowest (p< .05). Consequently, these fishes were regarded as fresher than those stored at −50°C and −18°C, making this temperature desirable for maintaining mackerel and croaker quality during long-term storge.
Introduction
Mackerel (Scomber japonicus) and croaker (larimichthys polyactis) are the most consumed fishes in East Asian countries. Mackerel contains a large amount of unsaturated fatty acids, such as eicosapentaenoic acid and docosahexaenoic acid.[Citation1] Croaker contains high levels of essential amino acids and ω-3 unsaturated fatty acid lipids.[Citation2] However, the quality of these fishes can be easily lost due to microbial, oxidative, and enzymatic processes as well as postharvest loss. To prevent postharvest losses, fishes are usually rapidly chilled with plenty of ice on the ship after being caught.[Citation3] This method is lowering the temperature of the products to 1–2°C below the freezing temperature, which freezes approximately 30–50% of the water inside the food products.[Citation4,Citation5] This storage method is called superchilling (partial freezing). This technique is effective as it extends shelf life and prevent chemical and microbial degradation.[Citation6] Bao et al.[Citation4] reported that the shelf-life of Arctic char fillets stored under this partial freezing method was extended by six days compared to chilling. Nevertheless, partial freezing is a temporary measure and unsuitable for the long-term storage of fish.[Citation7] Therefore, effective conservative methods that enable the long-term storage of fishes are needed.
Freezing is one of the most effective methods for long-term food storage, which involves removing the heat from the food products and freezing the moisture present.[Citation8,Citation9] Conventional freezing methods have a slow freezing rate, which affects the quality of the food products. (Sun and Lee, 2003). Slow freezing rates allow the growth of large and irregular ice crystals.[Citation10,Citation11] These ice crystals damage the cell membranes and muscle tissues, which can induce extensive drip loss and protein degeneration.[Citation12,Citation13] Otherwise, in the case of fast freezing rates, the time to pass through the zone of maximum ice crystal formation is short, so the ice crystals formed uniformly in the food tissue can help maintain food quality.[Citation14,Citation15]
Final and storage temperatures in the freezing process play important roles in determining the amount of unfrozen water that partakes in the chemical reactions of the food products.[Citation16] Petrović[Citation17] reported that biochemical reactions occur in frozen meat stored at temperatures higher than −20°C due to remaining unfrozen water. It has previously been reported that the qualities of fishes are stable when stored at a lower temperature (below −40°C) than the glass transition temperature by restraining ice recrystallization.[Citation18,Citation19] According to Zhou et al., [Citation20] food products should be stored at temperatures lower than −55°C for freshness. At deep freezing temperatures, biochemical reactions, ice recrystallization, and oxidative odors are minimized; thus, degradation of quality rarely occurs during freezing storage.
Nevertheless, many studies regarding the freezing of fish during storage involve short-term storage despite the advantages of deep-freezing.[Citation21–23] Several studies involving the long-term storage of fish frozen at-18°C have also been conducted.[Citation24,Citation25] Therefore, studies involving the storage of fishes at deep-freezing temperatures (<−50°C) for long-term periods are needed. Moreover, despite the many advantages of storing food products at deep-freezing temperatures, consumers rarely have access to a deep freezer due to economical and validity factors.[Citation26,Citation27] Therefore, deep freezers developed for customers were adopted. In this experiment, mackerel and croaker were frozen and stored at −18°C and deep-freezing temperatures (−60°C and −50°C). The physicochemical properties of these fishes after long-term storage (up to six months) at these temperatures were analyzed.
Materials and methods
Sample preparations
Fresh mackerels (male) and croakers (male) were purchased from a commercial market (Seoul, Korea). Mackerels were deboned and cut into 8 × 12 × 3 cm sections (width × length × height, 150 g). Then, each of them was packed in 12 × 15 × 7 cm (width × length × height) polypropylene box using packaging machine. Similar sized croakers (15 cm length, 100 g) were selected and packed in the same manner. Untreated fishes were used as a control.
Freezing and thawing conditions
Packed mackerels and croakers were placed into chest freezers at −60°C, −50°C, and −18°C, respectively. Each sample was frozen until the center temperature of the samples reached −60°C, −50°C, and −18°C. To measure the temperature change in the freezing step, a T-type thermocouple was inserted into the center of each sample and connected to a data logger (Data Acquisition-MX 100, Yokogawa, Tokyo, Japan). Afterward, samples were stored for six months in deep-freezers (A255WD, LG Electronics, Seoul, Korea) set at −60°C, −50°C, and −18°C. Thawing was carried out using a refrigerator (A255WD) set at 4°C until the core temperature of the fishes reached 0°C. The phase transition time was defined as the time taken for the center of the sample to increase from −5°C to −1.2°C.[Citation28]
Drip loss
Before freezing, the fresh fish were weighed. After thawing, moisture on the samples was removed by wiping the fish with absorbent tissue roll before weighing them again. Drip loss was expressed as the percentage ratio of the thawed weight to the initial weight of the sample.
where W1 is the initial weight of the sample (g) and W2 is the weight of the thawed sample (g).
Water holding capacity (WHC)
WHC was conducted by the modified method based on Hultmann and Rustad.[Citation29] Approximately 1 g of thawed samples (mackerel and croaker) was wrapped in gauze and placed into a conical tube. Next, the conical tubes were centrifuged at 1500 × g for 10 min at 4°C. The WHC of the samples was calculated as the ratio of water remaining after centrifugation using the following formula:
where W1 is the sample weight in grams before centrifugation, and W2 is the sample weight in grams after centrifugation.
Color
Color parameters were determined using CR-400 Chroma Meter (Konica Minolta, Tokyo, Japan) calibrated with a white standard plate (CIE [Commission Internationale de l’Eclairag] L* = 96.79, CIE a* = 0.30, CIE b* = 1.67). The surface color of the thawed samples was measured 10 times. The results are presented as lightness (CIE L*), redness (CIE a*), and yellowness (CIE b*) values. Total color difference (ΔE) was calculated as follows:
The appearance of samples depending on the storage temperatures and periods was observed using a camera (EOS 100D, Canon, Tokyo, Japan).
Thiobarbituric acid reactive substances (TBARS)
TBARS was measured by the TBARS assay following a modified method based on Witte et al.[Citation30] Each 5 g sample was diluted in 45 mL distilled water and homogenized using an SMT pH91 (SMT, Tokyo, Japan) for 60 s. The mixture was then filtered through Whatman No. 1 filter paper (GE Healthcare Life Science, Buckinghamshire, UK). The filtrate (0.5 mL) was transferred to a 15 mL test tube and mixed with 4.5 mL of TBA solution (0.25 N HCl, 15% TCA, and 0.375% TBA reagent). The samples were placed into a water bath (BF-30SB, BioFree, Seoul, Korea) at 95°C for 15 min and centrifuged at 3,000 × g, 4°C for 10 min. Then, 200 μL of supernatant was placed into a microplate, and the absorbance was measured using a spectrophotometer (MultiskanTM GO UV/VIS, Thermo Fisher, Massachusetts, USA) at 535 nm. The values of TBARS were calculated using a standard curve and the following the formula (represented by milligrams of malondialdehyde (MDA) per kilogram of the sample):
where a is the optical density for the sample and b is the optical density for the blank.
Total volatile basic nitrogen (TVBN)
TVBN content was determined according to Conway’s micro-diffusion method.[Citation31] Thawed samples were cut to approximately 5 g pieces, and distilled water was added in a stomacher bag. Then, the sample was homogenized by a slap-type homogenizer (WS-400, Shanghai Zhisun Equipment Co. Ltd., Shanghai, China) for 180 s. The homogenized sample was then passed through a filter paper (Whatman No. 2, GE Healthcare Life Science, Buckinghamshire, UK). After filtration, 1 mL of filtrate was poured into the outer side. Then, 1 mL of 0.01 N H3BO3 and 100 μL of Conway solution (0.066% methyl red in ethanol: 0.066% bromocresol green in ethanol) were dropped into the inner side of a Conway dish. Next, 1 mL of 50% K2CO3 was poured into the outer side. The lid of the Conway dish was closed, and the dish was incubated at 37°C for 2 h in a thermo-hygrostat (IL3-25A, JEIO Tech, Daejeon, Korea). The TVBN content was determined following the addition of 0.02 N H2SO4 into the inner side of the Conway dish. A blank test was executed following the same process without adding homogenized samples. The TVBN value was calculated as follows:
where a is the titer for the sample (mL), b is the titer for the blank (mL), f is a factor of H2SO4, S is the weight of sample used, and c is the dilution.
Statistical analysis
All treatments in this experiment were performed with at least three replicates. Data are expressed as the means with standard deviations. One-way analysis of variance (ANOVA) was executed, and the mean comparisons were conducted by Duncan’s multiple range test (p< .05). Two-way ANOVA was conducted to evaluate the interaction effects of component content change.
Results and discussion
Freezing and thawing profiles
shows the freezing time of mackerel and croaker depending on freezing temperatures. The phase transition time of mackerel and croaker frozen at −18°C was 4.3 and 4 h, respectively, while that at −60°C and −50°C was approximately 0.5 h in both fishes. Generally, it is considered quick freezing when the phase transition time of the center of the fish passes within 0.5 h.[Citation28] Therefore, the −18°C treatment was classified as slow freezing, and deep-freezing treatment (−60°C and −50°C) was categorized as fast freezing. The phase transition time of the freezing process is important for the freshness of frozen foods because a shorter phase transition time leads to the production of smaller ice crystals that reduce damage to fish muscles and deterioration of fish quality compared to larger ice crystals.[Citation13,Citation32] Thus, It was considered that samples frozen at deep-freezing temperatures had smaller ice crystals than those frozen at −18°C.
Figure 1. Freezing curves of mackerel (a) and croaker (b) with various freezing temperatures
For the thawing process (), the thawing times of the frozen mackerel and croaker stored at deep temperatures were similar, at approximately 10 h. The phase transition time of mackerel stored at −18°C was approximately 5 h. However, for the phase transition time, there was no difference between mackerel stored at −60°C and −50°C (p> .05), ranging from 5.5 to 6 h. This was also similar for croaker samples. According to Kim et al.,[Citation33] there are no significant differences in the thawing time of pork neck and chicken leg stored at various temperatures (p> .05), which was consistent with the results of this study.
Figure 2. Thawing curves of mackerel (a) and croaker (b) with various storage temperatures
Drip loss and WHC
Drip losses of all treatments were 0.9–1.5% after one month of storage and increased with storage periods and storage temperatures in both fish (p< .05) (). Above all, drip loss was higher when the mackerel and croaker were stored at-18°C treatment (p< .05). Frozen mackerel and croaker stored at temperatures below −50°C had their quality significantly sustained during storage compared to those frozen at −18°C (p< .05). After six months, mackerel and croaker stored at −60°C had a lower drip loss value than those stored at −50°C (p< .05). Therefore, deep-freezing temperatures are beneficial for reducing drip loss in mackerel and croaker.
Figure 3. Changes in drip loss of thawed mackerel (a) and croaker (b) depending on various freezing temperatures and storage periods. a-dMeans with different lowercase letters within the same storage temperature are significantly different (p< .05). A-CMeans with different uppercase letters within the same storage month are significantly different (p< .05)
Generally, when food products are frozen quickly, the number and size of the ice crystals are small, generating very little drip. On the contrary, the slower the freezing rate and the higher the storage temperature, the greater is the amount of drip generated over the storage period.[Citation28,Citation34] The drip generated during the thawing process not only causes nutritional loss owing to escaping water-soluble proteins, amino acids, and vitamins but also occurs more frequently as the degree of tissue destruction.[Citation35] Ice recrystallization frozen at −18°C is more easily stimulated than that at deep-freezing temperatures.[Citation36]
The WHC of frozen samples presented similar patterns to drip loss in both mackerel and croaker (). During the storage period, changes in the WHC of frozen mackerel and croaker showed different patterns depending on the applied treatment. The WHC of fresh mackerel was 87.95% and that of croaker was 88.98%. Fishes stored at −18°C treatment showed a gradual decrease value of WHC for three months and a sharp decrease after five months of storage (p< .05). During the last storage month, the value of WHC of both fishes stored at −18°C was approximately 67%. In contrast, the WHC of mackerel stored at a temperature below −50°C also exhibited decreases in concordance with the storage period (p< .05). However, the differences in the values were not significant throughout the six months of storage (p< .05).
Figure 4. Changes in water-holding capacity (WHC) of thawed mackerel (a) and croaker (b) depending on various freezing temperatures and storage periods
According to Duun and Rustad,[Citation37] WHC is considered a food parameter of essential quality, and a high value of WHC is significant both to industry and consumers. Generally, WHC decreases due to structural changes in food resulting from freezing, which causes physical damage, and structural changes by the degeneration of proteins.[Citation38] These damages and changes could be alleviated by deep-freezing, which involves rapid freezing. All applied storage temperatures showed significantly lower values of WHC than 85% of the control after one month of storage (p< .05), which was in agreement with the results of a previous experiment.[Citation39] It is considered that fishes frozen at -18°C formed larger ice crystals during freezing. Based on these results, freezing and maintaining these fishes at low temperatures (−60°C) are beneficial for minimizing tissue damage.
Color and appearance
The CIE L*, CIE a*, CIE b*, and total color difference (ΔE) of these fishes differed with various freezing temperatures and storage periods (). All CIE color measurements of frozen mackerel gradually increased with the storage period, except CIE a* (p< .05). The decrease in the CIE a* of frozen mackerel stored at deep-freezing temperatures was slower than that stored at −18°C (p< .05). A significant decrease in the CIE a* of the frozen sample was found after three months at −18°C but rarely found at −60°C and −50°C after six months (p< .05). The CIE b* of frozen mackerel tended to increase with the storage period, and the differences were significant for the untreated fresh mackerel (p< .05). Compared to the control, the CIE L* of mackerel increased but croaker showed the opposite tendency. However, there were no significant differences with respect to storage temperatures and periods (p> .05). The ΔE value of fishes did not show significant trends with freezing temperature or storage periods (p> .05).
Table 1. Changes in the color of thawed mackerel depending on various freezing temperatures and storage periods
Table 2. Changes in the color of thawed croaker depending on various freezing temperatures and storage periods
While mackerels were frozen at −18°C, dehydration and freeze burn can occur, resulting in the sublimation of water at the fish surface, causing a darker flesh color.[Citation40] Therefore, the CIE b* of mackerel stored at −18°C for six months was significantly higher than that of others (p< .05). According to Lee et al.,[Citation41] the base nitrogen produced by the decrease in the freshness of the fishes and the carbonyl compound generated by lipid oxidation react with each other, which induces a browning reaction. Therefore, it is considered that the reaction of mackerel and croaker stored under −18°C is faster than that at deep-freezing treatments. Therefore, freezing storage at −60°C was advantageous in preventing color changes due to lipid oxidation.
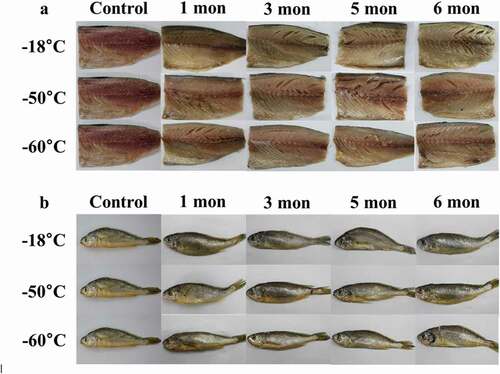
The changes in the appearance of both fishes are presented in . Depending on storage temperature, the mackerel stored at −18°C showed obvious discoloration after three months of storage compared to control (). From that point on, the surface of the flesh turned from red to yellow and was harder to the touch. For croaker, the changes in appearance did not differ with storage temperature and periods (). Therefore, the results indicate that long-term storage at a lower temperature (−60°C) is more effective than that at a − 18°C to maintain the color stability of mackerel and croaker.
Figure 5. Changes in the appearance of thawed mackerel (a) and croaker (b) depending on various freezing temperatures and storage periods. Mon, month
TBARS and TVBN
The changes in TBARS during storage periods of mackerel and croaker are shown in . Mackerel and croaker both contain high levels of unsaturated fatty acids, which rapidly turn rancid after catching the fish, leading to an increased TBARS value.[Citation42,Citation43] Despite the high lipid concentration, lipid oxidation in both fishes was substantially reduced by storage at deep-freezing temperatures for six months (p< .05). Initially, the TBARS content of fresh mackerel was approximately 0.49 mg MDA/kg, and the TBARS of fishes after storage temperatures ranged between 0.63 and 1.47 mg MDA/kg in the sixth month. The results were consistent with those reported by Shin et al.[Citation44]that the TBARS of mackerel stored at −18°C increased with the duration of storage. Samples stored at −60°C and −50°C also showed a tendency to increase the value of TBARS as the storage period passed (p< .05). However, the increments of TBARS for both fishes stored at −60°C were lower than those of fishes stored at −18°C (p< .05). TBARS values of fresh croaker were approximately 0.31 mg MDA/kg. After five months of storage, the TBARS value of the sample stored at −18°C was approximately 0.84 mg MDA/kg, indicating the highest fatty acid degradation. However, the TBARS value of croaker frozen at −60°C was approximately 0.33 mg MDA/kg and had the lowest value among values observed at other storage temperatures in the sixth month (p< .05).
Figure 6. Changes in thiobarbituric acid reactive substances (TBARS) of thawed mackerel (a) and croaker (b) depending on various freezing temperatures and storage periods
In this experiment, TBARS values of fishes stored at −18°C were higher than those of others (p< .05). This is because hydroperoxide, which is the primary substance produced by the oxidation of fat, readily decomposes to secondary oxidation products, such as organic acids, ketones, alcohols, aldehydes, and degrading materials produced by microbial metabolism and lipolytic enzymes.[Citation45] A decomposition odor is released at TBARS values of 1–2 mg MDA/kg of fish.[Citation46] Additionally, the minimum value of TBARS perceived by sensory panelists was 1.44 mg MDA/kg.[Citation47] In this study, the TBARS values of mackerel exceeded 1.0 mg MDA/kg at five months, which means that frozen at −18°C is not effective for long-term storage. Therefore, storing mackerel and croaker at deep-freezing temperatures (−60°C) is necessary to minimize fatty acid degradation.
TVBN values of mackerel and croaker were also influenced by freezing and storage temperature (). According to Whittle et al.[Citation48]and Fagan et al.,[Citation49] TVBN is an important indicator of fish freshness. In both fishes, compared to control, TVBN values increased (p< .05). The TVBN values of fresh mackerel and croaker were 4.65 mg/100 g and 4.20 mg/100 g, respectively. In particular, the lower the storage temperature, the lower is the TVBN value of mackerel and croaker (p< .05). During storage, changes in TVBN values of both fishes showed similar patterns to changes in drip loss and TBARS, i.e., a steady increase proportional to the storage period and temperature. In particular, the rate of increase in TVBN was significant at −18°C treatment (p< .05). After six months of storage, the TVBN value of mackerel frozen at −18°C was 10.69 mg/100 g and that of croaker stored at −18°C was 12.00 mg/100 g. However, TVBN values of mackerel and croaker samples stored at −60°C were 8.37 mg/100 g and 8.78 mg/100 g, respectively.
Figure 7. Changes in total volatile basic nitrogen (TVBN) of thawed mackerel (a) and croaker (b) depending on various freezing temperatures and storage periods
It is considered that the reaction of samples stored at a temperature below −50°C results in less base nitrogen content attributed to the oxidation of lipid components, such as phospholipids, and low-grade basic substances, such as trimethylamine produced by the reduction of trimethylamine N-oxide and materials such as ammonia nitrogen, generated by protein degradation due to bacterial growth.[Citation25,Citation50] Additionally, Tolsotrebrov et al.[Citation19] reported that absolute stabilization of protein at deep-freezing temperatures (below −70°C) is better than that at relatively high temperatures. Furthermore, when stored at deep-freezing temperatures, it is difficult to correct the reaction due to the lack of water molecules, which could restrain the rising values of TVBN.[Citation51] Therefore, it was concluded that there is no concern regarding the lipid oxidation and protein degradation of mackerel and croaker if the fish were stored at deep-freezing temperatures, especially at −60°C, which could be a better temperature selection for preserving the quality of fishes.
Two-way ANOVA
shows the F-values of mackerel and croaker with respect to storage time and deep-freezing temperatures (−60°C and −50°C). In the mackerel, all parameters except ΔE were significantly different (p< .05). Drip loss and WHC were primarily influenced by storage period. Mackerel quality was also affected by storage temperature. Drip loss, WHC, CIE a*, CIE b*, TBARS, and TVBN values were influenced by storage temperature. CIE L* and ΔE did not significantly differ based on storage temperature (p> .05). In the croaker, all parameters were affected by the storage period. However, WHC and color of croaker samples were not influenced by storage temperature (p> .05). Considering the effect on drip loss, TBARS, and TVBN, temperature was an important factor for croaker storage. Therefore, it is obvious that the storage period influences the quality of mackerel and croaker. Likewise, the quality of fish stored at −60°C was significantly better than that stored at −50°C. Therefore, −60°C is the deep-freezing temperature necessary to maintain the quality of fishes during freezing storage.
Table 3. F-values for parameters of mackerel and croaker depending on various freezing temperatures and storage periods
Conclusion
This study investigated the effects of different freezing temperatures and storage durations on the properties of mackerel and croaker. Overall, −60°C was found to be the more effective temperature to maintain fish quality. Drip losses of mackerel and croaker samples increased with storage periods, and drip loss was the lowest when the fishes were frozen at −60°C (p< .05). The value of WHC was the lowest for samples frozen at −18°C (p .05). Samples frozen at −18°C had the highest values of TBARS and TVBN (p< .05). Two-way ANOVA showed significant differences between the quality of fishes stored at −60°C and −50°C (p< .05). Accordingly, the results indicate that −60°C is the optimum temperature for the freezing and storage of fishes for six months without degradation in quality or freshness.
Acknowledgments
This study was financially supported by a grant from the Refrigerator Research of Engineering Division, Home Appliance and Air Solution Company (LG electronics Inc., Korea).
References
- Shin, S. R.; Hong, J. Y.; Nam, H. S.; Huh, S. M.; Kim, K. S. Chemical Changes of Salted Mackerel by Korean Herbal Extracts Treatment and Storage Methods. Korean J. Food Preserv. 2006, 13, 18–23.
- Kang, H. W.; Shim, K. B.; Cho, Y. J.; Kang, D. Y.; Cho, K. C.; Kim, J. H.; Park, K. J. Biochemical Composition of the Wild and Cultured Yellow Croaker (Larimichthys Polyactis) in Korea. Korean J. Fish Aquat. 2010, 43, 18–24.
- Hansen, A. Å.; Mørkøre, T.; Rudi, K.; Langsrud, Ø.; Eie, T. The Combined Effect of Superchilling and Modified Atmosphere Packaging Using CO2 Emitter on Quality during Chilled Storage of Pre-rigor Salmon Fillets (Salmo Salar). J. Sci. Food Agric. 2009, 89(10), 1625–1633. DOI: https://doi.org/10.1002/jsfa.3599.
- Bao, H. N. D.; Arason, S.; Pórarinsdóttir, K. A. Effects of Dry Ice and Superchilling on Quality and Shelf Life of Arctic Charr (Salvelinus Alpinus) Fillets. Int. J. Food Eng. 2007, 3(3), 3–7. DOI: https://doi.org/10.2202/1556-3758.1093.
- Ding, D.; Zhou, C.; Ge, X.; Ye, K.; Wang, P.; Bai, Y.; Zhou, G. The Effect of Different Degrees of Superchilling on Shelf Life and Quality of Pork during Storage. J. Food Process Preserv. 2020, 44(4), e14394. DOI: https://doi.org/10.1111/jfpp.14394.
- Lawrie, R. A.; Ledward, D. A. Lawrie’s Meat Science, 7th ed.; Woodhead Publishing Limieted: Cambridge, UK, 2014.
- Keys, D. R.; Lowder, A. C.; Mireles DeWitt, C. A. Conditions for the Effective Chilling of Fish Using a Nano-sized Ice Slurry. J. Food Process Preserv. 2017, 42, 1–7.
- Sun, D.-W.; Li, B. Microstructural Change of Potato Tissues Frozen by Ultrasound-assisted Immersion Freezing. J. Food Eng. 2003, 57(4), 337–345. DOI: https://doi.org/10.1016/S0260-8774(02)00354-0.
- Kim, Y. B.; Woo, S. M.; Jeong, J. Y.; Ku, S. K.; Jeong, J. W.; Kum, J. S.; Kim, E. M. Temperature Changes during Freezing and Effect of Physicochemical Properties after Thawing on Meat by Air Blast and Magnetic Resonance Quick Freezing. Food Sci. Anim. Resour. 2013, 33(6), 763–771. DOI: https://doi.org/10.5851/kosfa.2013.33.6.763.
- Martino, M. N.; Otero, L.; Sanz, P. D.; Zaritzky, N. E. Size and Location of Ice Crystals in Pork Frozen by High-pressure-assisted Freezing as Compared to Classical Methods. Meat Sci. 1998, 50(3), 303–313. DOI: https://doi.org/10.1016/S0309-1740(98)00038-2.
- Choi, M.-J.; Min, S.-G.; Hong, G.-P. Effects of Pressure-shift Freezing Conditions on the Quality Characteristics and Histological Changes of Pork. LWT-Food Sci. Technol. 2016, 67, 194–199. DOI: https://doi.org/10.1016/j.lwt.2015.11.054.
- Huff-Lonergan, E.; Lonergan, S. M. Mechanism of Water-holding Capacity of Meat: The Role of Postmortem Biochemical and Structural Changes. Meat Sci. 2005, 71, 194–204.
- Kaale, L. D.; Eikevik, T. M.; Bardal, T.; Kjorsvik, E.; Nordtvedt, T. S. The Effect of Cooling Rates on the Ice Crystals Growth in Air-packed Salmon Fillets during Superchilling and Superchilled Storage. Int. J. Refri. 2013, 36(1), 110–119. DOI: https://doi.org/10.1016/j.ijrefrig.2012.09.006.
- Li, B.; Sun, D.-W. Novel Methods for Rapid Freezing and Thawing of Foods – A Review. J. Food Eng. 2002, 54(3), 175–182. DOI: https://doi.org/10.1016/S0260-8774(01)00209-6.
- Liang, D.; Lin, F.; Yang, G.; Yue, X.; Zhang, Q.; Zhang, Z.; Chen, H. Advantages of Immersion Freezing for Quality Preservation of Litchi Fruit during Frozen Storage. LWT-Food Sci. Technol. 2015, 60(2), 948–956. DOI: https://doi.org/10.1016/j.lwt.2014.10.034.
- Leygonie, C.; Britz, T. J.; Hoffman, L. C. Impact of Freezing and Thawing on the Quality of Meat: Review. Meat Sci. 2012, 91(2), 93–98. DOI: https://doi.org/10.1016/j.meatsci.2012.01.013.
- Petrović, L.; 1982, Investigation of Effects of Different Freezing Procedures on Myofibrillar Proteins in Beef M. Longissimus Dorsi. Ph. D. dissertation, University of Novi Sad, Novi Sad, Yugoslavia.
- Hassas-Roudsari, M.; Goff, H. D. Ice Structuring Proteins from Plants: Mechanism of Action and Food Application. Food Res. Int. 2012, 46(1), 425–436. DOI: https://doi.org/10.1016/j.foodres.2011.12.018.
- Tolstorebrov, I.; Eikevik, T. M.; Bantle, M. Effect of Low and Ultra-low Temperature Applications during Freezing and Frozen Storage on Quality Parameter for Fish. Int. J. Refri. 2016, 63, 37–47. DOI: https://doi.org/10.1016/j.ijrefrig.2015.11.003.
- Zhou, G. H.; Xu, X. L.; Liu, Y. Preservation Technologies for Fresh Meat: A Review. Meat Sci. 2010, 86(1), 119–128. DOI: https://doi.org/10.1016/j.meatsci.2010.04.033.
- Mørkøre, T.; Lilleholt, R. Impact of Freezing Temperature on Quality of Farmed Atlantic Cod (Gadus Morhua L.). J. Texture Stud. 2007, 38(4), 457–472. DOI: https://doi.org/10.1111/j.1745-4603.2007.00108.x.
- Hyldig, G.; Jørgensen, B. M.; Undeland, I.; Olsen, R. E.; Jónsson, Á.; Nielsen, H. H. Sensory Properties Of Frozen Herring (Clupea harengus) from Different Catch Seasons and Locations. J. Food Sci. 2012, 77(9), 288–293. DOI: https://doi.org/10.1111/j.1750-3841.2012.02838.x.
- Cai, L.; Wu, X.; Li, X.; Zhong, K.; Li, Y.; Li, J. Effects of Different Freezing Temperatures on Physicochemical Response and Microbial Characteristics of Japanese Sea Bass (Lacteolabrax Japonicas) Fillets during Refrigerated Storage. LWT-Food Sci. Technol. 2014, 59(1), 122–129. DOI: https://doi.org/10.1016/j.lwt.2014.04.062.
- Hong, H.; Luo, Y.; Zhou, Z.; Bao, Y.; Lu, H.; Shen, H. Effects of Different Freezing Treatments on the Biogenic Amine and Quality Changes of Bighead Carp (Aristichthys Nobilis) Heads during Ice Storage. Food Chem. 2013, 138(2–3), 1476–1482. DOI: https://doi.org/10.1016/j.foodchem.2012.11.031.
- Joo, S. Y.; Park, J. A.; Hwang, H. J.; Kim, S. J.; Choi, J. I.; Ha, J. Y.; Cho, M. S. Effects of Freezing-storage Temperature on the Shelf Life of Mackerel Fish. Korean. J. Food. Sci. Technol. 2016, 48(6), 536–541. DOI: https://doi.org/10.9721/KJFST.2016.48.6.536.
- Choi, M. J.; Abduzukhurov, T.; Park, D. H.; Kin, E. J.; Hong, G. P. Effects of Deep Freezing Temperature for Long-term Storage on Quality Characteristics and Freshness of Lamb Meat. Food Sci. Anim. Resour. 2018, 38(5), 959–969. DOI: https://doi.org/10.5851/kosfa.2018.e28.
- Lisitsyn, A. B.; Chernukha, I. M.; Lunina, O. I. To the Question about Meat Freezing. Review. Theory Pract Meat Process. 2019, 4(2), 27–31. DOI: https://doi.org/10.21323/2414-438X-2019-4-2-27-31.
- Yang, C. Y.; Lee, C. H.; Lee, K. H.; Joo, O. S. Low Temperature Preservation of Foods; Seok Hak Dang: Seoul, Korea, 2014.
- Hultmann, L.; Rustad, T. Textural Changes During Iced Storage Of Salmon (Salmo salar) and Cod (Gadus morhua). J. Aquat. Food Prod. Technol. 2002, 11(3–4), 105–123. DOI: https://doi.org/10.1300/J030v11n03_09.
- Witte, V. C.; Krause, G. F.; Bailey, M. E. A New Extraction Method for Determining 2-thiobarbituric Acid Values of Pork and Beef during Storage. J. Food Sci. 1970, 35(5), 582–585. DOI: https://doi.org/10.1111/j.1365-2621.1970.tb04815.x.
- Conway, E. J. Microdiffusion Analysis and Volumetric Error; Crosby Lockwood and Son: London, UK, 1947.
- Bahuaud, D.; Mørkøre, T.; Langsrud, Ø.; Sinnes, K.; Veiseth, E.; Ofstad, R.; Thomassen, M. S. Effects of −1.5°C Superchilling on Quality of Atlantic Salmon (Salmon Salar) Pre-rigor Fillets: Cathepsin Activity, Muscle Histology, Texture and Liquid Leakage. Food Chem. 2008, 111(2), 329–339. DOI: https://doi.org/10.1016/j.foodchem.2008.03.075.
- Kim, E. J.; Lee, S. Y.; Park, D. H.; Kim, H. G.; Choi, M. J. Physicochemical Properties of Pork Neck and Chicken Leg Meat under Various Freezing Temperature in a Deep Freezer. Food Sci. Anim. Resour. 2020, 40(3), 444–460. DOI: https://doi.org/10.5851/kosfa.2020.e24.
- Xanthakis, E.; Le-Bail, A.; Ramaswamy, H. Development of an Innovative Microwave Assisted Food Freezing Process. Innov. Food Sci. Emerg. 2014, 26, 176–181. DOI: https://doi.org/10.1016/j.ifset.2014.04.003.
- Lee, H. O.; Lee, Y. J.; Kim, J. Y.; Kim, K. H.; Kim, B. S. Change in the Quality of Frozen Vegetables during Storage. Korean J. Food Preserv. 2013, 10, 459–465.
- Knight, C. A.; Hallett, J.; De Vries, A. L. Solute Effects on Ice Recrystallization: An Assessment Technique. Cryobiology. 1988, 25(1), 55–60. DOI: https://doi.org/10.1016/0011-2240(88)90020-X.
- Dunn, A. S.; Rustad, T. Quality Changes during Superchilled Storage of Cod (Gadus Morha) Fillets. Food Chem. 2007, 105(3), 1067–1075. DOI: https://doi.org/10.1016/j.foodchem.2007.05.020.
- Lee, E. H.; Lee, J. S.; Joo, D. S.; Cho, S. Y.; Choi, H. G.; Kim, J. S.; Cho, M. G.; Cho, D. J. Application of Cold-osmotic Dehydration Method for Extending the Shelf Life during Frozen Storage of Filleted and Salted Fishes. Korean J. Food Sci. Technol. 1997, 29, 722–729.
- Vidacek, S.; Medic, H.; Botka-Petrak, K.; Nezak, J.; Petrack, T. Bioelectrical Impedance Analysis of Frozen Sea Bass (Dicentrarchus Labrax). J. Food Eng. 2008, 88(2), 263–271. DOI: https://doi.org/10.1016/j.jfoodeng.2008.02.010.
- Drummond, L.; Sun, D. W. Effect of Chilling and Freezing on Safety and Quality of Food Products. In Processing Effects on Safety and Quality Foods. CRC Press: FL, US, 2010; pp. 295-317.
- Lee, K. H.; Hong, B. I.; Jung, B. C. Processing of Low Salt Mackerel Fillet and Quality Changes during Storage. Korean J. Food Sci. Technol. 1998, 30, 1070–1076.
- Song, H. N.; Lee, D. G.; Han, S. W.; Yoon, H. K.; Hwang, I. K. Quality Changes of Salted and Semi-dried Mackerel Fillets by UV Treatment during Refrigerated Storage. Korean J. Food Cook. Sci. 2005, 21, 662–668.
- Li, T.; Hu, W.; Li, J.; Zhang, X.; Zhu, J.; Li, X. Coating Effects of Tea Polyphenol and Rosemary Extract Combined with Chitosan on the Storage Quality of Large Yellow Croaker (Pseudociaena Crocea). Food Control. 2012, 25(1), 101–106. DOI: https://doi.org/10.1016/j.foodcont.2011.10.029.
- Shin, S. W.; Jang, M. S.; Kwon, M. A.; Seo, H. J. Processing of Functional Mackerel Fillet and Quality Changes during Storage. Korean J. Food Preserv. 2004, 11, 22–27.
- Brewer, M. S.; Harbers, C. A. Z. Effect of Packaging on Physical and Sensory Characteristics of Ground Pork in Long-term Frozen Storage. J. Food Sci. 1993, 56(3), 627–631. DOI: https://doi.org/10.1111/j.1365-2621.1991.tb05344.x.
- Fernández-Segovia, I.; Fuentes, A.; Aliño, M.; Masot, R.; Alcañiz, M.; Barat, J. M. Detection of Frozen-thawed Salmon (Salmo Salar) by a Rapid Low-cost Method. J. Food Eng. 2012, 113(2), 210–216. DOI: https://doi.org/10.1016/j.jfoodeng.2012.06.003.
- Ruiz-Capillas, C.; Moral, A. Residual Effect of CO2 on Hake (Meluccis Merluccius L.) Stored in Modified and Controlled Atmospheres. Eur. Food Res. Technol. 2001, 212(4), 413–420. DOI: https://doi.org/10.1007/s002170000270.
- Whittle, K. J.; Hardy, R.; Hobbs, G. Chilled Fish and Fishery Products; Elsevier Applied Science: London, UK, 1990.
- Fagan, J. D.; Gormley, T. R.; Mhuircheartaigh, M. U. Effect of Freeze-chilling, in Comparison with Fresh, Chilling and Freezing, on Some Quality Parameters of Raw Whiting, Mackerel and Salmon Portions. LWT- Food Sci. Tehcnol. 2003, 36(7), 647–655. DOI: https://doi.org/10.1016/S0023-6438(03)00084-7.
- Lee, J. S.; Joo, D. S.; Kim, J. S.; Cho, S. Y.; Lee, E. H. Processing of a Good Quality Salted and Semi-dried Mackerel by High Osmotic Pressure Resin Dehydration under Cold Condition. Korean J. Food Sci. Technol. 1993, 25, 468–474.
- Estévez, M. Protein Carbonyls in Meat Systems: A Review. Meat Sci. 2011, 89(3), 259–279. DOI: https://doi.org/10.1016/j.meatsci.2011.04.025.