
ABSTRACT
The knowledge of the levels of polyphenols present in green coffee beans from different geographical origins is important to identify beans that can provide better coffee quality. The aim of this study was to determine the concentrations of both soluble and cell wall-bound polyphenols in green coffee beans (Coffea arbica L.) from different cultivation regions of Ethiopia. A total of 100 samples were collected from four geographical regions (East, West, South, Northwest) and comprised eight commercial types of coffee (Harar, Jimma, Kaffa, Wollega, Sidama, Yirgacheffe, Finoteselam and Benishangul). The total concentrations of soluble and cell wall-bound polyphenols and flavonoids in the sample extracts were determined using the Folin-Ciocalteu and aluminum chloride reagent methods, respectively. Qualitative analysis was also performed by using high performance thin layer chromatography (HPTLC). Results revealed that chlorogenic acids as the predominant constituents of the phenolic fraction of the green coffee beans. The total soluble polyphenol, cell wall-bound polyphenol and flavonoid contents of the green coffee beans were in the range of 21.8–43.6 milligrams of gallic acid equivalents per gram (mg GAE g−1), 8.6–15.3 mg GAE g−1 and 3.3–6.2 milligrams of (+)-catechin equivalents per gram (mg CE g−1) of dry mass, respectively. Cell wall-bound polyphenols were found to contribute significantly (21.0–32.5%) to the total polyphenol contents (TPC) of the green coffee beans. The polyphenol contents of green coffee beans have been found to vary with geographical origins. Harar coffee contained significantly (p < 0.05) lower amounts of both total soluble and cell wall-bound polyphenols than the other regional coffee types. Furthermore, the contribution of cell wall-bound phenolic to the TPC should not be overlooked.
Introduction
Coffee is a common name for plants belonging to the family Rubiaceae and Genus Coffea. Among the numerous species of Coffea only two species, Coffea arabica (Arabica coffee) and Coffea canephora (Robusta coffee) are mainly under commercial cultivation.[Citation1] Arabica represents 75% of the world’s coffee production, where it is preferred in flavor and fetch higher prices than Robusta coffee.[Citation2] As a result, Arabica coffee is subjected to adulteration in the market by fraudulent activities. Consequently, various analytical techniques have been reported to discriminate between the two coffee varieties.[Citation3,Citation4]
Ethiopia is regarded as the birth place of coffee, particularly Arabica coffee, where it originated in the province Kaffa from the western part of the country.[Citation5] Arabica, the original coffee, is still the only one commercially cultivated in the country.[Citation6] Various Arabica coffees with distinct flavor profiles are, however, produced in different regions of the country. Currently, the country is recognized as the leading Arabica coffee producer in Africa and fifth worldwide.[Citation7,Citation8]
Chemically coffee is primarily composed of sugars, lipids and polyphenols. Though in lower amounts, coffee also contain alkaloids, mainly caffeine and trigonelline.[Citation9] The concentrations of these four classes of chemicals strongly affect the beverage quality of coffee. Polyphenols are secondary plant metabolites that are widely distributed in various fruits and vegetables.[Citation10] Polyphenols are strong antioxidants that complement and add to the functions of antioxidant vitamins and enzymes as a defense against oxidative stress.[Citation11] Consequently, polyphenols have been found to play an important role in the prevention of several degenerative diseases in humans.[Citation12]
Plant based phenolic compounds are classified as flavonoids or non-flavonoids.[Citation13] Flavonoids are compounds consisting of fifteen carbon atoms arranged in such a way that two aromatic rings are connected by a three-carbon bridge.[Citation14] The main non-flavonoid phenolic compounds are phenolic acids, which are hydroxylated derivatives of benzoic and cinnamic acids.[Citation15] The principal hydroxybenzoic acid derivative is gallic acid, which is a component of hydrolysable tannins in plants. The most common hydroxycinnamic acid derivatives are p-coumaric, caffeic and ferulic acids, which commonly occur as esters with quinic acid, and are known as chlorogenic acids.[Citation16]
Phenolic acids are present in plants both in free (soluble) and cell wall–bound (insoluble) forms. Soluble phenolics are present within the plant cell vacuoles, whereas insoluble phenolics are present bound to the cell wall. Consequently, the extraction procedure used depends on the form in which they are present in the plant. Soluble phenolic compounds are present as free, soluble esters or soluble glycosides, and hence the use of a mixed aqueous-organic solvent is normally suitable for their extraction.[Citation17] The insoluble phenolic compounds are present bound to cell wall polymeric molecules through ester and glycosidic bonds,[Citation18] thus are not directly extractable by aqueous-organic solvents. Hence, prior to extraction they should be liberated by alkaline or acid hydrolysis.
Recently, tablets prepared from the polyphenol fraction of green coffee beans have been widely consumed, for example in the US, as anti-obesity agents. These products are marketed as green coffee extract. Since the polyphenol composition of a plant is highly dependent on its growing environment,[Citation16] knowledge of the levels of polyphenols present in green coffee beans from different geographical origins is important to identify beans that can provide higher polyphenol yields. Most studies on the total polyphenol contents of plants are conducted in relation to the soluble fraction only and the contribution from cell wall-bound polyphenols is mostly ignored. This, however, does not accurately reflect the total polyphenol content. The aim of this study was to establish the concentrations of both soluble and cell wall-bound polyphenols in green coffee beans from different cultivation regions of Ethiopia.
Materials and methods
Green coffee beans samples
The major coffee producing regains of Ethiopia are: Northwestern, Southern, Western and Eastern parts of the country.[Citation2] A total of 100 Coffea arabica green coffee samples (6 from Northwest, 18 from West, 27 from East and 49 from South) were collected from the major and commercially important production regions. The sampling regions comprised a total of 45 districts distributed across the country. Whenever two or more samples were collected from a district, they represented different localities and farmlands. Each sample (250 g) was stored in a plastic bag under airtight conditions. Samples from the Northwest included two coffee types (Benishangul and Finoteselam). These coffees are commercially less important and are exclusively produced for local consumption. The western region produces three commercially important types of coffees (Jimma, Kaffa and Wollega), the southern region produces two (Sidama and Yirgachefe), while the eastern region produces a single type (Harar).
Chemicals
Methanol, acetone, formic acid, reference standard of chlorogenic acid (5-O-caffeoylquinic acid), gallic acid, caffeic acid, (+)-catechin, and quercetine, and Folin-Ciocalteu reagent (Sigma-Aldrich, Johannesburg, South Africa); diethyl ether, toluene and hydrochloric acid (SMM, Johannesburg, South Africa); sodium carbonate, sodium hydroxide, aluminum chloride, sodium nitrite, polyethylene glycol and Natural Product reagent (2-aminoethyl diphenyl borate; Alfa Aesar, Ward Hill, USA) were used in the study.
Extraction of soluble phenolic compounds
First a 50 g sample of green coffee beans was finely powdered and sieved. The soluble phenolic compounds were extracted following the method reported by de Ascensao et al.[Citation16] Briefly, a 0.5 g portion of the powder, weighed directly into a nylon centrifuge tube, was then extracted with 7.0 mL of 95% aqueous methanol by shaking for 30 min on a platform shaker at 200xg. The mixture was centrifuged (Dongwang, TD4K-Z, China) at 1684xg and the supernatant was decanted into a second centrifuge tube. The residue was then extracted a second time with 7.0 mL of the solvent. Both supernatants were combined and filtered through Whatman No. 1 filter paper. The volume of the filtrate was adjusted to 14.0 mL and used for the determination of total soluble polyphenols and flavonoids. However, the solid residue leftover after the two successive extraction steps, was dried at 70 °C for 12 h and subsequently used for the extraction and determination of the total cell wall-bound polyphenol contents.
Extraction of insoluble phenolic compounds
The total cell wall-bound polyphenol content of the coffee beans was determined after alkaline hydrolysis of the residue left after extraction of soluble polyphenols.[Citation19] A 20 mg portion of the dried residue was directly weighed into a Pasteur pipette, of which the one end had been sealed by heating. A 1.0 mL aliquot of 0.5 M NaOH was added to the residue and the open end of the pipette was sealed by heating. The mixture was then homogenized by hand shaking, placed in to a beaker containing boiling water and allowed to react for 1 h while heating on an electric hot plate at 100 °C. Thereafter, the mixture was acidified with 60 μL of 36% aqueous HCl and centrifuged at 12 000xg (Hermle Labortechnik GmbH, Z216 MK, Germany) for 5 min. The supernatant was collected and extracted twice with 1.0 mL diethyl ether. The diethyl ether was subsequently removed under vacuum (Genevac, personal evaporator EZ-2 plus, England) and the residue was reconstituted in 200 μL of 20% aqueous methanol. The resulting solution was used to determine the total cell wall-bound phenolic contents.
HPTLC analysis of phenolic compounds
A Camag high-performance thin layer chromatography (HPTLC) system (Camag, Switzerland) equipped with automated sampler, glass twin-trough developing chamber, TLC scanner, photo documentation chamber and WinCat data processing software was used for qualitative determination of the soluble phenolic contents of the samples. Briefly, a 10 μL portion of each coffee extract or standard (1.0 mg mL−1) was automatically applied at a band width of 6 mm to 20 × 10 cm silica gel 60 F254 HPTLC plates (Merck, Germany). The plate was then placed in to the development chamber, which was pre-saturated with the developing solvent toluene-acetone-formic acid (9:9:2), and allowed to develop over a distance of 8 cm. After development, the plate was dried at 100 °C for 1 min and dipped in to a solution of Natural Product reagent, followed by 1% polyethylene glycol for a few seconds. The plate was heated at 100 °C for 1 min. It was then placed in the photo documentation chamber, where images were captured under 254 nm and 366 nm radiation.
Total polyphenol contents
Before determination, a 100 µL portion of the soluble polyphenol extract was diluted to 1.6 mL by adding distilled water, whereas, the extract corresponding to the cell wall-bound polyphenols was used directly for analysis. The total polyphenol content of the extracted solutions was determined spectrophotometrically using the Folin-Ciocalteu method[Citation20] with some modification. Briefly, a 10 μL aliquot of the extract was mixed with 100 μL of Folin-Ciocalteu reagent, which had been diluted by a factor of 10 with distilled water, and kept for 5 min. Subsequently, 100 μL of 10% Na2CO3 was added in to the mixture and incubated for 90 min at room temperature in the dark. The absorbance of the resulting mixture was measured at 760 nm against a blank sample, comprising 10 μL of the extraction solvent treated with all the reagents and incubated for the same period of time, under identical conditions to the samples. Each sample was extracted in triplicate and each of the triplicate extracts were submitted to the Folin-Ciocalteu assay in triplicate, thus a total of nine measurements corresponding to each sample. Results are expressed as average values, together with the associated standard deviations. The analysis was performed by using 96-microwell reaction plates and an absorbance microplate reader (Spectra max 190, China). A total of 10 different samples together with six blank samples were analyzed on a single plate.
Gallic acid was used as the reference standard. For this, stock solution of gallic acid (500 mg L−1) was prepared by dissolving 50 mg of gallic acid powder in 100 mL of 5% aqueous methanol. A series of standard solutions were then prepared by appropriate dilution from the stock solution with distilled water. A calibration curve was constructed in the range of 10–100 mg L−1 of gallic acid after treatment with the Folin-Ciocalteu reagents as described. The regression coefficient (R2) of the calibration equation was 0.998. The results from the analyses of the samples were expressed as milligrams of gallic acid equivalents per gram (mg GAE g−1) of dry mass.
Total flavonoid contents
The total flavonoid content of the green coffee beans was determined spectrophotometrically by using a method described previously,[Citation21] with some modification. Briefly, a 50 μL aliquot of the coffee extract was mixed with 40 μL of 5% NaNO2 solution and incubated for 5 min. Subsequently, a 40 μL aliquot of 10% aqueous solution of AlCl3, 75 μL of 1 M aqueous solution of NaOH and 100 μL of distilled water were added, and the absorbance of the resulting mixture was recorded at 510 nm. Distilled water (50 µL), treated similarly as the samples, was used as a blank for absorbance measurements.
Catechin was used as the reference standard to express total flavonoid contents of samples. A stock solution of catechin (500 mg L−1) was prepared by dissolving 50 mg in 100 mL of 5% aqueous methanol. The calibration standards (10–100 mg L−1) were treated with the same reagents and incubated under identical conditions, with the samples, before construction of the calibration curve. The regression coefficient of the calibration curve was 0.997. The total flavonoid contents of the coffee samples were expressed as milligrams of (+)-catechin equivalents per gram (mg CE g−1) of dry mass. The analysis was done in triplicate, and results are reported as average values, together with the associated standard deviations.
Water content determination
In order to express results on a dry weight basis, the water content of the samples were determined after drying.[Citation22]A 0.2 g portion of each powdered green coffee sample was dried in an oven at 105 °C for 12 h, and the water contents were calculated based on weight differences. The water contents were measured in triplicate and the mean values were used for calculation. The measured water contents were in the range 9.8–11.2% of the fresh weight of the green coffee beans.
Data analysis
Data analysis was performed by using the statistical software package SPSS 20 (IBM Corp, USA). One-way analysis of variance (ANOVA) was used to test for the presence of significant differences in the mean concentration of total polyphenols and flavonoids among the regional and sub-regional types of green coffee beans. Differences were considered significant when p < 0.05.
Results and discussion
HPTLC fingerprints of soluble polyphenols
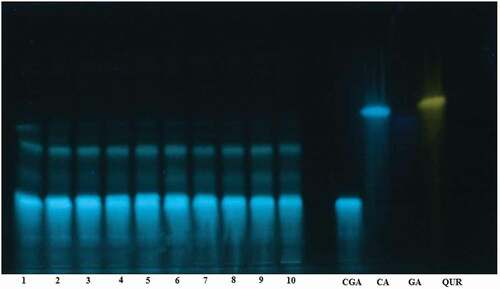
The phenolic composition of the coffee extracts corresponding to 10 randomly selected samples from the different coffee types were investigated by using HPTLC (). Standard solutions corresponding to some common phenolic compounds present in coffee, and tea were analyzed together with the samples. As is typical for green coffee beans, the phenolic fraction of Ethiopian green Arabica coffee beans predominantly contains chlorogenic acid. The different regional coffee types displayed similar chromatographic profiles, and no bands, unique to a particular type, were observed on the chromatograms.
Figure 1. HPTLC chromatograms of soluble polyphenols in ten different green coffee bean extracts (35 mg mL−1) together with standard solutions (1.0 mg mL−1) of chlorogenic acid (CGA), caffeic acid (CA), gallic acid (GA) and quercetin (QUR). The samples are: Kaffa (1), Jimma (2 and 3), Wollega (4), Sidama (5 and 6), Yirgachefe (7), Benishangul (8), Finoteselam (9) and Harar (10)
Total polyphenol and flavonoid contents
The total soluble polyphenol, cell wall-bound polyphenol and flavonoid contents determined in the green coffee beans were in the range of 21.8–43.6 mg GAE g−1, 8.6–15.3 mg GAE g−1 and 3.3–6.2 mg CE g−1 of dry mass, respectively, across the entire sample set (). For each class of polyphenols the maximum concentration was about twice as high as the minimum value measured. This indicates the presence of high variability in polyphenol contents among samples from different geographical origins and types. In contrast, a relatively low variability was observed among replicate samples, as reflected by RSD values of between 3.5 and 9.2% across samples. A similar trend for chlorogenic acids composition in green coffee beans samples were reported.[Citation16]
Table 1. The total concentration (mean±standard deviation) of soluble polyphenols (mg GAE g−1), cell wall-bound polyphenols (mg GAE g−1) and flavonoids (mg CE g−1) in green Arabica coffee beans cultivated in different parts of Ethiopia. All the data are on the basis of dry weight of coffee
Information in the literature on the total polyphenol content of green coffee beans is generally scarce, although some data is available mainly for roasted[Citation23] and soluble[Citation24]coffees. From the limited literature sources, the data reported by Hecimovic et al.[Citation25] on the total soluble polyphenol contents of green beans from two Arabica coffee varieties (Cioccolatato, 21 mg GAE g−1 and Minas, 31 mg GAE g−1), lies within the range of concentrations found in this study.
The total amount of soluble polyphenols determined in the coffee beans is about 2–4 times higher than that present bound to the cell wall. For the plant, cell wall-bound phenolics contribute to the mechanical strength of the cell walls, and afford protection from pathogens.[Citation26] Ferulic and p-coumaric acids are the major phenolic acids present in cell walls.[Citation27] The cell wall-bound polyphenols were found to contribute significantly to the total polyphenol contents of the coffee beans. Across the entire data set, cell wall-bound polyphenols constituted 21.0–32.5% of the overall polyphenol content. This indicates the importance of considering cell wall-bound polyphenols when reporting data on the total polyphenol contents of plant materials.
Across the entire sample set, flavonoids represented only 10–17% of the total soluble polyphenol content. This makes coffee a poor source of flavonoids, for example, compared to grapes and tea.[Citation20,Citation28] The highest proportion of flavonoids, out of the total soluble polyphenols, was found in green coffee beans from Northwest (Benishangul and Finoteselam), followed by East (Harar), South (Yirgachefe and Sidama) and West (Wollega, Jimma and Kaffa).
One-way ANOVA was used to determine the presence of significant differences among the mean total soluble polyphenol contents of the coffee beans from the four regions studied. Accordingly, coffee beans from East contained significantly lower amounts of both total soluble and cell wall-bound polyphenols than the other regional coffees (). Notably, coffee samples from Northwest, West and South did not show any significant difference in their mean contents of soluble and cell wall-bound polyphenols. This is due to the large variation that existed within a region that masked the variance among the mean phenolic contents of regional coffees. For example, soluble polyphenol contents (mg GAE g−1 dry weight) varied between 28.4–43.6 in South, 29.7–36.8 in Northwest and 30.9–40.7 in West samples.
Figure 2. Bar graph showing the mean concentration of total soluble polyphenols (mg GAE g−1), cell wall-bound polyphenols (mg GAE g−1) and flavonoids (mg CE g−1) in green coffee beans from the four regions studied. Data are on the basis of dry mass of coffee. Error bars represent the 95% confidence intervals around the mean
The presence of significant differences among the mean polyphenol contents of green coffee beans from the eight coffee types () was also tested using one-way ANOVA. Regarding soluble polyphenols, the highest concentration was determined in Jimma coffee (average 38.5 mg GAE g−1), while the lowest was recorded for Harar coffee (average 29.4 mg GAE g−1). Additionally, Harar coffee contained significantly lower concentrations of cell wall-bound polyphenols (average 10.1 mg GAE g−1) than the other coffee types (average 11.7–12.8 mg GAE g−1). Despite the health benefits, a high content of polyphenols is said to have negative effects on the beverage quality of coffee.[Citation29] For example, the lower phenolic levels, among others, appear to explain the superiority of Arabica coffee in beverage quality when compared with Robusta coffee. The large difference in phenolic contents of these two species has been considered as a factor responsible for flavor differences between the two species.[Citation27,Citation30] Therefore, the lower concentrations of polyphenols in Harar coffees may have contributed to the widely admired cup-quality of these coffees. Such trend is in agreement with the reported chlorogenic acid composition in these coffee types.[Citation16]
Table 2. The mean, minimum and maximum concentrations of soluble polyphenols (mg GAE g−1), cell wall-bound polyphenols (mg GAE g−1) and flavonoids (mg CE g−1) in green beans of the different sub-regional Arabica coffee types studied
Conclusion
The polyphenol contents of green Arabica coffee beans have been found to vary with geographical origins. Harar coffees that grow in different areas in the eastern region of Ethiopia were found to contain significantly lower amounts of polyphenols than coffees from the other regions. Chlorogenic acids were the major constituents of polyphenols, while flavonoids were found only in trace levels. In addition to those present in the free form, polyphenols were also found in significant amounts bound to the cell wall. This calls for the inclusion of the cell wall-bound ones when reporting data on the total polyphenol content of coffee beans in particular and plant materials in general.
Acknowledgments
The authors thank the Ethiopia Commodity Exchange for providing many of the samples used in this study. The authors declare that they have no competing interests. The data sets used and analyzed during the study are available to readers as in the manuscript. There are no additional data with the authors. All the data are included in the manuscript.
Additional information
Funding
References
- Krol, K.; Gantner, M.; Tatarak, A.; Hallmann, E. The Content of Polyphenols in Coffee Beans as Roasting, Origin and Storage Effect. Eur. Food Res. Technol. 2019. DOI: https://doi.org/10.1007/s00217-019-03388-9.
- Mehari, B.; Redi-Abshiro, M.; Chandravanshi, B. S.; Combrinck, S.; McCrindle, R. Characterization of the Cultivation Region of Ethiopian Coffee by Elemental Analysis. Anal. Lett. 2016, 49, 2474–2489. DOI: https://doi.org/10.1080/00032719.2016.1151023.
- Martin, M. J.; Pablos, F.; González, A. G. Discrimination between Arabica and Robusta Green Coffee Varieties according to Their Chemical Composition. Talanta. 1998, 46(6), 1259–1264. DOI: https://doi.org/10.1016/S0039-9140(97)00409-8.
- Kamiloglu, S. Authenticity and Traceability in Beverages. Food Chem. 2019, 277, 12–24. DOI: https://doi.org/10.1016/j.foodchem.2018.10.091.
- Mehari, B.; Redi-Abshiro, M.; Chandravanshi, B. S.; Combrinck, S.; McCrindle, R.; Atlabachew, M. GC-MS Profiling of Fatty Acids in Green Coffee (Coffea Arabica L.) Beans and Chemometric Modeling for Tracing Geographical Origins from Ethiopia. J. Sci. Food Agric. 2019, 99, 3811–3823. DOI: https://doi.org/10.1002/jsfa.9603.
- Endaye, M.; Atlabachew, M.; Mehari, B.; Alemayehu, M.; Ayalew, D.; Kerisew, B. Combining Multi Element Analysis with Statistical Modeling for Tracing the Origin of Green Coffee Beans from Amhara Region, Ethiopia. Biol. Trace Elem. Res. 2019. DOI: https://doi.org/10.1007/s12011-019-01866-5.
- Amamo, A. A. Coffee Production and Marketing in Ethiopia. Eur. J. Bus. Manag. 2014, 6, 109–121.
- Kufa, T.; Ayano, A.; Yilma, A.; Kumela, T.; Tefera, W. The Contribution of Coffee Research for Coffee Seed Development in Ethiopia. E3 J. Agric. Res. Dev. 2011, 1, 9–16.
- Mehari, B.; Redi-Abshiro, M.; Chandravanshi, B. S.; Combrinck, S.; Atlabachew, M.; McCrindle, R. Simultaneous Determination of Alkaloids in Green Coffee Beans from Ethiopia: Chemometric Evaluation of Geographical Origin. Food Anal. Methods. 2016, 9, 1627–1637. DOI: https://doi.org/10.1007/s12161-015-0340-2.
- Zujko, M. E.; Witkowska, A. M. Antioxidant Potential and Polyphenol Content of Selected Food. Int. J. Food Prop. 2011, 14(2), 300–308. DOI: https://doi.org/10.1080/10942910903176584.
- Tsao, R. Chemistry and Biochemistry of Dietary Polyphenols. Nutrients. 2010, 2, 1231‒1246. DOI: https://doi.org/10.3390/nu2121231.
- Suárez, S.; Mu, T.; Sun, H.; Añón, M. C. Antioxidant Activity, Nutritional, and Phenolic Composition of Sweet Potato Leaves as Affected by Harvesting Period. Int. J. Food. Prop. 2020, 23(1), 178–188. DOI: https://doi.org/10.1080/10942912.2020.1716796.
- Crozier, A.; Clifford, M. N.; Ashihara, H. Plant Secondary Metabolites: Occurrence, Structure and Role in the Human Diet, 1st ed; Blackwell: Oxford, UK, 2006; pp 1–22.
- Quideau, S.; Deffieux, D.; Douat-Casassus, C.; Pouysegu, L. Plant Polyphenols: Chemical Properties, Biological Activities, and Synthesis. Angew. Chem. Int. Ed. 2011, 50, 586–621.
- Fang, Z.; Zhang, Y.; Lu, Y.; Mab, G.; Chen, J.; Liu, D. Phenolic Compounds and Antioxidant Capacities of Bayberry Juices. Food Chem. 2009, 113, 884–888. DOI: https://doi.org/10.1016/j.foodchem.2008.07.102.
- Mehari, B.; Redi-Abshiro, M.; Chandravanshi, B. S.; Combrinck, S.; Atlabachew, M.; McCrindle, R. Profiling of Phenolic Compounds Using UPLC–MS for Determining the Geographical Origin of Green Coffee Beans from Ethiopia. J. Food Compos. Anal. 2016, 45, 16–25. DOI: https://doi.org/10.1016/j.jfca.2015.09.006.
- Naczk, M.; Shahidi, F. Phenolics in Cereals, Fruits and Vegetables: Occurrence, Extraction and Analysis. J. Pharm. Biomed. Anal. 2006, 41, 1523–1542. DOI: https://doi.org/10.1016/j.jpba.2006.04.002.
- Cheynier, V. Polyphenols in Foods are More Complex than Often Thought. Am. J. Clin. Nutr. 2005, 81, 223–229. DOI: https://doi.org/10.1093/ajcn/81.1.223S.
- de Ascensao, A. R.; Dubery, I. A. Soluble and Wall-Bound Phenolics and Phenolic Polymers in Musa Acuminata Roots Exposed to Elicitors from Fusarium Oxysporum F. Sp. Cubense. Phytochem. 2003, 63(6), 679–686. DOI: https://doi.org/10.1016/S0031-9422(03)00286-3.
- Sakanaka, S.; Tachibana, Y.; Okada, Y. Preparation and Antioxidant Properties of Extracts of Japanese Persimmon Leaf Tea (Kakinoha-cha). Food Chem. 2005, 89, 569–575. DOI: https://doi.org/10.1016/j.foodchem.2004.03.013.
- Seifu, T.; Mehari, B.; Atlabachew, M.; Chandravanshi, B. S. Polyphenolic Content and Antioxidant Activity of Leaves of Urtica Simensis Grown in Ethiopia. Latin Am. Appl. Res. 2017, 47, 35–40.
- Bertrand, B.; Villarreal, D.; Laffargue, A.; Posada, H.; Lashermes, P.; Dussert, S. Comparison of the Effectiveness of Fatty Acids, Chlorogenic Acids, and Elements for the Chemometric Discrimination of Coffee (Coffea Arabica L.) Varieties and Growing Origins. J. Agric. Food Chem. 2008, 56, 2273–2280. DOI: https://doi.org/10.1021/jf073314f.
- Kreicbergs, V.; Dimins, F.; Mikelsone, V.; Cinkmanis, I. Biologically Active Compounds in Roasted Coffee. Proceedings of The 6th Baltic Conference on Food Science and Technology FOODBALT 2011. Innovations for Food Science and Production, Jelgava, Latvia, 2011; pp 110–115. https://llufb.llu.lv/conference/foodbalt/2011/FOODBALT-Proceedings-2011-110-115.pdf.
- Vignoli, J. A.; Bassoli, D. G.; Benassi, M. T. Antioxidant Activity, Polyphenols, Caffeine and Melanoidins in Soluble Coffee: The Influence of Processing Conditions and Raw Material. Food Chem. 2011, 124, 863–868. DOI: https://doi.org/10.1016/j.foodchem.2010.07.008.
- Hecimovic, I.; B-Cvitanovic, A.; Horzic, D.; Komes, D. Comparative Study of Polyphenols and Caffeine in Different Coffee Varieties Affected by the Degree of Roasting. Food Chem. 2011, 129, 991–1000. DOI: https://doi.org/10.1016/j.foodchem.2011.05.059.
- Balasundram, N.; Sundram, K.; Samman, S. Phenolic Compounds in Plants and Agri-Industrial By-Products: Antioxidant Activity, Occurrence, and Potential Uses. Food Chem. 2006, 99, 191–203. DOI: https://doi.org/10.1016/j.foodchem.2005.07.042.
- Ignat, I.; Volf, I.; Popa, V. I.; Critical, A. Review of Methods for Characterisation of Polyphenolic Compounds in Fruits and Vegetables. Food Chem. 2011, 126, 1821–1835. DOI: https://doi.org/10.1016/j.foodchem.2010.12.026.
- L-Lutz, D.; Dettmann, J.; Nimalaratne, C.; Schieber, A. Characterization and Quantification of Polyphenols in Amazon Grape (Pourouma Cecropiifolia Martius). Molecules. 2010, 15, 8543–8552. DOI: https://doi.org/10.3390/molecules15128543.
- Farah, A.; Monteiro, M. C.; Calado, V.; Franca, A.; Trugo, L. C. Correlation between Cup Quality and Chemical Attributes of Brazilian Coffee. Food Chem. 2006, 98, 373–380. DOI: https://doi.org/10.1016/j.foodchem.2005.07.032.
- Alonso-Salces, R. M.; Serra, F.; Reniero, F. Botanical and Geographical Characterization of Green Coffee (Coffea Arabica and Coffea Canephora): Chemometric Evaluation of Phenolic and Methylxanthine Contents. J. Agric. Food Chem. 2009, 57, 4224–4235. DOI: https://doi.org/10.1021/jf8037117.