
 ?Mathematical formulae have been encoded as MathML and are displayed in this HTML version using MathJax in order to improve their display. Uncheck the box to turn MathJax off. This feature requires Javascript. Click on a formula to zoom.
ABSTRACT
This study aims to analyze the potential of the computer vision (CV) approach to classify eight canola varieties. The input images of eight canola varieties were CON-I, CON-II, CON-III, Pakola, Canola Raya, Rainbow, PARC Canola Hybrid, and Tarnab-III. A digital camera acquired these images on an open sunny day without any complex laboratory setup. First-order histogram features, second-order statistical texture features, binary features, spectral features of three bands were, blue (B), green (G), and red (R), were employed in the artificial neural network (ANN). A 10-fold stratified cross-validation method was used for classification. The best results with accuracy ranging from 95% to 98% observed when the data of regions of interest (512 × 512) deployed to the classifier.
INTRODUCTION
Identification of seeds, such as wheat, maize, rice, rye, etc., is generally used for better food processing, storage, marketing, healthy crop yield, and disease immunity.[Citation1] Usually, grains of any crop contain different outliers such as stones, weeds, debris, damaged kernels, and inert matters. It is mandatory to separate these outliers for quality assurance. Moreover, for grading purposes, it is essential to quantify these impurities in grains. Conventionally, seed grading and identification are performed by the experts through visual inspection. Human perceptions subjected to different parameters, such as domain knowledge, shape, size, color, patterns, etc., are prone to the work burden and fatigue. Hence, the approach for grain identification becomes inconsistent, unreliable, and incredible.[Citation2–4] In this situation, this study was conducted to develop an efficient and robust system, which is free from all the above-discussed limitations. Canola is an essential crop of edible seeds and containing lower erucic acid and glucosinolate. After oil extraction, the canola residual is used as a source of protein for animal feed. Its green leaves are used as a vegetable. Due to small size and similar physical parameters, the identification of canola varieties by conventional approaches was a difficult task.[Citation5–7] In this study, computer vision (CV) was used to develop an automated seed classification system to classify eight canola varieties. For this study, we tried to achieve these objectives: i) The canola seed raw image acquisition, ii) Multi-features were extracted from the pre-processed image and fused features using a linear combination, iii) Optimized these fused features and deployed them to machine learning classifiers, and finally acquired appropriate accuracy results.
LITERATURE REVIEW
During the last few decades, machine vision systems have inspired researchers to overcome these issues associated with human visual perception.[Citation8] According to a literature survey, such methods have already been employed for crop classification, [Citation8–13] land cover classification, and medical image analysis, [Citation14–16] etc., successfully. Many researchers used machine vision approaches to classify different seed varieties, such as corn seeds are sorted out as damaged, healthy and defective kernels by Valiente-Gonzalez et al., with an accuracy of 90%.[Citation17] Eleven barley varieties are identified using shape, color, and texture-based features by Szczypiński and coauthors. They used linear discriminant analysis (LDA) and principal component analysis (PCA) for optimal feature dataset selection. A three-layer neural network model is used to classify the barley varieties with an accuracy of 67% to 86%.[Citation18] With his fellows, Shahid identified the five wheat varieties by merging three feature selection techniques and acquired almost more than 95% accuracy when a dataset of 26 optimized features is deployed to the artificial neural networks (ANN).[Citation19] Dubey and his companions differentiated three wheat varieties based on 45 morphological features and achieved an accuracy ranging from 84% to 94% for the individual types by implementing the ANN classifier.[Citation20] Similarly, Hernandez & Gil classified the wheat and barley seed grains by extracting color, statistical and morphological features with an overall accuracy of 99%.[Citation21] With his co-researcher, Paliwal correctly identified the different seed varieties, such as wheat, barley, oats, and rye by applying Fourier transformed on color features and achieved an accuracy varying from 92% to 100% of all individual varieties.[Citation22] With computer vision implementation, Kurtulmus discriminated eight pepper seed varieties, using texture, shape, and color features. A total of 257 features are extracted with a linear feature selection technique and used to get the 10 most significant features. These features are deployed to a multilayer perceptron with 30 neurons in the hidden layer. They reported an average accuracy of 84.94%[Citation23] by deploying texture, color, and geometrical features data as input to an ANN classifier by Granitto et al. identified weed kernels. The output accuracy of their system ranges from 90% to 100%.[Citation24] Chen et al. differentiated corn varieties by implementing similar features by Mahalanobis Distance Discriminant (MDD) & back propagation neural network (BPNN) classifiers. They received more than 90% accuracy by the proposed system.[Citation25] Ropelewska, with his fellows, correctly discriminated winter and spring open-pollinated four varieties of rapeseed by extracting different features. Artificial neural network (ANN) classifier had been employed and acquired the highest accuracy for texture and physical properties, 82–87%, and 89–92%, respectively. Similarly, observed total validation for geometric and physical properties, 75% and 91–92%, respectively.[Citation26] Corn six varieties were correctly identified using the machine vision approaches and achieved 98.93% overall accuracy.[Citation13] As reflected from the cited literature, most of the published research work mainly focuses on the classification of kernels, such as barley, oats, corn, maize, wheat, and similar using a large number of textures, morphological, and color features. As discussed above literature, a little work on the recognition and identification of canola varieties is cited in the literature. This study will provide an accurate, robust, and efficient canola varietal discrimination technique for growers and farmers to produce a quality crop from sowing to harvesting stage.
MATERIALS AND METHODS
Seed samples
For this study, eight pure canola varieties, CON-I, CON-II, CON-III, Pakola, Canola Raya, Rainbow, PARC Canola Hybrid, and Tarnab-III collected from Punjab Seed Corporation Lahore (Pakistan). Experimentation on an equally weighted of 20 g of canola seed for each variety performed. A digital camera acquired images of the varieties mentioned above, ‘NIKON’; model COOLPIX with 10.1-megapixel resolutions. All digital images were acquired at two feet height of the still mounted camera. To fulfill the circumstances, we selected this height because the statistical texture analysis method best resulted in fine textures. Twenty images of each variety with the dimensions of 4190 × 3010 pixels with the 24-bit depth of the Joint Photographic Expert Group (jpg) format were acquired in sunlight under a clear sky at noontime (01:00 PM to 02:00 PM). This study is unique because all the experimentation is performed naturally without any complex laboratory setup. shows the sample image of each variety.
Figure 1. Digital images of eight canola varieties
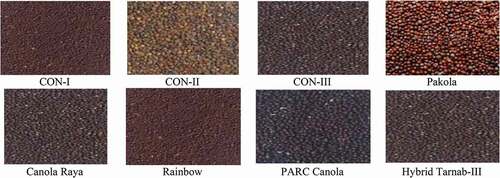
Image processing
For only the seed images portion, each image was cropped using Picture manager software, available in MS-Office. All cropped 160 (8 × 20) images of the same size were converted into grayscale (8bit) and stored in bitmap (.bmp) format. For canola seed dataset’s features enhancement purpose, 10 non-overlapping regions of interest ROIs having pixel dimensions 32 × 32, 64 × 64, 128 × 128, 256 × 256, and 512 × 512 were developed for each image, and 200 (20 × 10) ROIs for each variety was developed. In this way, a total of 1600 (200 × 8) ROIs or sub-images were created for all these eight canola varieties. For experimentation, a computer vision and image processing (CVIP) software version 3.6.12 with Weka data mining tool was used to accomplish this research work.
Methodology
The proposed methodology is described in this section. It comprises these steps; namely, image acquisition, image pre-processing, multi-feature extraction, feature reduction, and finally, classification. A new segmentation technique successfully employed called the Range Oriented Pixel-based Segmentation (ROPS) Algorithm, as presented in .
Figure 2. Range Oriented Pixel-based Segmentation (ROPS) Algorithm
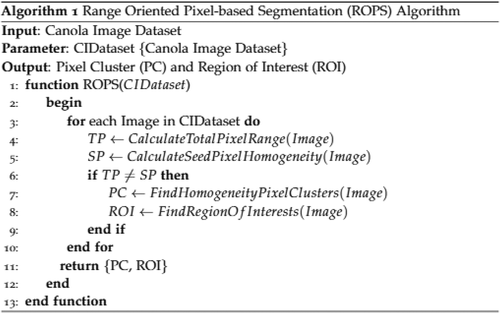
Range oriented pixel-based segmentation (ROPS) algorithm
The Range Oriented Pixel-based Segmentation (ROPS) technique was applied to compute the homogenous pixels cluster region. The total pixel values (TP) were compared to a particular threshold value by considering a unique cluster of that image. This threshold level was used as a base or seed pixel value (SP) to constitute the cluster. All neighboring pixels were compared, and the whole image pixels were counted to make the clusters. Finally, it was observed that if the range value of (TP) was found equal to the (SP), then consider it a homogenous pixel cluster region (PC) and grow up the whole cluster by considering its region of interest (ROI).
Different manual, semi-automated and automated techniques are present for the extraction of ROIs. Automated ROI extraction is normally based on image segmentation, but no single technique exists for ideal segmentation.[Citation27] While on the other hand, manual and semi-automated techniques are based on expert opinion. It shows that human-based extraction has its limitations.[Citation28] This problem was solved by employing the region-oriented pixel-based segmentation (ROPS) algorithm. Different canola seed varieties were spread on a white paper sheet, and to get the only proper seed portion and to hide the background white paper portion, we implemented the ROPS algorithm.
Feature extraction
For this study, different features were acquired, namely, first-order histogram, second-order histogram (texture), binary and spectral features for each (ROIs).[Citation29] For texture features, an average value was acquired for each extracted feature. In contrast, accumulative three spectral band values, namely, blue(B), green(G), and red(R), up to three rings and sectors, were also acquired. In this way, a total of 50 features were extracted for each ROI. Each ROI composed of; five first-order histograms, while five texture features with five average texture values in all four dimensions and 28 binary features including 10 height and 10 widths normalized projected values and six spectral features of three rings and three sectors with an additional average value of these spectral features.[Citation30] Statistically, it means that input data presented in 80000 (1600 × 50) features vector space for each size of the canola image dataset and the feature reduction procedure employed for optimal feature dataset, discussed in the feature reduction section.
Feature Reduction: Feature reduction is considered the most prominent part of the machine learning process. The most relevant features are selected in the feature reduction process, and the least pertinent features are removed.[Citation31] Before classification, it was shown that the extracted 50 features for each image were not equally crucial for canola varieties classification, and to handle this calculated large-scale dataset, that was, 80000 multi-feature data space was not such an easy task. It is necessary to reduce the extracted feature vector space.[Citation32] For this purpose, a supervised feature selection technique called correlation-based feature selection (CFS) was employed on this dataset. The CFS was the ability to extract the most prominent features in the dataset. CFS is described in EquationEquation (1)(1)
(1) .
Here, it shows the heuristic “merit” of a feature subset with
features, while
shows the mean feature-class correlation
, and
is the average feature inter-correlation. The numerator of Equationequation (1)
(1)
(1) describes how within-class features are predictive while the denominator offers feature redundancy. When CFS was deployed on the original feature space, then a reduced dimensionality of 15 features for each ROI was acquired for further processing. The reduced dimension feature space is described in . Finally, 80000 (1600 × 50) multi-features vector space reduced to 24000 (1600 × 15) CFS-based dataset for each size of ROIs for varietal discrimination of canola, and this optimized multi-feature dataset deployed to an artificial neural network (ANN) classifier.
Table 1. Correlation-based Feature Selection (CFS) Table
Classification
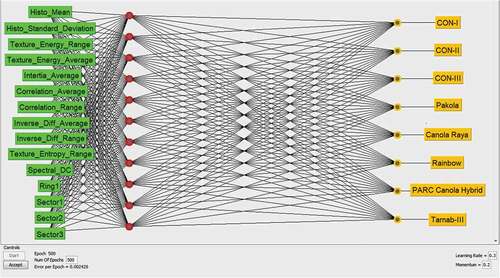
For this study, the supervised classification algorithm, a Single Layer Artificial Neural Network (ANN), was employed because of two reasons: (1) predefined eight canola seed varieties, (2) noisy input data, which is acquired in the natural environment.[Citation33] First of all, the dataset for training and testing purposes is defined in the results section. The (ANN) architecture for the deployed multi-feature dataset on canola seed varieties has been described in , and a comprehensive canola seed varieties classification framework is described in . In addition, the implemented (ANN) architecture for eight canola seed varieties with all tuning parameters has been shown in detail, in .
Table 2. Employed ANN architecture for multi-feature dataset on canola seed varieties
Figure 3. The canola seed classification framework
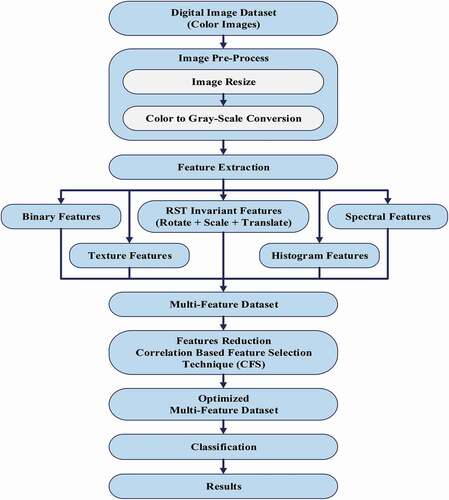
Figure 4. The ANN model for eight canola seed varieties
Dataset
For classification, a 10-fold stratified cross-validation method was used for training and testing purposes. A total of 1600 canola seed images dataset was used to develop an optimized (24000) multi-feature data space and divided into 10 equal folds data instances of eight canola varieties. Each fold comprises almost 240 features dataset of eight canola seed varieties with similar proportions. It was trained on the union of ninefold dataset and test on the remaining one dataset for each iteration. This process will be completed till on the last iteration and calculate the overall accuracy of 10-folds.
RESULTS AND DISCUSSION
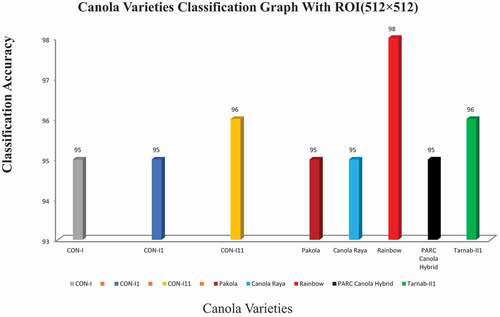
This study aims to identify the different canola seed varieties using computer vision techniques and compare the results with ground truth data. For this purpose, different sizes of ROIs were developed for experimental data. A limited number of the first-order histogram, second-order textural, binary, and spectral features calculated for quick, accurate, and robust results for eight canola seed varieties. At the first attempt, data acquired from ROIs such as 32 × 32, 64 × 64, and 128 × 128 deployed to the ANN classifier as input and observed that the classification results for these ROIs were not so impressive due to the very small size of ROIs which were less than 60%.[Citation34] Similarly, for ROI (256 × 256), some improvement in classification results were observed, which were 75% to 84% in these eight canola varieties; these overall accuracy results presented in the confusion matrix in summarized in . The system performance (classification results) for eight canola varieties based on hybrid features data extracted ROIs 256 × 256 was described graphically in . The classification accuracy rates of these eight varieties, CON-I, CON-II, CON-III, Pakola, Canola Raya, Rainbow, PARC Canola Hybrid, and Tarnab-III, were 79%, 75%, 80%, 81%, 83%, 77%, 84%, and 82%, respectively. The variations in classification accuracy were observed due to the difference in these extracted features .[Citation35] It noted that the classification results for ROIs (256 × 256) were not so promising; hence, the same strategy employed in the third attempt for the data extracted from ROI (512 × 512) and received the best results with an accuracy range from 95% to 98%. The output results are summarized in . The confusion of graph of these eight canola varieties for ROI (512 × 512) is summarized in . The classification/identification accuracy of the eight varieties; CON-I, CON-II, CON-III, Pakola, Canola Raya, Rainbow, PARC Canola Hybrid and Tarnab-III are 95%, 95%, 96%,9 5%, 95%, 98%, 95% and 96%, respectively. During the third and final attempt, five canola varieties were identified with an accuracy of 95% and two 96%, while one variety, “Rainbow,” got a maximum of 98% classification accuracy, shown in . Finally, a comparison between the proposed and current techniques are shown in .
Table 3. Confusion Matrix for canola varieties classification with ROI (256 ×256)
Table 4. Confusion Matrix for canola varieties classification with ROI (512 ×512)
Table 5. A comparison between the proposed and current techniques
Figure 5. Canola Varieties Confusion Graph for ROI (256 ×256)
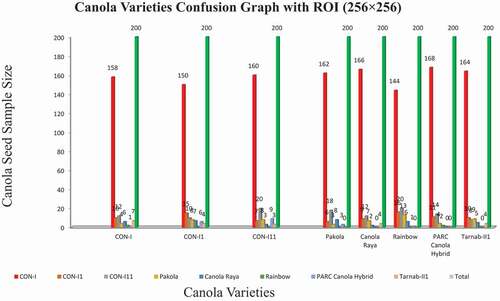
Figure 6. Canola varieties classification graph with ROI (256 ×256)
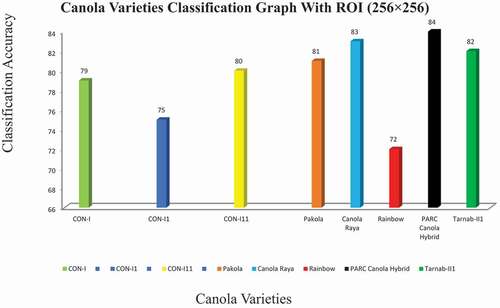
Figure 7. Canola Varieties Confusion Graph for ROI (512 ×512)
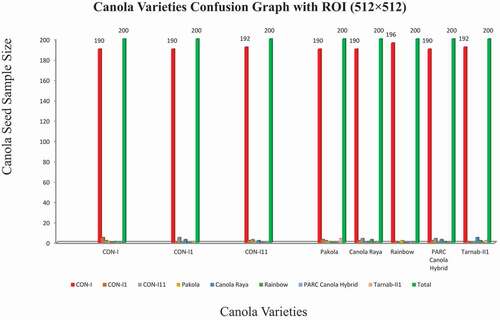
Figure 8. Canola varieties classification graph with ROI (512 ×512)
Limitations of existing system
The existing system has some limitations because all the experimentation was performed with eight canola seed varieties under natural environment with an imaging tool of a 10.1 mega-pixel digital NIKON camera.
Future work
In the future, this study will be conducted to identify the anomalies detection in canola seed varieties. All the experimentation will be performed in a controlled environment with better imaging modalities. Different deep learning models will be used to acquire better performance and accuracy in the agriculture domain.
CONCLUSION
A classification method is developed to identify the eight canola seed varieties based on a computer vision approach using multi-features, including first-order histogram, second-order statistical texture, binary and spectral features from the bulk images of canola seeds. A large feature dataset was developed, and these features were deployed to ANN classifier, with a 10-fold stratified cross-validation method. Some limitations include color digital images, an open sunny environment, and manual selection of input seed varieties to construct image datasets. All the experimentation was performed in the natural environment using a simple computer with a digital camera. Very promising classification results with an accuracy almost varying from 95% to 98% for the said eight canola varieties were achieved. Finally, it may be concluded that in this study, the classification accuracy results of canola seed varieties are higher as compared to the results reported in the literature for different seed varieties.
Acknowledgments
We are highly thankful to the Department of Information Technology, The Islamia University of Bahawalpur, Pakistan, especial thanks to Dr. Furqan Qadri from Shenzhen university china’s school of computer science & software engineering and all our research fellows. The authors declare no conflict of interest.
References
- Hulasare, R. B.; Jayas, D. S.; Dronzek, B. L. Grain Grading Systems. In Handbook of Postharvest Technology-Cereals, Fruits, Vegetables, Tea, and Spices; Chakraverty A., Majumdar A.S., Raghavan G.S.V., Ramaswamy H.S. (Eds). Marcel Dekker, Inc: New York, NY, 2003; pp 41–55.
- Sharif, M.; Khan, M. A.; Iqbal, Z.; Azam, M. F.; Lali, M. I. U.; Javed, M. Y. Detection and Classification of Citrus Diseases in Agriculture Based on Optimized Weighted Segmentation and Feature Selection. Comput. Electron. Agric. 2018, vol. 150, 220–234. DOI: https://doi.org/10.1016/j.compag.2018.04.023.
- Iqbal, Z.; Khan, M. A.; Sharif, M.; Shah, J. H.; Ur Rehman, M. H.; Javed, K. An Automated Detection and Classification of Citrus Plant Diseases Using Image Processing Techniques: A Review. Comput. Electron. Agric. 2018, 153, 12–32. DOI: https://doi.org/10.1016/j.compag.2018.07.032.
- Khan, M. A.; Akram, T.; Sharif, M.; Awais, M.; Javed, K.; Ali, H.; Saba, T. CCDF: Automatic System for Segmentation and Recognition of Fruit Crops Diseases Based on Correlation Coefficient and Deep CNN Features. Comput. Electron. Agric. 2018, 155, 220–236. DOI: https://doi.org/10.1016/j.compag.2018.10.013.
- Khan, M. A.; Lali, M. I. U.; Sharif, M.; Javed, K.; Aurangzeb, K.; Haider, S. I.; Altamrah, A. S.; Akram, T. An Optimized Method for Segmentation and Classification of Apple Diseases Based on Strong Correlation and Genetic Algorithm Based Feature Selection. IEEE Access. 2019, 7, 46261–46277. DOI: https://doi.org/10.1109/ACCESS.2019.2908040.
- Rauf, H. T.; Saleem, B. A.; Lali, M. I. U.; Khan, M. A.; Sharif, M.; Bukhari, S. A. C. A Citrus Fruits and Leaves Dataset for Detection and Classification of Citrus Diseases through Machine Learning. Data Brief. 2019, 26, 104340. DOI: https://doi.org/10.1016/j.dib.2019.104340.
- Safdar, A.; Khan, M. A.; Shah, J. H.; Sharif, M.; Saba, T.; Rehman, A.; Javed, K.; Khan, J. A. Intelligent Microscopic Approach for Identification and Recognition of Citrus Deformities. Microsc. Res. Tech. 2019, 82(no. 9), 1542–1556. DOI: https://doi.org/10.1002/jemt.23320.
- Shifa, M. S.; Naweed, M. S.; Omar, M.; Jhandir, M. Z.; Ahmed, T. Classification of Cotton and Sugarcane Plants on the Basis of Their Spectral Behavior. Paki. J. Bot. 2011, 43(no. 4), 2119–2125.
- Rehmani, E.; Naweed, M.; Shahid, M.; Qadri, S.; Ullah, M.; Gilani, Z. A Comparative Study of Crop Classification by Using Radiometric and Photographic Data. Sindh Univer. Res. J-SURJ (Science Series). 2015, 47(2), 335-340.
- Khamparia, A.; Saini, G.; Gupta, D.; Khanna, A.; Tiwari, S.; De Albuquerque, V. H. C. Seasonal Crops Disease Prediction and Classification Using Deep Convolutional Encoder Network. Circuits, Systems, and Signal Processing. 2020, 39(no. 2), 818–836. DOI: https://doi.org/10.1007/s00034-019-01041-0.
- Aurangzeb, K.; Akmal, F.; Khan, M. A.; Sharif, M.; Javed, M. Y. Advanced Machine Learning Algorithm Based System for Crops Leaf Diseases Recognition. 2020. 6th Conference on Data Science and Machine Learning Applications (CDMA), Riyadh, Saudi Arabia, 2020, pp.146-151.
- Argüeso, D.; Picon, A.; Irusta, U.; Medela, A.; San-Emeterio, M. G.; Bereciartua, A.; Alvarez-Gila, A. Few-Shot Learning Approach for Plant Disease Classification Using Images Taken in the Field. Comput. Electron. Agric. 2020, 175, 105542. DOI: https://doi.org/10.1016/j.compag.2020.105542.
- Ali, A.; Qadri, S.; Mashwani, W. K.; Belhaouari, S. B.; Naeem, S.; Rafique, S.; Jamal, F.; Chesneau, C.; Anam, S. Machine Learning Approach for the Classification of Corn Seed Using Hybrid Features. Int. J. Food Prop. 2020, 23(no. 1), 1110–1124. DOI: https://doi.org/10.1080/10942912.2020.1778724.
- Eklund, A.; Dufort, P.; Forsberg, D.; LaConte, S. M. Medical Image Processing on the GPU – Past, Present and Future. Med. Image Anal. 2013, 17(no. 8), 1073–1094.
- Strzelecki, M.; Szczypinski, P.; Materka, A.; Klepaczko, A. A Software Tool for Automatic Classification and Segmentation of 2D/3D Medical Images. Nuclear Instruments and Methods in Physics Research Section A: Accelerators, Spectrometers, Detectors and Associated Equipment. 2013, A(no. 702), 137–140. DOI: https://doi.org/10.1016/j.nima.2012.09.006.
- Boss, R. S. C.; Thangavel, K.; Daniel, D. A. P. Mammogram Image Segmentation Using Fuzzy Clustering. International Conference on Pattern Recognition, Informatics and Medical Engineering (PRIME-2012), Salem, India, 2012: pp.290-295.
- Valiente-Gonzalez, J. M.; Andreu-Garcia, G.; Potter, P.; Rodas-Jorda, A. Automatic Corn (Zea Mays) Kernel Inspection System Using Novelty Detection Based on Principal Component Analysis. Biosyst. Eng. 2014, 117, 94–103. DOI: https://doi.org/10.1016/j.biosystemseng.2013.09.003.
- Szczypiński, P. M.; Klepaczko, A.; Zapotoczny, P. Identifying Barley Varieties by Computer Vision. Comput. Electron. Agric. 2015, 110, 1–8. DOI: https://doi.org/10.1016/j.compag.2014.09.016.
- Shahid, M.; Naweed, M. S.; Qadri, S.; Mutiullah,; Rehmani, E. A. Varietal Discrimination of Wheat Seeds by Machine Vision Approach. Life Sci. J. 2014, 11(no. 6), 245–252.
- Dubey, B.; Bhagwat, S.; Shouche, S.; Sainis, J. Potential of Artificial Neural Networks in Varietal Identification Using Morphometry of Wheat Grains. Biosyst. Eng. 2006, 95(no. 1), 61–67. DOI: https://doi.org/10.1016/j.biosystemseng.2006.06.001.
- Guevara-Hernandez, F.; Gil, J. G. A Machine Vision System for Classification of Wheat and Barley Grain Kernels. Spanish J. Agric. Res. 2011, 9(no. 3), 672–680. DOI: https://doi.org/10.5424/sjar/20110903-140-10.
- Paliwal, J.; Shashidhar, N.; Jayas, D. Grain Kernel Identification Using Kernel Signature. Trans. ASAE. 1999, 42(no. 6), 1921. DOI: https://doi.org/10.13031/2013.13357.
- Kurtulmuş, F.; Alibaş, İ.; Kavdır, I. Classification of Pepper Seeds Using Machine Vision Based on Neural Network. Int. J. Agric. Biol. Eng. 2016, 9(no. 1), 51–62.
- Granitto, P. M.; Navone, H. D.; Verdes, P. F.; Ceccatto, H. Weed Seeds Identification by Machine Vision. Comput. Electron. Agric. 2002, 33(no. 2), 91–103. DOI: https://doi.org/10.1016/S0168-1699(02)00004-2.
- Chen, X.; Xun, Y.; Li, W.; Zhang, J. Combining Discriminant Analysis and Neural Networks for Corn Variety Identification. Comput. Electron. Agric. 2010, 71, S48–S53. DOI: https://doi.org/10.1016/j.compag.2009.09.003.
- Ropelewska, E.; Zapotoczny, P.; Budzyński, W. S.; Jankowski, K. J. Discriminating Power Of Selected Physical Properties Of Seeds Of Various Rapeseed (Brassica napus L.) cultivars. J. Cereal Sci. 2017, 73, 62–67. DOI: https://doi.org/10.1016/j.jcs.2016.11.012.
- Yang, K.; Zhong, W.; Li, F. Leaf Segmentation and Classification with a Complicated Background Using Deep Learning. Agronomy. 2020, 10(no. 11), 1721. DOI: https://doi.org/10.3390/agronomy10111721.
- Adams, J.; Qiu, Y.; Xu, Y.; Schnable, J. C. Plant Segmentation by Supervised Machine Learning Methods. The Plant Phenome Journal. 2020, 3(no. 1), e20001. DOI: https://doi.org/10.1002/ppj2.20001.
- Haralick, R. M.; Shanmugam, K.; Dinstein, I. H. Textural Features for Image Classification. IEEE Transactions on Systems, Man, and Cybernetics. 1973, SMC-3(no. 6), 610–621. DOI: https://doi.org/10.1109/TSMC.1973.4309314.
- Zhang, J.; Tan, T.; Ma, L. Invariant Texture Segmentation via Circular Gabor Filters. 2002. Object recognition supported by user interaction for service robots, Quebec City, QC, Canada, 2002, pp. 901-904 vol.2
- Khan, M. A.; Akram, T.; Sharif, M.; Javed, K.; Raza, M.; Saba, T. An Automated System for Cucumber Leaf Diseased Spot Detection and Classification Using Improved Saliency Method and Deep Features Selection. Multimedia Tools Appl. 2020, 79, 1–30.
- Duda, R. O.; Hart, P. E.; Stork, D. G. Pattern Classification, 605 Third Avenue; John Wiley & Sons: New York, USA, 2012.
- Park, S. C.; Pu, J.; Zheng, B. Improving Performance of Computer-aided Detection Scheme by Combining Results from Two Machine Learning Classifiers. Acad. Radiol. 2009, 16(no. 3), 266–274. DOI: https://doi.org/10.1016/j.acra.2008.08.012.
- Riedmiller, M.; Braun, H. A Direct Adaptive Method for Faster Backpropagation Learning: The RPROP Algorithm. IEEE International Conference on Neural Networks, San Francisco, CA, USA, 1993, pp. 586-591.
- Zapotocnzy, P.;. Discrimination of Wheat Grain Varieties Using Image Analysis and Multidimensional Analysis Texture of Grain Mass. Int. J. Food Prop. 2014, 17(1), 139–151. DOI: https://doi.org/10.1080/10942912.2011.615085.