
 ?Mathematical formulae have been encoded as MathML and are displayed in this HTML version using MathJax in order to improve their display. Uncheck the box to turn MathJax off. This feature requires Javascript. Click on a formula to zoom.
ABSTRACT
Consumer demands for fresh foods with desired sensory properties. Lack of easy, cheap, and nondestructive methods to control the quality of fruit juices is one of the main challenges in the beverage industry. The present study has examined two types of natural and industrial juices. Machine olfaction with 9 metal oxide semiconductor (MOS) sensors was used for the experiments. Sensor response patterns were analyzed using artificial neural networks (ANN). PCR method was used to evaluate the discrimination power of the sensors. According to the results, the discrimination power of the sensors used in the electronic nose sensor array was determined, three of which were removed due to improper response power. The proposed method can be used to select the minimum and most effective number of MOS gas sensors to construct an electronic nose system to control the olfactory quality of different foods. The use of a minimum number of sensors reduces the cost of constructing an electronic nose system, decreases the volume of the processor data input, and consequently increases the classification accuracy. Therefore, the MOS-based electronic nose combined with the ANN can be an effective and highly efficient tool in the fast and nondestructive classification of pure and industrial fruit juices.
Introduction
Consumers and the beverage industries have considered monitoring the quality and freshness of fruit juices. Receiving significant attention from the consumers due to the nutritional and sensory properties. Quality has become an important issue as consumers gain more awareness of all aspects related to food quality. The customers’ decision to select fruit juices depends on their personal preferences .[Citation1] Industrial fruit juice that has lost its fiber and nutrients is actually a concentrated source of sugar that lacks most of the supplementary nutrients required to facilitate digestion and metabolism. Fruit juice increases blood sugar faster than the whole fruit, and the level of sugar obtained from fruit juice is significantly higher. It is important to note that most fruit juices sold in supermarkets contain only a small percentage of natural fruit juice and usually include added sweeteners. As a result, these juices lead to the intake of large amounts of calories without providing nutrients for the body. Preparing natural homemade juice can almost completely preserve the pulp and skin, so it is useful for human health .[Citation2]
Extensive research has recently focused on the development of nondestructive methods to assess fruit quality properties. In fact, the concept of quality is primarily related to the consumers’ perceptions and preferences for foods. Consumer perception is based on the application of the five senses, which make a “superior” tool to determine the quality .[Citation3] Olfaction is widely used by experts in industries for quality evaluation. This method is costly for the industries, while there are different problems, such as olfaction correct matching, time requirements, variable responses among different people, the subjective response of experts to odors, and the impossibility of applying this method to evaluate hazardous substances. The electronic nose is one of the new methods for food quality control. This system simulates the human sense of smell and offer fast and low-cost information to evaluate the food products freshness as well as monitoring the processes and controlling their quality and uses sensor arrays to detect the effect of odor in the headspace of the samples .[Citation4]
The electronic nose is inspired by the human sense of smell and has been used as an effective tool in the quality assessment of food products. This system consists of a sensor array, a signal processing subsystem, and a pattern recognition module .[Citation5] The sensor array of the electronic nose detects odors, including large amounts of various volatile compounds in the headspace of the sample, after which the output is provided, representing the fingerprint of all sample components. The “fingerprint” described by electronic nose sensors is used to extract potential information about samples based on a suitable algorithm. The electronic nose is an automated nondestructive method, which has become a popular system due to different advantages such as convenient construction, high sensitivity, and cost-effectiveness .[Citation6]
The electronic nose has been widely recommended to monitor the quality of beverages. Among different applications of the electronic nose in various research fields, considerable attention has been to quality control in the juice industries. For example, this technology has been successful in the classification and prediction of different products such as tangerine, [Citation3] pineapple, [Citation7] strawberry juice, [Citation8] apple juice, [Citation9] kiwi juice, [Citation10] mandarin juice, [Citation6] orange juice, [1] tomato juice, [Citation5] and fruit juice spoilage[Citation11] through the flavor monitoring.
Many supervised classification methods such as linear discriminant analysis (LDA), quadratic data analysis (QDA), support vector machines (SVM), and artificial neural networks (ANN) have been used successfully to analyze electronic nose data .[Citation12,Citation13] In general, supervised classification requires labeled data to fit good classification; in other words, labeled data can represent almost the basic structure of the entire data space. However, adequately labeled data require a lot of materials, money, effort, and time. Therefore, it is important to find a classification approach with better performance using limited labeled training data .[Citation5]
Determining the quality of fruits is relatively easy through their morphological properties (such as color, texture, and firmness) and flavor (smell and taste). However, processing fruits to produce juice makes it difficult to determine the quality. For example, it is difficult to realize whether a bottle of juice is made from fresh fruits or not. Therefore, identifying and tracking the quality of natural and fresh juices will be of great importance. The present study has used an electronic nose to evaluate adulteration in natural and industrial juices. Accordingly, four different types of natural juices, including orange, lemon, mango, and strawberry from the industrial type were evaluated.
Materials and methods
Sample preparation
First, four types of fresh fruits, including oranges, lemons, strawberries, and mangoes were purchased from the fruit market in Kermanshah, Iran. The samples were refrigerated until the beginning of the experiments. Then, the fruits were washed and juiced by a juice extractor. The room temperature was controlled at (20 ± 0.5) °C during sample preparation and detection.
All juices available in the Iranian market are fruit concentrate, which contains water and other additives, including citric acid, pectin, ascorbic acid, and natural flavors. This type of fruit juice is sold as natural fruit juice and contains 100% of the fruit content. Sometimes some producers may market this juice as fresh and pure juice. Therefore, 15 pure and 15 industrial samples were prepared for each type of fruit juice, resulting in 120 samples (15 replications × 8 fruit juice groups). Twenty ml of each sample was placed in a 50-ml glass jar at room temperature (23 ± 2) °C for the experiment. The samples were placed in closed containers for 10 minutes to reach the equilibrium state of the headspace.
Electronic nose system
Experiments were performed with an olfactory system made in the Biosystems Engineering Department of the University of Mohaghegh Ardabili. Electronic nose system includes air filter, sample chamber, solenoid valves, pump, sensor array, data collection system, and laptop, schematically presented in [Citation4]:
Figure 1. Schematic of olfactory system used (a) Air filter (Carbone active), (b) Sample compartment, (c) Solenoid valve, (d) Diaphragm pump, (e) Sensor array, (f) Date acquisition card, (g) PC and (h), Air outlet
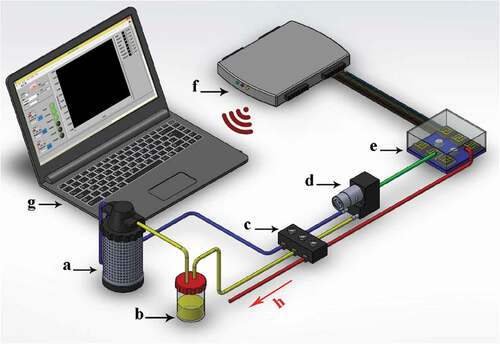
Data were collected from fruit juice samples in three phases of cleaning, measuring, and cleaning the sensors, which took a total time of 300 seconds. In the first phase, the air was pumped into the sensor chamber for 100 seconds so that the response of the sensors reached the baseline, and the system was ready for experiments. During the measurement process, the gaseous compounds of the sample headspace were pumped through a Teflon tube into the sensor array, after passing through the solenoid valves, changing the output voltage ratio of the sensors. The measurement phase lasted 100 seconds, which was long enough for the sensors to reach stable signal values. As shown in , the designed electronic nose system used a combination of 9 metal oxide semiconductor sensors with MQ and TGS trademarks .[Citation14]
Table 1. The used sensors in electronic nose
. The used sensors in electronic nose
The computer stored the output signal data of the sensors during the measurement period, as one data per second. After the measurement process was complete, the obtained data were stored for further analysis. Application of the fraction method aimed to correct the baseline. In this method, the response of the sensors becomes dimensionless in addition to normalization to eliminate noise or possible deviation[Citation4,Citation13]:
In which, Ys (t), Xs (0), and Xs (t) indicate the normalized sensor response, the baseline, and the sensor response, respectively. After each measurement, the filtered air was pumped into the sensor chamber by activated carbon for 100 seconds (cleaning time) from the other port of the device. This phase aimed to discharge the odor of the chamber, bring the sensor response to the baseline, and prepare the system for further experiments. All experiments were performed by the e-nose at ambient temperature (23 ± 2) °C, with air conditioning control.
ANN analysis
Artificial neural network (ANN) is one of the most common methods of artificial intelligence and among the most widely used models of Multilayer Perceptron. In this study, the backpropagation multilayer perceptron algorithm was used to classify and detect fruit juice, using data from the electronic nose as network input. A network consisting of input, output, and hidden layers was used for classifications. Input layer units consisting of data values of 9 sensors were considered as input. shows an artificial neural network structure with two output neurons.
Figure 2. Schematic of multilayer perceptron neural network

EquationEquations (2)(2)
(2) to (6) can be used to determine the number of nodes in the hidden layer:
It is possible to obtain the number of nodes that should be used in the hidden layer based on the number of nodes in the input layer (Ni) and the number of nodes in the output layer (No). The hyperbolic tangent activation function was used for the latent layer. The number of output layer neurons was selected based on the experiment type. Accordingly, training, validation, and experiment allocated 60%, 20%, and 20% to themselves, respectively. The neural network training principally is based on trial and error. Efficiency evaluation is necessary after the training process of the neural network with proper structure. The optimal topology for the mentioned neural network is the highest value for the coefficient of determination of R2 and the lowest for RMSE. The model inputs included data obtained from the response of 9 sensors and the output also included the type of fruit juice. The confusion matrix was used to select the best model. Sensitivity, specificity, accuracy, and precision parameters were used to analyze the system performance[Citation15]:
The weight and importance of each criterion was considered equal to one. Unscrambler X 10.4 and Matlab 2014a software were also used for data analysis.
Results and discussion
E-Nose results
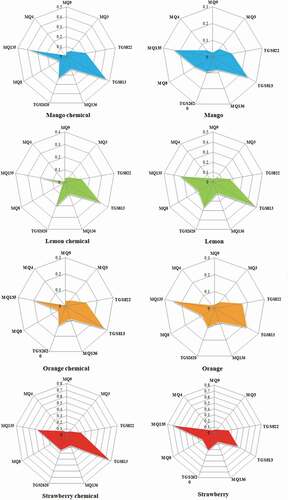
The experiments were performed to identify several types of fruit juices, and especially find the differences between pure and industrial types of juice. In the first step, radar-like plots with a unit radius were used to compare pattern differences (such as fingerprints) in the juice samples. The average response data of the electronic nose sensors collected during the 100 seconds of sample measurement were plotted on a radar graph after normalization (), showing the maximum response for each type of juice. This diagram helps to visualize the differences between typical response patterns easily. As can be seen, there are significant differences and similarities in the fingerprints of fruit juices. As shown in the , there is a difference between pure and industrial samples, with most of the sample odor related to the strawberries in natural and industrial types.
Figure 3. Radar graph response of the sensors for the different types of fruit juices obtained by e-Nose
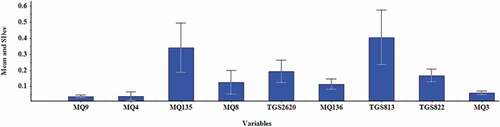
The sensors’ response to the smell pattern of the head space is presented in the form of mean and standard deviation in . As shown in , the highest response was related to MQ135, TGS813 sensors, while the lowest response was related to MQ3-4-8-9 and 136 sensors. Accordingly, the addition of sensors with good differentiation features increases the classification abilities.
Figure 4. Loading plot for PCA analysis for fruit juices
PCR analysis
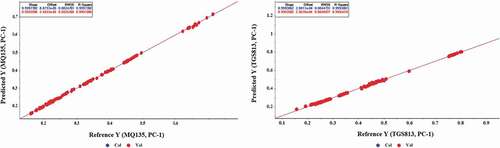
Given the different response power of gas sensors used to classify different samples of fruit juice in this system, the minimum number of sensors can be used by selecting the most effective ones to reduce the production costs of the machine olfaction, reduce the amount of input data to classification algorithms, and increase the classification accuracy. Also, the response power of sensors to different samples of fruit juices was investigated using the PCR method, the results of which are shown in . Considering that PC1 had the highest difference of variance of 76% in the classification of juice samples, it was used as input data of PCR analysis, and the remaining 17% of data related to PC2 was considered as an outlier.
Figure 5. Power of MQ135 and TGS813 sensors response to VOC of different fruit juice samples (PC-1)
summarizes the results of the PCR analysis and the selection of the most effective sensors from the studied gas sensors. The obtained values of R2 were examined to determine the most effective sensors. It is possible to remove the sensors with the discrimination power of because the response of the relevant sensor does not have a direct or acceptable relationship with the change in the type of juice.
Table 2. Summary of PCR analysis results
. Summary of PCR analysis results
The results of the PCR analysis are largely similar to the results of the PCA analysis, both of which showed the MQ135 and TGS813 sensors as the most powerful and MQ9 and MQ3 sensors as the least powerful in the classification of different types of fruit juices. Knowing the response power of each sensor to volatile substances of the tested juices helps determine the different qualitative properties of the fruit juices. Accordingly, it is possible to select the most important and effective sensors with the maximum response to volatile substances in the juice during the construction phase of the electronic nose sensor array. Besides, selecting the sensor with the appropriate response power helps to consider the transient state of the sensor response and reduce the system response time. On the other hand, access to the most important sensors can play a significant role in the data processing phase because sometimes additional variables in the data can lead to some problems such as over-fitting in data analysis.
ANN analysis
The perceptron neural network was used to classify fruit juices. Therefore, 8 classes of the fruit juice based on the pure and industrial types and 2 classes based on the natural and industrial types were evaluated. According to the output data of nine sensors, nine neurons were considered for the input layer, and 8 and 2 neuron layers for the output layer according to the type of experiment. EquationEquations (7)(7)
(7) to (Equation11
(11)
(11) ) were used to determine the number of hidden layer nodes. Log-sigmoid transfer function and Levenberg-Marquardt learning method were used in network training.
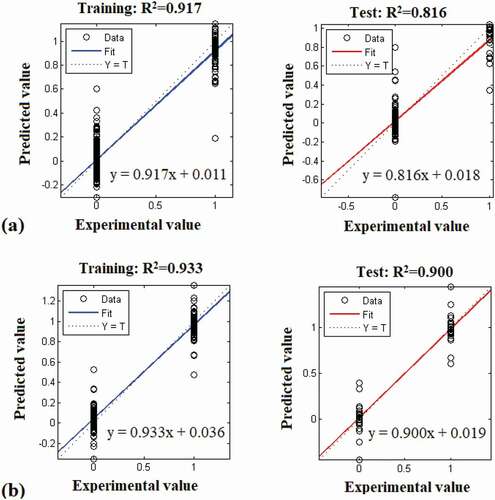
Therefore, the neural network with the 8-8-9 topology had the highest accuracy for classification of all fruit juices, and the values of 0.0244 and 95.8% were obtained for RMSE and R2, respectively. Also, the 9-4-2 topology had the highest accuracy for classification of pure and industrial juices, and the values of RMSE and R2 were 0.0271 and 90.8%, respectively. The performance of the model should be assessed by the test data which were not used before as shown in . According to regression diagram, the proposed model possessed a high accuracy in prediction of the experimental results, in this research, the proximity of the predicted data to the empirical ones (around the regression line) with high R2 indicates the precise evaluation of the ANN in the prediction of these indices.
Figure 6. Correlation plots of the calculated versus the experimental a) all sample, b) pure and industrial sample
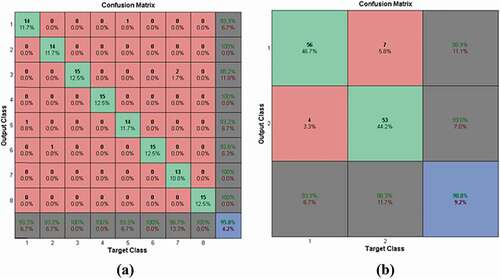
shows the confusion matrix of the classification of the varieties using the selected neural network. According to , the model for classification of all juices (a) and pure and industrial juices (b) had total discrimination of 95.8% and 90.8%, respectively. shows the performance parameters of ANN methods, according to which the accuracy of data classification using ANN methods was 94.4% and 90.9%, respectively. The results of this study were consistent with other studies.
Table 3. Performance parameters of ANN models
Figure 7. Confusion matrix obtained for a) all juices, b) pure and industrial juices
. Performance parameters of ANN models
The results of this study are in agreement with the work of Wei et al (2009) who employed an E-tongue to classify honey samples with different flower and geographical origins. Their results were then analyzed by different pattern recognition techniques of PCA, CA, and ANN. They showed that ANN is the most effective feature extraction method in comparison with CA and PCA methods with a correction level of 95% .[Citation16] These results were also better than the other studies using ANN methods .[Citation17–20]
Conclusion
This study was part of a project to determine the quality and classification of different types of juice based on the main content of their volatiles. Given the use of different types of MOS gas sensors in determining the food quality, the response power of different types of these sensors was evaluated. Accordingly, 9 conventional gas sensors were prepared and installed in an electronic nose system. The signals received from the sensors were then processed using the PCR analys, after which the most suitable sensors were selected. Knowledge of the discrimination power of the sensor array can facilitate decision-making for the selection of the most suitable sensors. Finally, it is concluded that the selected sensor array is effective for the olfaction-based qualitative classification of different types of fruit juice and can be used in the construction of an optimal machine olfaction system. The correlation between the measured and predicted smell parameters of the fruit juice revealed high prediction performance based on the output signals of the E-Nose. The results of this study indicate that E-Nose, in combination with ANN, can be used to determine the adulteration of products with satisfactory results.
Ethical Approval
This article does not contain any studies with human participants or animals performed by any of the authors.
Informed Consent
Not applicable.
Disclosure statement
Hamed Karami declares that she has no conflict of interest and Mansour rasekh declares that he has no conflict of interest
Additional information
Funding
References
- Li, S.; Hu, Y.; Liu, W.; Chen, Y.; Wang, F.; Lu, X.; Zheng, W. Untargeted Volatile Metabolomics Using Comprehensive Two-dimensional Gas Chromatography-mass Spectrometry – A Solution for orange Juice authentication. Talanta. 2020, 217, 121038. DOI: https://doi.org/10.1016/j.talanta.2020.121038.
- Jaffe, R.; Mani, J. Chapter 29 - Polyphenols Evoke Healing Responses: Clinical Evidence and Role of Predictive Biomarkers. In Polyphenols: Mechanisms of Action in Human Health and Disease (Second Edition); Watson, R. R., Preedy, V. R., Zibadi, S., Eds.; Academic Press, 2018; pp 403–413.
- Gómez, A. H.; Wang, J.; Hu, G.; Pereira, A. G. Electronic Nose Technique Potential Monitoring Mandarin Maturity. Sens. Actuators B Chem. 2006, 113(1), 347–353. DOI: https://doi.org/10.1016/j.snb.2005.03.090.
- Karami, H.; Rasekh, M.; Mirzaee –Ghaleh, E. Comparison of Chemometrics and AOCS Official Methods for Predicting the Shelf Life of Edible Oil. Chemom. Intell. Lab. Syst. 2020, 206, 104165. DOI: https://doi.org/10.1016/j.chemolab.2020.104165.
- Hong, X.; Wang, J.; Qi, G. E-nose Combined with Chemometrics to Trace Tomato-juice Quality. J. Food Eng. 2015, 149, 38–43. DOI: https://doi.org/10.1016/j.jfoodeng.2014.10.003.
- Qiu, S.; Wang, J. The Prediction of Food Additives in the Fruit Juice Based on Electronic Nose with Chemometrics. Food Chem. 2017, 230, 208–214. DOI: https://doi.org/10.1016/j.foodchem.2017.03.011.
- Torri, L.; Sinelli, N.; Limbo, S. Shelf Life Evaluation of Fresh-cut Pineapple by Using an Electronic Nose. Postharvest. Biol. Technol. 2010, 56(3), 239–245. DOI: https://doi.org/10.1016/j.postharvbio.2010.01.012.
- Qiu, S.; Wang, J.; Gao, L. Qualification and Quantisation of Processed Strawberry Juice Based on Electronic Nose and Tongue. LWT - Food Sci. Technol. 2015, 60(1), 115–123. DOI: https://doi.org/10.1016/j.lwt.2014.08.041.
- Niu, Y.; Wang, R.; Xiao, Z.; Zhu, J.; Sun, X.; Wang, P. Characterization of Ester Odorants of Apple Juice by Gas Chromatography-olfactometry, Quantitative Measurements, Odour Threshold, Aroma Intensity and Electronic Nose. Food Res. Int. 2019, 120, 92–101. DOI: https://doi.org/10.1016/j.foodres.2019.01.064.
- Luo, Y.; Li, Z.; Yuan, Y.; Yue, T. Bioadsorption of Patulin from Kiwi Fruit Juice onto a Superior Magnetic Chitosan. J. Alloys Compd. 2016, 667, 101–108. DOI: https://doi.org/10.1016/j.jallcom.2016.01.143.
- Gobbi, E.; Falasconi, M.; Concina, I.; Mantero, G.; Bianchi, F.; Mattarozzi, M.; Musci, M.; Sberveglieri, G. Electronic Nose and Alicyclobacillus Spp. Spoilage of Fruit Juices: An Emerging Diagnostic Tool. Food Control.2010, 21(10), 1374–1382. DOI: https://doi.org/10.1016/j.foodcont.2010.04.011.
- Karami, H.; Rasekh, M.; Mirzaee-Ghaleh, E. Qualitative Analysis of Edible Oil Oxidation Using an Olfactory Machine. J. Food Meas. Charact. 2020, 14(5), 2600–2610. DOI: https://doi.org/10.1007/s11694-020-00506-0.
- Karami, H.; Rasekh, M.; Mirzaee-Ghaleh, E. Application of the E-nose Machine System to Detect Adulterations in Mixed Edible Oils Using Chemometrics Methods. J. Food Process. Preserv. 2020, 44(9), e14696. DOI: https://doi.org/10.1111/jfpp.14696.
- Rasekh, M.; Karami, H. Application of Electronic Nose with Chemometrics Methods to the Detection of Juices Fraud. J. Food Process. Preserv. 2021, e15432. DOI: https://doi.org/10.1111/jfpp.15432.
- Basri, K. N.; Hussain, M. N.; Bakar, J.; Sharif, Z.; Khir, M. F. A.; Zoolfakar, A. S. Classification and Quantification of Palm Oil Adulteration via Portable NIR Spectroscopy. Spectrochim. Acta, Part A: Mol. Biomol. Spectrosc. 2017, 173, 335–342. DOI: https://doi.org/10.1016/j.saa.2016.09.028.
- Wei, Z.; Wang, J.; Liao, W. Technique Potential for Classification of Honey by Electronic Tongue. J. Food Eng. 2009, 94(3), 260–266. DOI: https://doi.org/10.1016/j.jfoodeng.2009.03.016.
- Hai, Z.; Wang, J. Detection of Adulteration in Camellia Seed Oil and Sesame Oil Using an Electronic Nose. Eur. J. Lipid Sci. Technol. 2006, 108(2), 116–124. DOI: https://doi.org/10.1002/ejlt.200501224.
- Kiani, S.; Minaee, S.; Ghasemi-Varnamkhasti, M. Integration of Computer Vision and Electronic Nose as Non-destructive Systems for Saffron Adulteration Detection. Comput. Electron. Agric. 2017, 141. DOI: https://doi.org/10.1016/j.compag.2017.06.018.
- Lerma-García, M. J.; Simó-Alfonso, E. F.; Bendini, A.; Cerretani, L. Metal Oxide Semiconductor Sensors for Monitoring of Oxidative Status Evolution and Sensory Analysis of Virgin Olive Oils with Different Phenolic Content. Food Chem. 2009, 117(4), 608–614. DOI: https://doi.org/10.1016/j.foodchem.2009.04.052.
- Cerrato Oliveros, M. C.; Pérez Pavón, J. L.; Garcı́a Pinto, C.; Fernández Laespada, M. E.; Moreno Cordero, B.; Forina, M. Electronic Nose Based on Metal Oxide Semiconductor Sensors as a Fast Alternative for the Detection of Adulteration of Virgin Olive Oils. Anal. Chim. Acta. 2002, 459(2), 219–228. DOI: https://doi.org/10.1016/S0003-2670(02)00119-8.