
 ?Mathematical formulae have been encoded as MathML and are displayed in this HTML version using MathJax in order to improve their display. Uncheck the box to turn MathJax off. This feature requires Javascript. Click on a formula to zoom.
ABSTRACT
Household food security is a major issue in developing countries like Pakistan. Despite significant breakthroughs in grain production within the country, the problem of food availability and utilization persists. Diet is one of the most potent determinants of nutritional condition. The dietary intake method has been utilized to determine the food security status of households, which depends on various factors. There are no automatic and user-friendly methods available to decide food security status, which is generally determined by manually calculating calorie intakes. Due to its high performance and precision, machine learning holds major significance. In this paper, the status of food security has been examined by applying machine learning algorithms, namely, support vector machine, naïve Bayes, k-nearest neighbors, random forest, logistic regression, and neural network, on survey data of households for best predicting the status. A food analysis (FA) app has been developed to automatically predict the FAO status of a household’s food security by implementing the random forest model that found higher precision among algorithms. Additionally, the proposed mobile app will also be helpful for collecting the households’ data. Furthermore, the objective of the study was to enhance food security awareness among individuals.
INTRODUCTION
The concept of food security has evolved as a measure for reliable access and availability of enough and quality food.[Citation1] It is an unabating subject covering various determinants that include socioeconomic and environmental factors. The food security concept covers the food system activities and outcomes which contribute to social, economic, and environmental benefits for an active and healthy life.[Citation2] Food security encompasses the segments of agriculture, environment,[Citation3] employment and income,[Citation4] marketing, health, nutrition, and public policy.[Citation5] Pakistan is a developing country with an average per capita income of 1254 USD per annum. Its economy is highly reliant on agriculture, which adds nearly 19.3% to the GDP and employs 38.2% of the its workforce.[Citation6] Pakistan has a Human Development Index (HDI) value of 0.560 as of 2012 and was ranked 152 out of 189 countries and territories[Citation7] and placed in medium human developed nations. The majority of the population (more than 60%) of the country lives in rural areas that depend on the agriculture sector for its livelihood.[Citation8] In Pakistan, a significant progress toward food sufficiency has been noticed since its independence.[Citation9] Wheat crop production has played a major role in the country's food security. Total production of the country's wheat in 2010 was 24 million tons, compared to 11.6 million tons per year in early 1980s. Wheat has helped feed a population to grow to 174 million people in 2010 from 85 million in 1980. According to the National Nutrition Survey 2011, almost 60% of households in Punjab, 72% in Sindh, and 63.4% in Balochistan are experiencing food insecurity. The causes of food insecurity in the country include a hike in food prices, poverty, terrorism, energy crises, slow economic growth, and political instability.[Citation7] Many approaches[Citation10] are adopted for determining the status of food security. However, there is no universally accepted model to avoid complications. It is difficult to accurately find a person’s calorie intake manually in all cases; therefore, in general, cultural and geographical perspective values have to be taken into consideration. Currently, there is no automatic method available for determining food security status. There is a need to develop an automatic system to predict the correct and precise status of food security of individual dietary intake. Inappropriate and nutritionally deficient dietary intakes are causing various infectious diseases, disorders, overweight, cancers, and other chronic illnesses.
Machine learning techniques can be adopted that takes information automatically using statistical or computational models and are helpful for the accurate finding of the factors and for improving performance.[Citation11] Smartphone usage in different fields is increasing[Citation12] progressively due to ease of access, good user interface, and reliability in every domain. In recent years, there have been a few studies[Citation13] that were conducted for food security apprehension in Pakistan. However, slight interest has been shown to automate small farming households to enhance food security in the country using different machine learning models. Smart wireless technologies have swiftly turned out to be the most common means of transforming data, voice, and services in the modern world. Given this dramatic change, intelligent technologies have a great potential for advancement in numerous domains. Developments in smartphones offer a unique opportunity to bring the tools and technologies together in a much more informal manner. With intelligent technologies, we can transform the traditional ways of determining food security status into automated systems.
To bridge this gap, an Android-based application has been developed to find food security status of households through machine learning and smart technologies. In this study, different machine learning models have been implemented and trained on survey data of 756 farming households to find the best prediction model among all models. Random Forest comparatives performed best on these survey data in predicting food security status. The application has been developed and trained through the random forest algorithm. In the proposed app, users can input the last 7 days of consumed food values of their intake. After necessary preprocessing, the FAO status of their food would be predicted. In this study, a machine learning approach has been used to parse user data, learn from that data, and inform decisions based on model learning rather than complex manual calculation. The proposed study aims to familiarize survey researchers and social scientists with how machine learning algorithms can perform and highlight the applications in the survey datasets.
BACKGROUND AND LITERATURE REVIEW
Country’s ability to pay for the import is a key determinant of food security. The food import capacity (FIC) and food import dependence are the two indicators to measure a country’s food security, but the food import capacity is more reliable than the other.[Citation14] In some countries, foreign exchange reserves are also a main concern because monetary restraints can limit imports role to overcome the gap between production and consumption in many countries (FAO. 2003).[Citation15]According to Gittelsohn et al.,[Citation5] a household is to be food secure when it has ample access to healthy food for all of its family members. Also mentioned by Alinovi et al.[Citation16] is that a household is considered food secure if it has the aptitude to obtain the nutrition required by its members to be food secured. The household food security indicators may contain household location, household density, dependence, income, health status, food production, or employment status. Garrett and Ruel[Citation17] revealed that household access to food depends on whether the household has enough money to purchase food at prevailing prices or has enough land and other resources to grow its food. Food security measurement is still a contentious problem owing to the selection and order of some questions such as who should get, when, how, how much, and what kind of food.[Citation18] These questions become the base for the selection of food security methods. Some other key queries give diversity in food security measurement tools like: What is the frequency of food insecurity? What are the variations in this frequency over time? What are the causes of food insecurity? What is the causal association between food security and these factors? What are the probable effects of food insecurity on human health and behavior?[Citation19] However, the selection of food security definition leads to the choice of the best measurement method.[Citation16]
According to FAO 2011, the global level of chronic food insecurity has increased dramatically from 1990 to 2007 and even more in 2008–2009 due to financial and economic crises. Food production and insecurity at a global level is caused by the factors such as population growth, availability of arable land, water resources, climate change, food availability, food accessibility, and food loss. There are many factors that affect food security as shown in previous studies. In developing countries, domestic and international food prices instability causes food insecurity and hunger. Gorton et al.[Citation20] revealed in their research that there are many physical, economic, social, political, and environmental factors that influence food security in high-income countries. Among these factors, the household financial resource is the major cause of food insecurity in developed countries.
They suggest that to overcome the food insecurity situation, interventions are needed to comply with the supplemental nutrition assistance program. Lack of assets, illiteracy, female-headed households, and a higher number of dependent members in the households are the real threat to household food security. A study carried out in Nepal shows that food insecurity was 74% and food insecurity gap was 0.33[Citation21]. The severity of food insecurity was 14%. The major socioeconomic factors contributing to food security were smaller household size, low dependency ratio, better irrigation facilities, large farm size, and livestock holding. Akter and Basher[Citation22] studied the impact of income shock and food price on the households’ food security and well-being in rural Bangladesh. They argue that increasing food prices and subsequent income shocks lead to high level of food insecurity situation. But the adverse impact of these factors faded over time with economic growth, market adjustments, and domestic policy responses. The impact of climate change and reducing risks to food security is one of the major challenges at present.[Citation23] Machine learning has a huge impact on sentiment analysis and text classification in various languages.[Citation24] The task of the opinion mining and sentiment analysis[Citation25] is to analyze people’s opinions, evaluations, sentiments, attitudes, and emotions from textual datasets. In the literature, plenty of methods are available for text classification,[Citation26,Citation27] opinion mining,[Citation28] and evaluation of the sentiments.[Citation29] However, the commonly used text classification techniques are Lexicon-based, Machine Learning-based,[Citation30] and Rule-based Method. Recently, deep learning approaches have been used for feature selection and sentiments analysis as described by Onan.[Citation31] Furthermore, in sentiment analysis, topic modeling has also been used to find the information contained in textual documents and present it in the form of themes.[Citation32,Citation33]
MATERIALS AND METHODS
Proposed methodology
Study Area Description and Data Collection: The study was mostly regulated in the rural areas of Punjab province, which is a heavily populated province of Pakistan. The main purpose of selecting Punjab was due to its national agriculture share in GDP which is 51% and national economy and crop production.[Citation34] Punjab is located between 30°00ʹ N and 70°00ʹ E with a total area of 205,344 km2.[Citation35] Geographically, it has a rich agriculture section that is contributing well to the development of the province and economy, with its enormous irrigation system.[Citation35] Average temperature in Punjab ranged from 16.3°C to 31.9°C during the years 1970–2001. Punjab province could be divided into five agro-climatic regions: wheat-cotton zone, wheat-rice zone, arid zone, mixed zone, and low-intensity zone.[Citation36]
The study was conducted using a multi-stage stratified sampling technique for selecting areas/districts and 756 farm households from three agro-climatic zones . During the first phase, we distributed five strata according to zones. During the second phase, using stratified purposive sampling technique, 12 districts were selected from a total of 36 districts. Strata were not the same, but a proportional sample was drawn from each stratum by using a formula. One district was selected from arid zone; two from low-intensity zones; and three from wheat-cotton, mixed-zone, and wheat-rice zones. For the selection criteria, homogeneity of different crops was considered from five main yields, i.e., cotton, sugarcane, rice, maize, and wheat. During the third stage, four villages were selected randomly and during the fourth stage, 12 houses from each village were also selected using random approach having a total of 756 households.
Table 1. Agro-climatic zones of Punjab and study districts*
Analytical framework
There are several different ways for determining the status of food security and different studies[Citation5,Citation9,Citation37] use different methods. Different machine learning models can be applied to find food security status of small farming. Machine learning involves using statistics, computational methods, and mathematics to find accurate and efficient algorithms for classification. The framework of the proposed methodology is shown in . In the proposed study, the survey data of household diet intakes was used which was conducted by Ahmed et al.[Citation38] The survey data have been divided into training and testing, and after necessary preprocessing, six different machine learning models have been applied: naïve Bayes, support vector machines (SVM), K-nearest neighbors (kNN), random forest, logistic regression, and neural network to find the best prediction model. A mobile application has been designed based on diet features and trained through random forest model due to its higher accuracy of prediction. Random forest algorithm provided the highest accuracy and precision because this algorithm uses a huge number of uncorrelated models operating as a single board that will beat any of the discrete component models. Accuracy comparison among these models is presented in . Enenkel et al.[Citation39] described that once a mobile application is available, all assessments can easily be uploaded to the database for further processing and trend analysis. The evaluation and testing of Food Analysis (FA) App for automatically predicting the status has been accomplished through inputting the last 7 days consumed calories of the user. The proposed app predicted the FAO food security status based on training.
Figure 1. The proposed methodology
Table 2. Machine learning model accuracies
RESULTS AND DISCUSSION
Best selected model
Random forest is a simple, flexible, and diverse machine learning algorithm developed by Leo Breiman[Citation40] for regression, classification, and prediction. A random forest is made of numerous decision trees where data sets are divided into several trees with different features. Samples are drawn from each tree having high variance. Computationally, random forest depends on one or two tuning parameters that can be directly used for high dimensional data due to a built-in estimation of generalization inaccuracy. The algorithm is a meta learner with several separate trees where each vote or tree is given individual weights and the forest chooses the classification having most votes either weighted or non-weighted. Each attribute has an equal contribution for calculating and predicting the correct outcome. However, less contributed attributes can be filtered out during the model training process. In random forest, total trees can be increased without any generalization error. Total randomly selected predictor variables that are chosen at each node. The total trees in the forest tree size, that is calculated by the lowest node size or the largest number of end nodes. Random forest provides the highest precision in this case because it operates by creating multiple decision trees by looking at different possibilities of the problem during the training phase and return output by taking the mode of the result or average calculations of the decision trees. The accuracy and computational complexity of the algorithm can be influenced by the total number of variables in the problem. The training phase of random forests follows the general procedure of bootstrap aggregation or bagging by taking assumptions or subsets, repeatedly selecting a random sample and fitting trees to the models.
where X’ = unseen samples, b = 1, 2, … , B and B = no of repeating the decision tree.
In addition, an estimation of the ambiguity of the calculation can be made as the standard deviation of the predictions from all the individual decision trees on X’.[Citation41]
Prediction of errors in a single tree is highly sensitive in the training phase, but many trees are not due to no correlation between them. Furthermore, SVM provides the second highest precision because it chooses a hyperplane to minimize errors during classification.[Citation42]
In the accuracy table, the AUC stands for “Area under ROC (receiver-operating characteristic) Curve” that measures the whole two-dimensional area.[Citation43,Citation44] It delivers a summative measure of performance across all possible classification inceptions. CA (Classification Accuracy score) measures the ratio between the total number of corrected prediction to the total number of input samples.
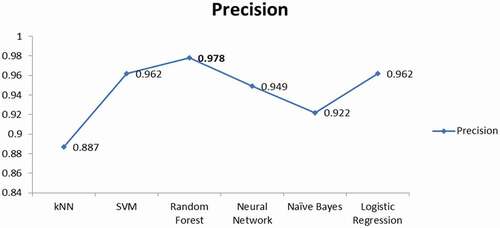
Precision is the ratio between True Positive/(True Positive + False Positive).[Citation44] The ability of the classifier is to not label a negative sample as positive. In machine learning, recall is the ability of the classifier to find all the positive samples. The precision curve among implemented machine learning models based on survey data is demonstrated in .
Figure 2. Precision comparison of different models on household dataset
Recall is the number of correct positive results divided by the number of all relevant samples.[Citation45]
In the model evaluation, test accuracy has been measured through F1 score. The F1 score is the harmonic mean between precision and recall. The range for F1 score is [0, 1]. The mathematical formula for the F1 score is expressed as[Citation44]:
Mobile application development
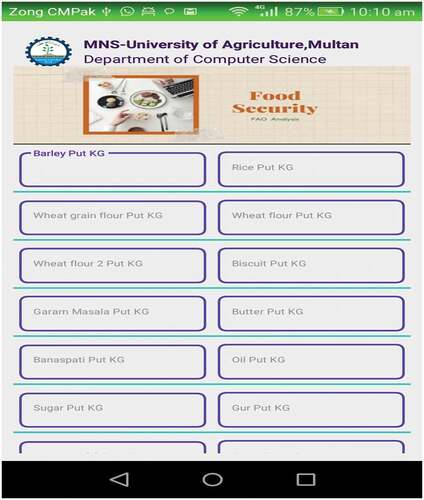
With the rapid improvement of living standards, accurate, automatic determining of food attributes, keeping track of daily dietary calories, controlling nutrition intakes, managing their food habits to keep healthy has attracted more and more attention in everyday life. Various apps have been developed to keep records of daily meals, food names, and calories and calories estimation from images.[Citation46,Citation47] In the proposed study, FA App has been developed to predict the status of households’ food security by inputting the calories consumed in the last 7 days. The FA App has been trained and tested through machine learning algorithm instead of manual calculation. In the food security app, users can enter food values such as beef per kg, potato, oil, and other required features. The app first performs preprocessing on user input calories like converting kilograms (kg) into grams (g). The preprocessed data have been passed to a training model from which specific parameters are defined to make random forest decisions. In the proposed study, daily calorie, per capita calorie, oil in-take, total household members, and total calorie intake in the last 7 days have been supposed to be the key features for the training model. The user calorie inputs are passed to train models for evaluating and predicting the FAO food security status. The graphical interface of the FA app is shown in .
Figure 3. FA user input interface
If the FA app status is returned one (1), then the food is secure; in case it is returned zero (0), the food is insecure. The results of the prediction status are illustrated in . The calorie inputs are numeric while using the app. The link to the food security app is (https://play.google.com/store/apps/details?id=com.foodo.analysis).
Figure 4. Results of predicting food security status

CONCLUSION
The present study examines the status of food security using several machine learning algorithms in different districts of rural Punjab by conducting a household survey of 756 farmers from various regions. A mobile app has been developed and trained through machine learning algorithms to determine food security status automatically. The study has uncovered the hidden heterogeneities in the household survey data. The proposed FA App is useful for supporting healthy eating, reducing malnutrition, and improving the country’s population’s overall health and nutritional status. Furthermore, machine learning methods have been introduced in food security and survey analysis. It has been proven to be an advanced technology with a huge number of successful applications in various domains. The FA App will also be helpful for data collection of dietary intakes which will improve the overall accuracy and efficiency of the system toward the goal.
Acknowledgments
We thank our colleagues from MNS University of Agriculture, Pakistan, who provided insight, and shared their expertise with us during this research work. We would also like to show our gratitude to the anonymous reviewers for their careful reading of the manuscript and for their valuable comments and suggestions. This research received no specific grant from any funding agency. The authors declare that they have no conflict of interest. This study was partially funded by Higher Education Commission (HEC) under National Research Programme for Universities (NRPU) [HEC-NRPU-10213
References
- Bashir, M. K.; Schilizzi, S.; Pandit, R. The Determinants of Rural Household Food Security in the Punjab, Pakistan. An Econ Anal. 2012, 1784–2016-141882 doi:https://doi.org/10.22004/ag.econ.122526
- Ericksen, P. J.;. Conceptualizing Food Systems for Global Environmental Change Research. Glob. Environ. Chang. 2008, 18(1), 234–245. DOI: https://doi.org/10.1016/j.gloenvcha.2007.09.002.
- Ingram, J.;. A Food Systems Approach to Researching Food Security and Its Interactions with Global Environmental Change. Food Secur. 2011, 3(4), 417–431. DOI: https://doi.org/10.1007/s12571-011-0149-9.
- Mkwambisi, D. D.; Fraser, E. D. G.; Dougill, A. J. Urban Agriculture and Poverty Reduction: Evaluating How Food Production in Cities Contributes to Food Security, Employment and Income in Malawi. J. Int. Dev. 2011, 23(2), 181–203. DOI: https://doi.org/10.1002/jid.1657.
- Gittelsohn, J.; Mookherji, S.; Pelto, G. Operationalizing Household Food Security in Rural Nepal. Food Nutr. Bull. 1998, 19(3), 210–222. DOI: https://doi.org/10.1177/156482659801900304.
- GoP. Economic Survey of Pakistan 2019-20. Econ. Advis. Wing, Islam. Pakistan. 2020.
- C. D. Nutrition Wing Government of Pakistan, Islamabad, NNSP. National Nutrition Survey Pakistan. 2019.
- GoP. Economic Survey of Pakistan 2016-17. Econ. Advis. Wing, Islam. Pakistan. 2017, 115–125.
- Bashir, M. K.; Schilizzi, S.; Pandit, R. The Determinants of Rural Household Food Security in the Punjab, Pakistan: An Econometric Analysis. 2012.
- Sharma, P.; Gulati, A. Approaches to Food Security in Brazil, China, India, Malaysia, Mexico, and Nigeria: Lessons for Developing Countries. 2015.
- Okori, W.; Obua, J. Machine Learning Classification Technique for Famine Prediction. in Proceedings of the world congress on engineering, 2011, 2, 6–8.
- Liu, J.; Yu, J. Research on Development of Android Applications. In 2011 4th International Conference on Intelligent Networks and Intelligent Systems, 2011,69–72.
- Amir, R. M.; Shahbaz, B.; Ali, T.; Zafar, M. I. Analysis of Household Food Security Concerns and Coping Strategies of Small Farmers in Northwestern Highlands of Pakistan. Pakistan J. Agric. Sci. 2013, 50, 505–510.
- Gayi, S. K.;. Does the WTO Agreement on Agriculture Endanger Food Security in Sub-Saharan Africa? Food Secur. Indic. Meas. Impact Trade Openness. 2007, 284–321.
- FAO. Trade Reforms and Food Security: Conceptualizing the Linkages. 2003.
- Alinovi, L.; Mane, E.; Romano, D. Measuring Household Resilience to Food Insecurity: Application to Palestinian Households. EC-FAO Food Secur. Program. Rom. 2009.
- Garrett, J. L.; Ruel, M. T. Are Determinants of Rural and Urban Food Security and Nutritional Status Different? Some Insights from Mozambique. World Dev. 1999, 27(11), 1955–1975. DOI: https://doi.org/10.1016/S0305-750X(99)00091-1.
- McKeown, D. Food Security: Implications for the Early Years. Background paper. Toronto Public Health. 2006.
- Bashir, M. K.; Schilizzi, S. “‘have Policies in Pakistan Been Effective for Improving Food Security?’ Wanted: Disaggregated Policy Assessment! World Appl. Sci. J. 2012, 17(9), 1182–1191.
- Gorton, D.; Bullen, C. R.; Mhurchu, C. N. Environmental Influences on Food Security in High-income Countries. Nutr. Rev. 2010, 68(1), 1–29. DOI: https://doi.org/10.1111/j.1753-4887.2009.00258.x.
- Maharjan, K. L.; Khatri-Chhetri, A. Household Food Security in Rural Areas of Nepal: Relationship between Socio-economic Characteristics and Food Security Status. 2006.
- Akter, S.; Basher, S. A. The Impacts of Food Price and Income Shocks on Household Food Security and Economic Well-being: Evidence from Rural Bangladesh. Glob. Environ. Chang. 2014, 25, 150–162. DOI: https://doi.org/10.1016/j.gloenvcha.2014.02.003.
- Campbell, Bruce M., Sonja J. Vermeulen, Pramod K. Aggarwal, Caitlin Corner-Dolloff, Evan Girvetz, Ana Maria Loboguerrero, Julian Ramirez-Villegas et al. “Reducing risks to food security from climate change.” Global Food Security 11 (2016): 34–43.. doi:https://doi.org/10.1016/j.gfs.2016.06.002
- Marie-Sainte, Souad Larabi, Nada Alalyani, Sihaam Alotaibi, Sanaa Ghouzali, and Ibrahim Abunadi. “Arabic natural language processing and machine learning-based systems.” IEEE Access 7 (2018): 7011–7020
- Onan, A. (2020). Sentiment Analysis on Product Reviews Based on Weighted Word Embeddings and Deep Neural Networks. Concurrency and Computation: Practice and Experience. e5909.
- Onan, A.; Toçoğlu, M. A. Weighted Word Embeddings and Clustering‐based Identification of Question Topics in MOOC Discussion Forum Posts; Computer Applications in Engineering Education, 2020.
- Onan, Aytuğ, Serdar Korukoğlu, and Hasan Bulut. “Ensemble of keyword extraction methods and classifiers in text classification.” Expert Systems with Applications 57 (2016): 232–247
- Onan, A.;. Mining Opinions from Instructor Evaluation Reviews: A Deep Learning Approach. Comput. Appl. Eng. Educ. 2020, 28(1), 117–138. DOI: https://doi.org/10.1002/cae.22179.
- Onan, A.; (2020, October). Sentiment Analysis in Turkish Based on Weighted Word Embeddings. In 2020 28th Signal Processing and Communications Applications Conference (SIU). (pp. 1–4). IEEE.
- Onan, A.;. Sentiment Analysis on Massive Open Online Course Evaluations: A Text Mining and Deep Learning Approach; Computer Applications in Engineering Education, 2020.
- Onan, A.; (2019, August). Deep Learning Based Sentiment Analysis on Product Reviews on Twitter. In International Conference on Big Data Innovations and Applications. (pp. 80–91). Springer, Cham.
- Onan, A.;. Two-stage Topic Extraction Model for Bibliometric Data Analysis Based on Word Embeddings and Clustering. IEEE Access. 2019, 7, 145614–145633. DOI: https://doi.org/10.1109/ACCESS.2019.2945911.
- Onan, A.; Toçoğlu, M. A. A Term Weighted Neural Language Model and Stacked Bidirectional LSTM Based Framework for Sarcasm Identification. IEEE Access. 2021, 9, 7701–7722. DOI: https://doi.org/10.1109/ACCESS.2021.3049734.
- Abid, M.; Scheffran, J.; Schneider, U. A.; Ashfaq, M. Farmers’ Perceptions of and Adaptation Strategies to Climate Change and Their Determinants: The Case of Punjab Province, Pakistan. Earth Syst. Dyn. 2015, 6(1), 225–243. DOI: https://doi.org/10.5194/esd-6-225-2015.
- Ahmed, M.; Ullah, S.; Paracha, Z. U. H. The Retail Food Sector in Pakistan. Int. J. Acad. Res. Bus. Soc. Sci. 2012, 2(12), 122.
- Pinckney, T. C.;. The Demand for Public Storage of Wheat in Pakistan. Intl Food Policy Res Inst. 1989, 77.20–30
- Frankenberger, T. R.; McCaston, M. K. The Household Livelihood Security Concept. Food Nutr. Agric. 1998,22, 30–35
- Ahmed, U. I.; Ying, L.; Bashir, M. K.; Abid, M.; Zulfiqar, F. Status and Determinants of Small Farming Households’ Food Security and Role of Market Access in Enhancing Food Security in Rural Pakistan. PLoS One. 2019, 12(10), e0185466. DOI: https://doi.org/10.1371/journal.pone.0185466.
- Enenkel, Markus, Linda See, Mathias Karner, Mònica Álvarez, Edith Rogenhofer, Carme Baraldès-Vallverdú, Candela Lanusse, and Núria Salse. “Food security monitoring via mobile data collection and remote sensing: Results from the Central African Republic.” PloS one 10, 11 (2015): e0142030
- Breiman, L.;. Random Forests. Mach. Learn. 2001, 45(1), 5–32. DOI: https://doi.org/10.1023/A:1010933404324.
- JJames, Gareth, Daniela Witten, Trevor Hastie, and Robert Tibshirani. An introduction to statistical learning. 112. New York: springer, 2013
- Tan, P.-N.; Steinbach, M.; Kumar, V. Classification: Basic Concepts, Decision Trees, and Model Evaluation. Introd. Data Min. 2006, 1, 145–205.
- Bradley, A. P.;. The Use of the Area under the ROC Curve in the Evaluation of Machine Learning Algorithms. Pattern Recognit. 1997, 30(7), 1145–1159. DOI: https://doi.org/10.1016/S0031-3203(96)00142-2.
- Powers, D. M. Evaluation: From Precision, Recall and F-measure to ROC, Informedness, Markedness and Correlation. 2011.
- Huang, Y. J.; Powers, R.; Montelione, G. T. Protein NMR Recall, Precision, and F-measure Scores (RPF Scores): Structure Quality Assessment Measures Based on Information Retrieval Statistics. J. Am. Chem. Soc. 2005, 127(6), 1665–1674. DOI: https://doi.org/10.1021/ja047109h.
- Ege, T.; Yanai, K. Image-based Food Calorie Estimation Using Recipe Information. IEICE Trans. Inf. Syst. 2018, E101.D(5), 1333–1341. DOI: https://doi.org/10.1587/transinf.2017MVP0027.
- Meyers, Austin, Nick Johnston, Vivek Rathod, Anoop Korattikara, Alex Gorban, Nathan Silberman, Sergio Guadarrama, George Papandreou, Jonathan Huang, and Kevin P. Murphy. “Im2Calories: towards an automated mobile vision food diary.” In Proceedings of the IEEE International Conference on Computer Vision, pp. 1233–1241. 2015.USA