
 ?Mathematical formulae have been encoded as MathML and are displayed in this HTML version using MathJax in order to improve their display. Uncheck the box to turn MathJax off. This feature requires Javascript. Click on a formula to zoom.
ABSTRACT
In this paper, freshness monitoring model on small larimichthys polyactis based on multiple sensor array system (MSAS) combined with total volatile basic nitrogen (TVB-N) examination was studied. Larimichthys polyactis was obtained and prepared as detecting samples. MSAS was developed based on volatile gas content of the fish samples. Meanwhile, TVB-N was examined to provide quality reference for MSAS measurement. MSAS responding data were processed by principal component analysis (PCA) and non-linear signal analysis model. Larimichthys polyactis freshness deciding model was developed by non-linear fitting between signal processing features and TVB-N parameters. Results indicated that the method studied in this work presented good freshness deciding accuracy for larimichthys polyactis. This method also presented some advantages including rapid analysis, easy operation, and low cost. It is promising in aquatic products quality raped determination.
Introduction
Larimichthys polyactis is a kind of valuable fish in the world. It widely lives in the Yellow Sea and the East China Sea. It is valuable marine fish, and enriched with protein and vitamins. Larimichthys polyactis has a very good taste, and reported effective against some kind of cancer. It is very difficult to technically farm small yellow croaker because they like to keep continuous vertical movements such as it descends at dawn, inhabit the seabed during the day and rises at dusk. Finally, the commercialized small yellow croaker is valuable and mainly captured in the sea environment. Its delicate flesh and delicious meat, and is widely accepted by citizens.[Citation1] Moreover, larimichthys polyactis is rich in protein and a variety of unsaturated fatty acid, so it is one kind of valuable fishes.[Citation2] The freshness is one of the major criteria to evaluate the fish quality. Thus, it is of great research value to investigate the species of quality changes during storage after harvest.[Citation3] In the past decades, the annual outcome of this fish is more than 12,000 ton. However, the nutritional composition and tissue texture of the croaker are easily decomposed because of the growth and metabolism of the microorganism.[Citation3] The spoilage mechanism of aquatic products is contributed to the growth of aerobic bacteria, such as Pseudomonas, Shewanella spp., Achromatium, Serratia, Flavobacterium, and Enterobacteriaceae. These microbials have been found in the aquatic products during storage. Especially, while Shewanella spp., and Aeromonas are decided to be the main spoilage organisms during long-time storage.
At present, the methods for aquatic quality analysis include physical test, chemical examination, microbial, and human sensory evaluation.[Citation4] Physical and chemical methods have fuzzy operation and long experiment procedure. Microbial method is time-consuming and low repeatability.[Citation5,Citation6] Human sensory evaluation method depends on the senses of human body. For example, the panelists deeply depend on their sensing organs, such as nose, mouth, hands, and eyes, etc. The evaluating data could be easily influenced by their emotion, health status, and their intake. So this method is lack of accuracy and repeatability. Many researchers try to make objective tables or files to improve the disadvantages of human sensory evaluation method; however, the problems remain unsettled. Instrument analysis, such as gas chromatography coupled with mass spectrometry (GC/MS), are usually used in laboratory. The cost of these instruments is relatively high. Also, the examination cost of instrument analysis is relatively high. Furthermore, the skilled operators are need to ensure the normal running of the instruments, which is of great importance for high accuracy to this method. So a simple, rapid, and easy method is urgently required in aquatic products quality detection.[Citation7–12]
In the past decade, multiple sensor array system (MSAS) has attracted the interest of many researchers all over the world. MSAS often has multiple gas sensors and controlling electrical circuits. The gases released by food are sensed by gas sensors and generate detecting signals.[Citation13–16] The feature of signals are extracted and forms certain patterns. The patterns from the known samples are applied to develop training unit, and finally form a pattern recognition system.[Citation17–20] The eigen values generated by the pattern recognition system build the recognizing database. Then, the new coming unknown samples can be recognized by the developed pattern recognition database, and give the deciding results.[Citation21–24]
Freshness monitoring on small larimichthys polyactis using MSAS combine with TVB-N parameters was studied in this paper. Larimichthys polyactis was obtained and prepared as a number of samples. TVB-N index was examined. Meanwhile, MSAS was developed and its responses to the samples was processed by principal component analysis (PCA) and non-linear signal analysis method. Larimichthys polyactis freshness deciding model was developed by non-linear fitting between signal-to-noise ratio (SNR) features and TVB-N parameters. The validating experiments were conducted to evaluate the detecting accuracy of the developed model.
Materials and methods
Materials
Small larimichthys polyactis was obtained from a supermarket. Within the icebox, they were transported to the laboratory, and washed with ice water. Then, the viscera, scale, head, and tail were removed. According to the fish spine line, the fish was cut into samples (25 g ± 5 g in weight). Then, the samples were stored at 277 K in the refrigerator. Experiments were conducted by taking the meat randomly for TVB-N examination and MSAS measurement.
Methods
TVB-N examination
TVB-N contents of the fish samples were exmained by the Conway microdiffusion method in this work.[Citation25] 5 g sample was separately impregnated with 45-mL distilled water for 30 min. Boric acid solution (1 mL of 0.01 N in concentration) was dipped into the Conway unit with the indication of 100 μL, 0.066% methyl red + 0.066% bromocresol green in EtOH. K2CO3 solution (50%) and filtrate (1 mL) were utilized. The mixture was placed at 37°C for 120 min. Then, HCl solution (0.01 N) was added to the mixture until a pale pink color appeared. The TVB-N index was calculated by EquationEquation (1)(1)
(1) .
where b was the titration volumes for the tested sample (mL) and a is the titration volumes for the blank (mL). W was the sample weight, f is the concentration of HCl (mol/L), and d was the dilution factor.
MSAS detection
System architecture
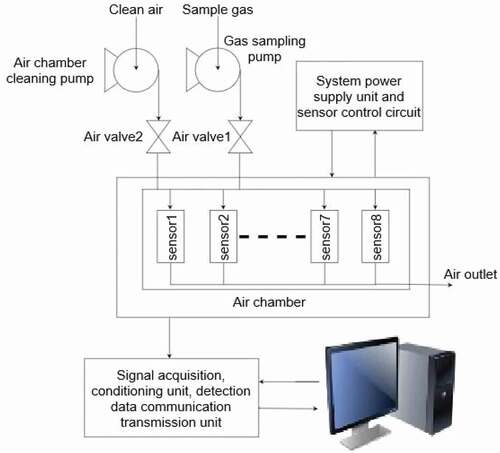
The samples were measured by a self-developed portable e-nose. The structure is displayed in . It consists of three main parts: data acquisition unit, gas sensor array part, and gas and power supply part. The sensor array part owns eight metal oxide semiconductor sensors with different chemical compositions and size to obtain selectivity toward various gases. The sensor species are displayed in . The selectivity toward volatile gas species of the sensors is provided by the manufacturer. MSAS system has a gas sensor chamber, including eight gas sensors. The sensor has the gas inlet and outlet. The gas-sensing materials are equipped in the sensor. The sensing membrane is heated by a resistance wire. MSAS system responses are measured as sampling voltage (V). The gas sensors depend on changes in conductivity caused by the adsorption of gas molecules and on sensing materials’ surface reactions. The sensor has ceramic substrate coated by sensing film, and heated by the resistance wire. Because of the high working temperature (250–500°C), the gas molecules transferred to the sensor surface are effectively combusted to carbon dioxide and water, which leads to changes in the resistance. The high temperature also refrains from the water interference and obtains fast responses of the sensors. The sensors also have relatively rapid recovery time. Polytetrafluorethylene material is utilized to make gas sensor chamber. Each sensor has separated sensing room, avoiding the cross-influence of the gas flow.
Table 1. Constitution of gas sensor array
Figure 1. MSAS structure
MSAS measurement
Fish sample was randomly taken out of refrigerator, and put into 100-mL beaker. Then, the beaker was packaged with the sealing membrane. After 0.5 h, the sampling pinhead and zero gas pinhead are placed into the head-space of the beaker. Volatile gas was inhaled into MSAS and sensed by the sensors. The experiments lasted for about 40 s. MSAS real-time responses were measured. When the experiments finished, zero gases were continuously inhaled into MSAS until its responses recovered to the initial state.
Data processing method
The multivariable output data formed by gas sensor array signal in the data processing represents the concept of another important part of electronic nose. The current data processing methods include principal component analysis (PCA), partial minimum variance (PLS), function discrimination analysis (FDA), artificial neural network (ANN), etc. Gas sensor responding data are often nonlinear in essence, and is transformed into linear relationship, making the detecting process more complicated. Stochastic resonance describes a phenomenon that the response of nonlinear relationship will be enhanced under the excitation of a certain intensity noise when inputting weak signal. Stochastic resonance was proposed by Italian scientists Benzi. It is widely applied in weak signal detection, sensing technology, electrical and mechanical system fault detection, etc.[Citation26] It has three factors: bistable system, input signals, and external noise. Its system characteristics often described by over-damped Brownian motion particle which driven by periodic force in a bistable situation trap.
is Nonlinear symmetric potential function;
is white Gaussian noise;the autocorrelation function is:
,
is input signal strength;
is modulation frequency;
is noise intensity;
is a real parameter;
(2) can be written as:
The most common response characteristics of SR is signal-to-noise ratio and we define signal-to-noise ratio as:
is signal spectral density;
is noise intensity in the range of signal frequency. The core mechanism of SR method is that the input of the weak signal can be amplified with the help of noise. In a suitable noise strength, the system output signal-to-noise ratio can reach the maximum value and convert to signal-to-noise ratio spectrum which will output as a result, it can completely express the information of sensing system testing sample. Pattern recognition method is very hot topic in recent years, which has been popular in various research fields.[Citation27,Citation28]
Results and discussion
TVB-N
TVB-N examination results were displayed in . In day0, TVB-N value was about 7.5 mgN/100 g. Then, it continuously increased with the increase of time. Finally, it reached about 33.5 mgN/100 g on day7. TVB-N is of great importance in aquatic research because it was the first chemical method used for evaluating freshness of fish. The decomposition of protein and amino acids leads to the changes in TVB-N index. Results demonstrated that the fish meat continuously decomposed during the experiments. TVB-N index could directly reflected the quality of aquatic products.
Figure 2. TVB-N examination results
MSAS measurement results
Original responses
displayed the MSAS original responses. Different responses were generated by the sensor array. Sensor4 gave the largest responses, and sensor7 was the secondary. Sensor2 displayed the smallest responses, indicating that there was few sensing gas species toward sensor2. Sensor5 and sensor7 gave the fastest increasing gradient than other sensors. The increasing gradient of sensor3 was the slowest. The fingerprint information of the fish meat was formed by integrating the sensing information provided by the gas sensor array. Sensor array responses overall constructed the feature information for fish quality determination.
Figure 3. Original response of MSAS
PCA results
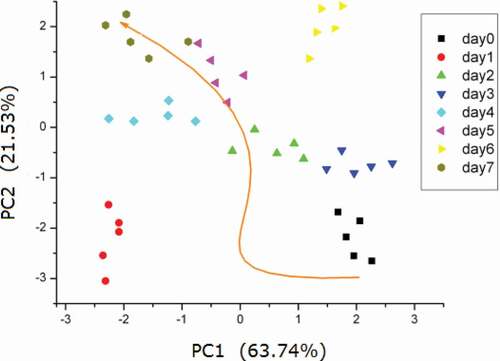
PCA is an algorithm to transform the columns of a dataset into a new set of features. The features are defined as principal components. The reduction in the variable number of a data set naturally comes at the expense of accuracy, but the trick in dimensionality reduction is to cost a little accuracy for simplicity. PCA makes analyzing data much easier and faster for machine learning algorithms without extraneous variables to process because smaller data sets are easier to explore and visualize. PCA results were shown in . The first principal component (PC1) and the second principal component (PC2) contributed 85.27% of the total variance, indicating that PC1 and PC2 could represent the total variance of the croaker samples. With the increase of storage time, PC2 gradually increased. However, PC1 decreased first, and then increased with the increase of storage time. The scatting points of certain samples overlapped with the points of other samples, demonstrating that PCA method could qualitatively discriminate the fish samples, but it could not give quantitative results.
Figure 4. PCA results
Small larimichthys polyactis freshness determination model
Non-linear signal processing results on MSAS responses to larimichthys polyactis with different storage time were displayed in . It can be seen that the SNR increased fast with the increase of stimulation intensity. SNR reached its eigen peak at the stimulation intensity of about 87. Then, it gradually decreased, and reached the stable state finally. At the position of eigen peak, the SNR values of the samples increased with the increase of storage time. The noise intensity is a parameter of the non-linear model. The stochastic resonance model is just used as a data processing method in this research. The model is explained in EquationEquation (2)(2)
(2) . In data processing, this matrix is combined with MSAS measurement data as the general input of the non-linear model. ξ(t) is the modulation external white noise. In data analysis, the noise intensity D is changed to tune the bistable model. Here, the noise intensity is increased within the range [0,900] to tune the non-linear model. At the same time, the SNR between the output and input of the the model is calculated. The noise level increases by itself and has no relationship with the fish samples. Noise is just a parameter used in the analysis of MSAS response to the samples.
Figure 5. Non-linear output of the NSAS responding data
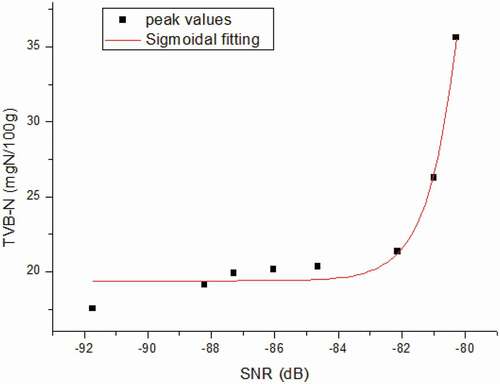
In order to develop the freshness deciding model, sigmoidal fitting between TVB-N index and SNR peak values was conducted. The fitting results were shown in EquationEquation (6)(6)
(6) and . R2 = 0.979 indicated that the fitting model was suitable for the fish freshness monitoring.
Figure 6. Freshness monitoring model
Validating experiments on the detecting accuracy of the developed model were conducted. Responses of MSAS to another 40 small larimichthys polyactis samples were measured, and measurement data were processed by the developed model (see EquationEquation (6)(6)
(6) ). Validating experiments results demonstrated that the accuracy of the model was 95%. The model presented good accuracy.
Conclusion
Fish freshness rapid monitoring is of great practical value for aquatic industry. In this paper, larimichthys polyactis freshness determination based on MSAS system combine with TVB-N examination was investigated. Larimichthys polyactis was obtained and prepared as detecting samples for the MSAS measurement and TVB-N testing. MSAS was designed according to the content of the volatile gas species emitted by the fish samples. During the experiments, TVB-N examination and MSAS measurement was synchronously conducted. MSAS responses to the samples was processed by PCA and non-linear signal analysis method. PCA results indicated that it could not totally discriminate all the fish samples. Larimichthys polyactis freshness deciding model was developed by sigmoidal fitting regression between non-linear SNR peak values and TVB-N index. R2 = 0.979 indicated that the fitting model was suitable for larimichthys polyactis freshness evaluation. The method studied in this paper gives constraints on physical and chemical indicators for the biomimetic olfactory system, which addresses the problem that biomimetic olfactory technique has no national standards basis. Validating experiments results demonstrated that the accuracy of the developed model was 95%. The proposed method is promising in aquatic products quality determination applications.
Additional information
Funding
References
- Zhao, J.; Bai, H.; Ke, Q.; Li, B.; Zhou, Z.; Wang, H.; Chen, B.; Pu, F.; Zhou, T.; Xu, P. Genomic Selection for Parasitic Ciliate Cryptocaryon Irritans Resistance in Large Yellow Croaker. Aquaculture. 2021, 531, 735786. DOI: https://doi.org/10.1016/j.aquaculture.2020.735786.
- Jiang, D.; Li, W.; Wang, Z.; Fang, M. Genome-Wide Identification of Cis-acting Expression QTLs in Large Yellow Croaker. Mar. Biotechnol. 2021, 23(2), 225–232.
- Wang, -Y.-Y.; Rashid, M. T.; Yan, J.-K.; Ma, H. Effect of Multi-frequency Ultrasound Thawing on the Structure and Rheological Properties of Myofibrillar Proteins from Small Yellow Croaker. Ultrasonics-Sonochemistry. 2021, 70(9), 105352.
- Xu, N.; Ding, T.; Liu, Y.; Zheng W.; Liu Q.; Yin Z.; Xiang X.; Xu D.; Mai K.; Ai Q. Effects of Dietary Tributyrin on Growth Performance, Body Composition, Serum Biochemical Indexes and Lipid Metabolism-related Genes Expression of Juvenile Large Yellow Croaker (Larimichthys Crocea) Fed with High Level Soybean Oil Diets. Aquac. Nutr. 2020, 27, 1–12.
- Wang, X.; Hu, M.; Gu, H.; Zhang, L.; Shang, Y.; Wang, T.; Wang, T.; Zeng, J.; Ma, L.; Huang, W.; et al. Short-term Exposure to Norfloxacin Induces Oxidative Stress, Neurotoxicity and Microbiota Alteration in Juvenile Large Yellow Croaker Pseudosciaena Crocea. Environ. Pollut. 2020, 267, 115397. DOI: https://doi.org/10.1016/j.envpol.2020.115397.
- Hoa Thanh, T.; Baoguo, L.; Heng, Z.; GUO, Q.; Li, S.; et al. Freezing Methods Affect the Characteristics of Large Yellow Croaker (Pseudosciaena Crocea): Use of Cryogenic Freezing for Long-term Storage. Food Sci. Technol. 2020, 40(Suppl.2), 429–435.
- Cai, X.; Zhang, J.; Lin, L.; Li, Y.; Liu, X.; Wang, Z.; et al. Study of a Noninvasive Detection Method for the High-temperature Stress Response of the Large Yellow Croaker (Larimichthys Crocea). Aquacult. Rep. 2020, 18, 100514. DOI: https://doi.org/10.1016/j.aqrep.2020.100514.
- Zhang, H.; Liao, H.; Lu, Y.; Hu, Y.; Yang, H.; Cao, S.; Qi, X. Effects Of High Hydrostatic Pressure On The Structural Characteristics Of Parvalbumin Of Cultured Large Yellow Croaker (Larimichthys crocea). J. Food Process. Preserv. 2020, 44(12), 1–8. DOI: https://doi.org/10.1111/jfpp.14911.
- Li, Q.; Wu, M.; Cui, K.; Zhu, S.; Mai, K.; Ai, Q.;, et al. Characterization of Antiviral Immune Response Induced by poly(I:C) in Macrophages of Farmed Large Yellow Croaker (Larimichthys Crocea). Fish Shellfish Immunol. 2020, 104(6), 663–672. DOI: https://doi.org/10.1016/j.fsi.2020.05.066.
- Lan, W.; Liu, L.; Zhang, -N.-N.; Huang X.; Weng Z. M.; Xie J. Effects of Epsilon-polylysine and Rosemary Extract on the Quality of Large Yellow Croaker (Pseudosciaena Crocea) Stored on Ice at 4 ± 1 Degrees C. J. Food Biochem. 2020, 44(10), e13418.
- Du, Y.-N.; Xue, S.; Han, J.-R.; Yan, J.-N.; Shang, W.-H.; Hong, J.-N.; Wu, H.-T.;, et al. Simultaneous Extraction by Acidic and Saline Solutions and Characteristics of the Lipids and Proteins from Large Yellow Croaker (Pseudosciaena Crocea) Roes. Food Chem. 2020, 310(4), 125928. DOI: https://doi.org/10.1016/j.foodchem.2019.125928.
- Kim, B.-S.; Oh, B.-J.; Lee, J.-H.; Yoon Y. S.; Lee H. I. Effects of Various Drying Methods on Physicochemical Characteristics and Textural Features of Yellow Croaker (Larimichthys Polyactis). Foods. 2020, 196(9), 1–11.
- Zheng, H.; Wang, S.; Ping, X.; Shao, C.; Zhou, H.; Xiang, B.; Li, J.; Lou, X.; Yi, X.; Guohua, H.; et al. Study of Spinyhead Croaker (Collichthys Lucidus) Fat Content Forecasting Model Based on Electronic Nose and Non-linear Data Resolution Model. Food Anal. Methods. 2019, 12(9), 1927–1937.
- Zheng, H.; Ying, X.; Wang, W.; Chen, Z.; Shao, C.; Zhou, H.; Wang, S.; Ping, X.; Li, J.; Yi, X.; et al. Study Of Sensitivity Evaluation On Ridgetail White Prawn (Exopalaemon carinicauda) quality examination methods. Int. J. Food Prop. 2019, 22(1), 942–951.
- Shao, C.; Zheng, H.; Zhou, Z.; Li, J.; Lou, X.; Hui, G.; Zhao, Z.; et al. Ridgetail White Prawn (Exopalaemon Carinicauda) K Value Predicting Method by Using Electronic Nose Combined with Non-linear Data Analysis Model. Food Anal. Methods. 2018, 11(11), 3121–3129.
- Huang, Z.; Huang, C.; Zhou, J.; Jian, L.; Guohua, H.; et al. Electronic Nose System Fabrication and Application in Large Yellow Croaker (Pseudosciaena Crocea) Fressness Prediction. J. Food Meas. Charact. 2017, 11(1), 33–40.
- Hamed, K.; Mansour, R.; Esmaeil, M. G. Application of the E-nose Machine System to Detect Adulterations in Mixed Edible Oils Using Chemometrics Methods. J. Food Process. Preserv. 2020, 44(9), e14696.
- Li, J.; Feng, H.; Liu, W.; Gao, Y.; Hui, G.; et al. Design of A Portable Electronic Nose System and Application in K Value Prediction for Large Yellow Croaker (Pseudosciaena Crocea). Food Anal. Methods. 2016, 9(10), 2943–2951.
- Karami, H.; Rasekh, M.; Mirzaee-Ghaleh, E. Qualitative Analysis of Edible Oil Oxidation Using an Olfactory Machine. Food Meas. 2020, 14, 2600–2610. DOI: https://doi.org/10.1007/s11694-020-00506-0.
- Le, Z.; Jianfeng, Z.; Yu, Y.; Zhao, G.; Hui, G.; et al. Spinyhead Croaker (Collichthys Lucidus) Quality Determination Using Multi-walled Carbon Nanotubes Gas-ionization Sensor Array. J. Food Meas. Charact. 2016, 10(2), 247–252.
- Mansour, R.; Hamed, K. Application of Electronic Nose with Chemometrics Methods to the Detection of Juices Fraud. J. Food Process. Preserv. 2021, 45(5), e15432.
- Liu, Y.; Zhang, F.; Zhu, B. Effect of Sodium Lactate Coating Enriched with Nisin on Beef Strip Loins (M. Longissimus Lumborum) Quality during Cold Storage and Electronic Nose Rapid Evaluation. J. Food Meas. Charact. 2020, 14(6), 2998–3009. DOI: https://doi.org/10.1007/s11694-020-00548-4.
- Mansour, R.; Hamed, K. E-nose Coupled with an Artificial Neural Network to Detection of Fraud in Pure and Industrial Fruit Juices. Int. J. Food Prop. 2021, 24(1), 592–602. DOI: https://doi.org/10.1080/10942912.2021.1908354.
- Hamed, K.; Mansour, R.; Ghalehb, E. M. Comparison of Chemometrics and AOCS Official Methods for Predicting the Shelf Life of Edible Oil. Chemom. Intell. Lab. Syst. 2020, 206, 104165. DOI: https://doi.org/10.1016/j.chemolab.2020.104165.
- Conway, E.; O’malley, E. Microdiffusion Methods. Ammonia and Urea Using Buffered Absorbents (Revised Methods for Ranges Greater than 10 (G. N). Biochem. J. 1942, 36, 655–661. DOI: https://doi.org/10.1042/bj0360655.
- Hui, G.; Lu, H.; Jiang, Z.; Zhu, D.; Wan, H. Study of Small-cell Lung Cancer Cell-based Sensor and Its Applications in Chemotherapy Effects Rapid Evaluation for Anticancer Drugs. Biosens. Bioelectron. 2017, 97, 184–195. DOI: https://doi.org/10.1016/j.bios.2017.05.050.
- Jiang, C. B.; Li, R. L.; Chen, T. G.; Xu, C. H.; Li, L.; Li, S. F. A Two-lane Mixed Traffic Flow Model with Drivers’ Intention to Change Lane Based on Cellular Automata. Int. J. Bio-Inspir. Comp. 2020, 16(4), 229–240. DOI: https://doi.org/10.1504/IJBIC.2020.112328.
- Jiang, C.; Chen, T.; Li, R.; Li, L.; Li, G.; Xu, C.; Li, S. Construction of Extended Ant Colony Labor Division Model for Traffic Signal Timing and Its Application in Mixed Traffic Flow Model of Single Intersection. Concurr. Comp-Pract. Exp. 2020, 32(7), e559. DOI: https://doi.org/10.1002/cpe.5592.