
 ?Mathematical formulae have been encoded as MathML and are displayed in this HTML version using MathJax in order to improve their display. Uncheck the box to turn MathJax off. This feature requires Javascript. Click on a formula to zoom.
ABSTRACT
In this paper, glucose quantitative detection by biological sensor and electrochemical capacitance data treatment was studied. The taste cells were fixed on carbon screen-printed electrode. Electrochemical capacitance responses of cell-based sensor to sucrose in different concentrations and related mixtures were measured. Glucose quantitative analysis results demonstrated that the proposed method had quantitative determination abilities toward glucose and related mixtures. The signal-to-noise ratio index presented qualitative discrimination abilities to different glucose mixtures. Negative control results indicated that the receptor-free cells showed no perception ability for glucose. The proposed method is promising in sugar rapid detection.
INTRODUCTION
Gustation is important for animals due to its guidance of nutrition and safety, and it has become a hot research topic during the past decade.[Citation1] There are four widely accepted types of gestation: sweet, bitter, sour, and salty. Cells with gustation receptors (CGRs) and related gustation transmission elements have been proposed in oral cavity and tongue surface.[Citation2] Some instruments are designed to imitate gustation functions of the animals, such as electronic tongue using a multiple sensor array, for certain chemical component qualitative and quantitative analysis from measured solutions.[Citation3] These artificial electrical instruments still present certain accuracy and selectivity.
Cell-based sensor develops fast in the past two decades.[Citation4] Living cells realize their biological functions by means of thousands of biological reactions through special biochemical pathways and successive transduction electrical signals.[Citation5] Cell-based sensor utilizes these inner biochemical reactions and figure out specific chemical molecules or components with better selectivity and accuracy. Great progress on this kind of sensor has been made in biomedical engineering, drug evaluation, environmental monitoring, etc.[Citation6–8]
Electrical cell-substrate impedance sensing (ECIS) technique was proposed in the 1980s and developed fast in the past two decades.[Citation9,Citation10] This method measures AC impedance of the cell-covered electrode. The cells behave like dielectric particles so that the electrical properties increase with increasing coverage of the electrode until a confluent layer of cells is established due to the insulating properties of cell membranes. ECIS sensors have been applied in abundant biochemical analysis occasions, etc.[Citation11,Citation12] The electrical properties (such as capacitance, conductance, etc.) of cells suspended in physiological media as functions of the frequency can be qualified in proper measurement occasions.[Citation13,Citation14] The cells get polarized due to the surface charge polarization within an external AC electric field. As a result, the dielectric properties or the capacitance become the characterization of the polarization, and can obtain useful information about the cells biological status.[Citation15] The dielectric property presents abundant relationship with the membrane potential at low electric fields. However, little literature have been published on cell dielectric property monitoring. So whether a capacitance sensor consisting of two electrodes could present a novel way for cell status monitoring is of great importance for cell-based sensor research field .[Citation6]
Glucose quantitative detection by biological sensor and electrochemical capacitance (EC) properties analysis is studied in this paper. The taste cells were fixed on carbon screen-printed electrode. EC responses of cell-based sensor to sucrose in different concentrations and related mixtures were measured. Negative control experiments were also conducted to provide comparison for the receptor cell-based sensor.
MATERIALS AND METHODS
Materials
CSPE (Ref. 125, 4 mm in diameter)) is used in this paper. The potential values are referred to the screen-printed silver pseudo-reference electrode. phosphate-buffered saline (PBS) with 10 μg/mL laminin and PBS with 100 μg/mL poly-L-ornithine are prepared respectively for cell culture. Fetal bovine serum (FBS) and Dulbecco’s Modified Eager’s Medium (DMEM) were obtained from GIBCO BRL, USA. All chemicals are obtained from Sigma (Sigma-Aldrich, USA).
Cell culture
Human enteroendocrine NCI-H716 cells (ATCC, USA), presenting G protein-coupled receptors (GPCRs) and sweet taste receptor type 1, and member 2/type 1, member 3 (T1R2/T1R3) (De Bruïne et al. 1992; Finger et al. 2005; Jang H.J. et al. 2007), are cultured in minimum essential medium supplements with 5% FBS together with penicillin and streptomycin. The cells are cultured on a tissue culture dish in a humidified incubator at 37°C with 5% CO2. 10 μL of 106/mL cell suspension is seeded on CSPE coated with 100 μg/mL poly-L-ornithine and 10 g/mL laminin before cell culture procedure. HEK-293 cells, without expression of taste receptor, are a cell line derived from human embryonic kidney cells. They are used in negative control experiments.
System setup
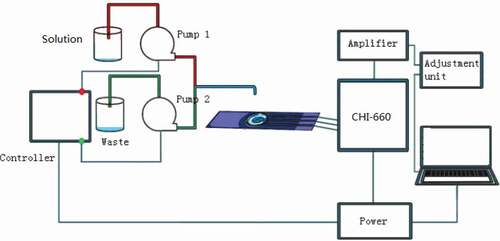
Experiment system is displayed in , and it has electrode with cells, controlling part, and data recording part. The electrode is fixed with a methacrylate wall-jet flow-cell for flow-injection analysis. The injection volume of the experimental liquid is limited by an O-ring structure. The measurement signal between voltage and current is recorded by CHI-660. The instrument is controlled by a computer. The pumps are used to pump experimental liquid in/out of flow-cell via a valve. The whole system is placed into a shield box to avoid environment interference.
Figure 1. System setup
Glucose and mixture concentration
The tastant concentration selection is displayed in and . All tastant concentrations are in the same taste degree.
Table 1. Solution concentrations of the selected tastants for NCI-H716 cell-based sensor (M)
Table 2. Solution concentrations of the mixed tastants for NCI-H716 cell-based sensor (M)
Electrochemical capacitance measurement
CSPE with cells was fixed in flow-cell that was linked to the CHI-660 electrochemical working station via connecting wire. EC data was measured at 1 kHz with 150 points every 30 s. PBS was injected into the flow-cell for 5 min to wash the flow-cell, then tastant solution was injected. The pumps worked at a flux of 100 μL/min. Experiments were conducted at room temperature in the sterile room.
Nonlinear stochastic resonance
As an important signal processing tool in the past 20 years, [Citation16] SR has been widely used in many fields. Its model can be written as follows[Citation17,Citation18]:
where presents working time,
is the position of the virtual Brownian dynamic particle, K and F are system parameters,
represents the input signal
and intrinsic noise
,
is the external noise, and
is the traditional double-welled potential with the constants
and
.
EquationEq. (1)(1)
(1) can be transferred as
The minimal values of locate at
, and
. A potential barrier separates
with the height
. The barrier top locates at
. Given
, where
is signal intensity, and
is signal frequency.
is external noise intensity. SR is qualified by SNR index and SNR can be approximately described as[Citation19–21]
Noise intensity is a parameter of SR model. SR model is used as a data processing method in this research. We use as input matrix. It has a sinusoid signal
, EC measurement data
, and intrinsic noise
. Noise intensity changes within the range [0,900]. SNR between the output and input is calculated.[Citation22] This model is promising in data analysis.[Citation23–25]
RESULTS AND DISCUSSION
Cell culture results
Based on the cell immobilization counting, the total cell number is over 5 × 10⁴ around the working electrode. Results indicate that cell culture procedure reaches the demand of the experiments.
Capacitance analysis results
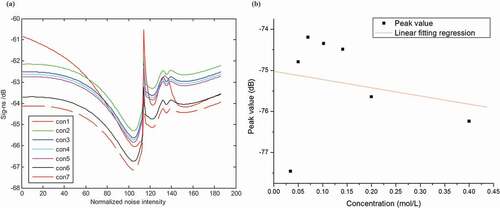
displays the SNR responses to glucose in different concentrations. With the increase of glucose concentration, sig-ns continuously decreased (see )). Feature peak lies at stimulation intensity of 110. ) displays the linear fitting regression between feature peak values and glucose concentration. Results demonstrate that there is good linear relationship between these two factors. A possible explanation lies in the interactions between taste cells and glucose molecules. The more glucose molecules in the solution, the stronger combination between the cells and the molecules. For glucose in different concentrations, results reflect the changing properties of the cells to the glucose molecules. The easier for the interactions between cells and tastant molecule, the bigger appearance in the curve gradient. However, the feature peak position possibly indicates the interacting pattern between cells and tastant molecules.
Figure 2. SNR responses of the glucose: (a) responses; (b) linear fitting of SNR peak values of glucose
Capacitance analysis results of the mixtures
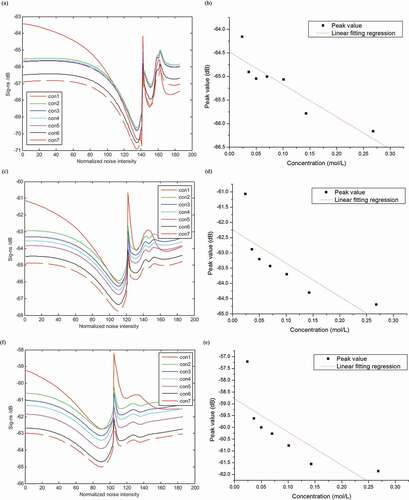
Responses of biological sensor to 0.96e-5 M quinine + sucrose in seven concentrations are shown in ). Sig-ns continuously decreased with the increase of sucrose concentration. Feature peak emerges at stimulation intensity of about 117. ) displays the linear fitting regression between feature peak values and sucrose concentration. Results demonstrate that there is good linear relationship between feature peak values and sucrose concentration. Sensor responses to 1.93e-4 M citric acid + sucrose in seven concentrations are displayed in ). Sig-ns decreased with the increase of sucrose concentration. The location of feature peak is about 117. ) displays the linear relationship between feature peak values and sucrose concentration, indicating a good linear relationship between peak values and sucrose concentration. For solution of 0.39e-2 M NaCl + sucrose in seven concentrations, capacitance analysis results demonstrate that the feature peak values increase with sucrose concentration. Feature peak emerges at stimulation intensity of about 117 (see )). ) shows the linear fitting regression between feature peak values and sucrose concentration, demonstrating that there is good linear relationship between feature peak values and sucrose concentration.
Figure 3. SNR responses of tastant mixtures: (a) 0.96e-5 M quinine + sucrose in seven concentrations; (b) 1.93e-4 M citric acid + sucrose in seven concentrations; (c) 0.39e-2 M NaCl + sucrose in seven concentrations
A possible explanation to these phenomena lies in the combination situation between tastant molecule and receptor protein within the cells. Glucose is easy to be oxidated. So the detecting signals of glucose and other tastant are of difference. The molecule spacial structure and chemical properties of other tastants is different, leading to some unique sig-ns signals to the sensing system.
Negative control results
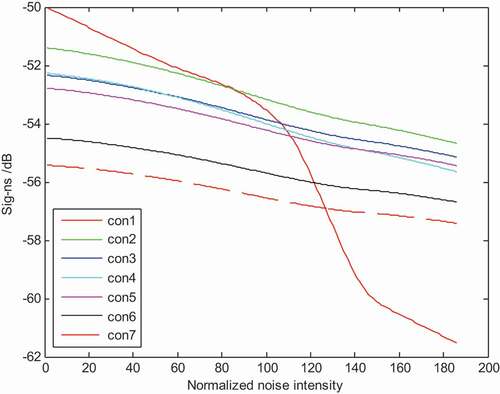
Negative control experimental results are displayed in . Results demonstrated that the electrochemical capacitance sig-ns signals of HEK-293 sensor presented no feature signals on the tastants.
Figure 4. Negative control experiments results of sucrose in seven concentrations
CONCLUSION
Glucose quantitative detection by biological sensor and electrochemical capacitance properties analysis was studied in this paper. The taste cells were obtained from mouse taste bud and fixed on carbon screen-printed electrode. EC responses of cell-based sensor to sucrose in different concentrations and different mixtures were measured. Tastant analysis results demonstrated that the proposed method had quantitative determination abilities toward glucose and related mixtures. There is good linear relationship between feature peak values and glucose concentration. The sig-ns index presented qualitative discrimination abilities to different glucose mixtures. Negative control results indicated that the receptor-free cells showed no perception ability for glucose. A possible explanation to these phenomena was also explored, and the results could be referred to the combination situation between tastant molecule and receptor protein within the cells. It is a easier way for the biological sensor to determine the glucose information, and is promising in glucose rapid detection.
Acknowledgments
This work is financially supported by Clinical Research Fund Project of Zhejiang Medical Association (2018ZYC-A35) and Medical Science and Technology Project of Zhejiang Province (2019KY508). Wan Haifang declares that he has no research interest conflicts. Zhao Jie declares that she has no research interest conflicts. Huang Yanming declares that he has no research interest conflicts. Tao Fan declares that he has no research interest conflicts. Fu Yunbin declares that she has no research interest conflicts.
Additional information
Funding
References
- Iannilli, E.;. Studying Human Gustation: A Multidisciplinary Approach. J. Neurosci. Res. 2019, 97(3), 228–229. DOI: https://doi.org/10.1002/jnr.24375.
- Samant, S. S.; Seo, H. S. Personality Traits Affect the Influences of Iotensity Perception and Emotional Responses on Hedonic Rating and Preference Rank toward Basic Taste Solution. J. Neurosci. Res. 2019, 97(3), 276–291. DOI: https://doi.org/10.1002/jnr.24321.
- Wei, X. W.; Qin, C. L.; Gu, C. L.; He, C. L.; Yuan, Q. C.; Liu, M. X.; Zhuang, L. J.; Wan, H.; Wang, P. A Novel Bionic in Vitro Bioelectronic Tongue Based on Cardiomyocytes and Microelectrode Array for Bitter and Umami Detection. Biosens. Bioelectron. 2019, 145, 111673. DOI: https://doi.org/10.1016/j.bios.2019.111673.
- Pan, Y. X.; Hu, N.; Wei, X. W.; Gong, L.; Zhang, B.; Wan, H.; Wang, P. 3D Cell-based Biosensor for Cell Viability and Drug Assessment by 3D Electric Cell/matrigel-substrate Impedance Sensing. Biosens. Bioelectron. 2019, 130, 344–351. DOI: https://doi.org/10.1016/j.bios.2018.09.046.
- Lei, K. F.; Wu, M. H.; Hsu, C. W.; Chen, Y. D. Real-time and Non-invasive Impedimetric Monitoring of Cell Proliferation and Chemosensitivity in a Perfusion 3D Cell Culture Microfluidic Chip. Biosens. Bioelectron. 2014, 51, 16–21. DOI: https://doi.org/10.1016/j.bios.2013.07.031.
- Liu, Q. J.; Wu, C. S.; Cai, H.; Hu, N.; Zhou, J.; Wang, P. Cell-Based Biosensors and Their Application in Biomedicine. Chem. Rev. 2014, 114, 6423–6461.
- Hui, G.; Lu, H.; Jiang, Z,; Zhu, D.; Wan, H. Study of small-cell lung cancer cell-based sensor and its applications in chemotherapy effects rapid evaluation for anticancer drugs. Biosensors & Bioelectronics, 2017, 97, 184-195. DOI: https://doi.org/10.1016/j.bios.2017.05.050.
- Zou, L.; Wu, C. S.; Wang, Q.; Zhou, J.; Su, K. Q.; Li, H. B.; Hu, N.; Wang, P. An Improved Sensitive Assay for the Detection of PSP Toxins with Neuroblastoma Cell-based Impedance Biosensor. Biosens. Bioelectron. 2015, 67, 458–464. DOI: https://doi.org/10.1016/j.bios.2014.09.005.
- Park, C. Y.; Min, J. H.; Kim, Y. S.; Song, H. J.; Kim, J. D. Development of Portable Electrical-cell-substrate Impedance Sensing System. Sens. Mater. 2019, 31(2), 253–259. DOI: https://doi.org/10.18494/SAM.2019.2091.
- Park, C. Y.; Lee, M. S.; Kim, Y. S.; Song, H. J.; Kim, J. D. Web-based User Interface for Electrical Cell-substrate Impedance Sensing System. Sens. Mater. 2018, 30(10), 2161–2169. DOI: https://doi.org/10.18494/SAM.2018.1818.
- Susloparova, A.; Koppenhöfer, D.; Law, J. K. Y.; Vua, X. T.; Ingebrandt, S. Electrical Cell-substrate Impedance Sensing with Field-effect Transistors Is Able to Unravel Cellular Adhesion and Detachment Processes on a Single Cell Level. Lab Chip. 2015, 15(3), 668–679. DOI: https://doi.org/10.1039/C4LC00593G.
- Gamal, W.; Treskes, P.; Chesne, C.; Plevris, J. N.; Bagnaninchi, P.-O.; Nelson, L. J. P333 Human Hepatic Cc-Culture Model As A Sensitive And Non-Invasive Toxicological Platform Uing ECIS (Electrical Cell-Substrate Impedance Sensing) Biosensors. J. Hepatol. 2011, 136, 177–178.
- Hong, J.; Kandasamy, K.; Marimuthu, M.; Choic, C. S.; Kim, S. Electrical Cell-substrate Impedance Sensing as a Non-invasive Tool for Cancer Cell Study. Analyst. 2011, 136(2), 237–245. DOI: https://doi.org/10.1039/C0AN00560F.
- Wang, L.; Wang, H.; Wang, L.; Mitchelson, K.; Yu, Z. Y.; Cheng, J. Analysis of the Sensitivity and Frequency Characteristics of Coplanar Electrical Cell–substrate Impedance Sensors. Biosens. Bioelectron. 2008, 24(1), 14–21. DOI: https://doi.org/10.1016/j.bios.2008.03.018.
- Qiu, Y.; Liao, R.; Zhang, X. Real-time Monitoring Primary Cardiomyocyte Adhesion Based on Electrochemical Impedance Spectroscopy and Electrical Cell− Substrate Impedance Sensing. Anal. Chem. 2008, 80(4), 990–996. DOI: https://doi.org/10.1021/ac701745c.
- Hui, G.; Zhang, J.; Li, J.;Feng, H. Sucrose quantitative and qualitative analysis from tastant mixtures based on Cu foam electrode and stochastic resonance. Food Chemistry, 2016, 197, 1168-1176. DOI: https://doi.org/10.1016/j.foodchem.2015.11.091.
- Feng, H.; Huang, Z.; Lou, X,; Li, J.; Hui, G. Study of a Sucrose Sensor by Functional Cu Foam Material and Its Applications in Commercial Beverages. Food analytical methods, 2017, 10, 407-418. DOI: https://doi.org/10.1007/s12161-016-0580-9.
- Dong, H. T.; Wang, H. Y.; Shen, X. H.; He, K. Parameter Matched Stochastic Resonance with Damping for Passive Sonar Detection. J. Sound Vib. 2019, 458, 479–496. DOI: https://doi.org/10.1016/j.jsv.2019.06.021.
- Fang, X.; Mei, Z.; Chen, J.; Xiong, S.; Ning, J.; Jiang, C.; Gao, Y.; Yi, X.; Hui, G. A Trehalose Quantitative Sensor Based on Ni Foam Material Modified with Graphene Oxidated and Non-linear Analysis Model. Food analytical methods, 2021. DOI: https://doi.org/10.1007/s12161-021-02028-x.
- Liu, G. K.; Kang, Y. M.; Quan, H. D.; Sun, H. X.; Cui, P. Z.; Guo, C. The Detection Performance of the Dual-Sequence-Frequency-Hopping Signal via Stochastic Resonance Processing under Color Noise. Radio Eng. 2019, 28, 618–626.
- Ying, X.; Lin, H.; Hui, G. Study on Non-linear Bistable Dynamics Model Based EEG Signal Discrimination Analysis Method. Bioengineered. 2015, 6(5), 297–298. DOI: https://doi.org/10.1080/21655979.2015.1065360.
- Ying, X.; Liu, W.; Hui, G. Litchi Freshness Rapid Non-destructive Evaluating Method Using Electronic Nose and Non-linear Dynamics Stochastic Resonance Model. Bioengineered. 2015, 6(4), 218–221. DOI: https://doi.org/10.1080/21655979.2015.1011032.
- Huang, R.; Ning, J.; Mei, Zheng.; Fang, X.; Yi, X.; Gao, Y.; Hui, G. Study of delivery path optimization solution based on improved ant colony model. Multimedia Tools and Applications. 2021. DOI: https://doi.org/10.1007/s11042-021-11142-1.
- Zheng, H.; Ying, X.; Wang, W.; Chen, Z.; Shao, C.; Zhou, H.; Wang, S.; Ping, X.; Li, J.; Yi, X. Study of Sensitivity Evaluation on Ridgetail White Prawn (Exopalaemon Carinicauda) Quality Examination Methods. Int. J. Food Prop. 2019, 22(1), 942–951.
- Zheng, H.; Wang, S.; Ping, X.; Shao, C.; Zhou, H.; Xiang, B.; Li, J.; Lou, X.; Yi, X.; Guohua, H. Study of Spinyhead Croaker (Collichthys Lucidus) Fat Content Forecasting Model Based on Electronic Nose and Non-linear Data Resolution Model. Food Anal. Methods. 2019, 12(9), 1927–1937.