
 ?Mathematical formulae have been encoded as MathML and are displayed in this HTML version using MathJax in order to improve their display. Uncheck the box to turn MathJax off. This feature requires Javascript. Click on a formula to zoom.
ABSTRACT
“Slovak bryndza” is a traditional Slovak cheese manufactured by milling a lump of matured ewe’s cheese or by milling a mixture of lump ewe’s cheese and lump cow’s cheese. The percentage of lump ewe’s cheese is greater than 50% w/w dry matter. Differences in the purchase prices of ewe’s and cow’s milk create the potential for adulteration. The detection of cow’s milk compounds by isoelectric focusing of γ-caseins after plasmolysis is a suitable method for the determination of adulteration of this traditional cheese. The analysis and final results may be affected by factors affecting laboratory activity and biological factors. Biological factors are manifested primarily as variations in the casein content of ewe’s and cow’s milk. Despite this variation, this method may also be used for quantification purposes. We were able to establish a reliable calibration line from the internal reference materials prepared in our laboratory. The mean composition of Slovak bryndza cheese determined in our research was protein 18.7 ± 1.9 g 100 g−1, fat 24.0 ± 1.8 g 100 g−1, lactose 1.5 ± 1.9 g 100 g−1, ash 4.5 ± 0.3 g 100 g−1, fat in dry matter 49.3 ± 2.6 g 100 g−1, casein 18.4 ± 1.9 g 100 g−1, gamma casein 0.60 ± 0.19 g 100 g−1, and bovine-to-ovine gamma casein ratio 0.65 ± 0.12 g 100 g−1.
Introduction
“Slovenská bryndza” (Slovak bryndza) is the traditional cheese of Slovakia. It has been produced continuously for many years and has a historical link to the region. Several historical written sources describe this kind of cheese. Bryndza is part of the Slovak tradition. This cheese is used for the preparation of typical foodstuffs such as “bryndzové halušky” (national Slovak dish made from dumplings and bryndza cheese), “bryndzové pagáčiky” (scones made with bryndza cheese), “pirohy” stuffed with bryndza cheese, and many others .[Citation1] The name “Slovenská bryndza” is PGI (protected geographical indication) registered in the European Union .[Citation2] “Slovenská bryndza” is a natural, white, mature, spreadable cheese in granular form, manufactured according to the traditional method, by milling a lump of matured ewe’s cheese or by milling a mixture of lump ewe’s cheese and lump cow’s cheese. The percentage of lump ewe’s cheese should be greater than 50% w/w dry matter. It has a delicate odor and taste and a pleasantly sour ewe’s cheese taste that is slightly spicy and salty .[Citation1] Another definition of bryndza is provided in the legislation of the Slovak Republic. “Slovenská bryndza” is a natural cheese manufactured from a lump of matured ewe’s cheese or a mixture of this cheese with lump cow’s cheese or a mixture of a stored lump of matured ewe’s cheese and lump cow’s cheese. “Slovenská bryndza” must contain at least 50% w/w ewe’s cheese per dry matter of the product .[Citation3] Lump ewe’s cheese and lump cow’s cheese are manufactured by precipitation of proteins from fresh milk due to the action of rennet and partial separation of whey released at the manufacturing stage .[Citation3] A stored lump of matured ewe’s cheese is a mixture of crushed and milled matured lump ewe’s cheese and salt, perfectly pressed and stored .[Citation3]
The average purchase price of cow’s milk in Slovakia in 2018 was 0.34 €/l of milk, [Citation4] and that of ewe’s milk was 0.970 €/l of milk .[Citation5] The average purchase price of ewe’s bryndza in Slovakia in 2018 was 4.29–7.83 €/kg of cheese .[Citation5] Differences in the purchase prices of ewe’s and cow’s milk, not only in Slovakia but also in neighboring countries, creates the potential for adulteration of “Slovenská bryndza” cheese.
In cheese varieties with a certain degree of proteolysis, isoelectric focusing of gamma caseins according to the EU reference method is strictly recommended .[Citation6] Detection of cow’s milk and caseinate in cheeses made from ewe’s milk by isoelectric focusing of γ-caseins after plasminolysis represents the EU reference method. This method is suitable for sensitive and specific detection of native and heat-treated cow’s milk and caseinate in fresh and ripened cheeses made from ewe’s milk. It is not suitable for the detection of milk and cheese adulterated by heat-treated bovine whey protein concentrates. Generally, this method is intended for qualitative determination .[Citation7]
This laboratory method is commonly known and well described in EU legislation and similar scientific works intended for milk and cheese adulteration. Our innovation concerns the quantification of casein content and individual fractions of γ-caseins in fresh lump cheese. The content of casein and γ-casein fractions in cow’s and ewe’s lump cheese differs, and this fact must be considered when creating a calibration curve. We describe in detail how to construct such a calibration curve. In addition, we describe the possibility of omitting the staining procedure and significantly shortening the total time of this analysis, which is in contrast with the methodology of the EU reference method.
We intended to quantitatively measure the proportion of ewe/cow cheeses in “Slovenská bryndza” by using self-prepared calibration samples of cow’s lump cheese with different proportions of ewe’s lump cheese, which is in contrast with the EU reference method, where only two reference standards (a mixture of renneted ewes’ and goats’ skimmed milk containing 0% and 1% of cow’s milk) are used for qualitative determination. Our intention was to make feasible a quantitative approach to this determination. The quantification of “Slovenská bryndza” was described by Suhaj et al., [Citation8] but these authors used immobilized pH gradient (IPG) strips and bovine/ovine γ3-casein and bovine/ovine γ2-casein ratios in this determination. In contrast with this methodology and the results of their research, we are using ready-to-use Servalite Focus gel 3–10 24 S (Serva), and we are also taking into account different proportions of total caseins, γ3-casein and γ2-casein in ewes’ and cows’ lump cheese, biological and technological factors which have improved this method for quantification purposes.
To protect producers and consumers of “Slovenská bryndza” cheese in Slovakia, it was necessary to introduce an effective analytical tool for detecting the adulteration of this cheese. In this research, we discuss the possibility of using isoelectric focusing of γ-caseins as an analytical tool for the detection of adulteration of “Slovenská bryndza” cheese. We describe the possibility of using this method for quantification. We have validated this method, and it is now commonly used in laboratory practice in the accredited laboratory.
Materials and methods
Experimental design
Fresh cow’s and ewe’s milk was sampled on farms from Slovakia and transported to our laboratory following international standard ISO 707, 2008 at 0–5°C. The composition of milk, including the casein content, was determined by Dairyspec FT (Bentley Instruments, Czech Republic). Consequently, fresh cow’s lump cheese (n = 30), fresh ewe’s lump cheese (n = 30), and mixed Slovak bryndza cheese (n = 30) were made in our laboratory during the half-year. Each month, we prepared five pieces of cheese of each kind.
The composition of cow’s lump cheese, ewe’s lump cheese, and mixed Slovak bryndza cheese were analyzed with the following standard laboratory methods: ISO 1735 (2004) Cheese and processed cheese products. Determination of fat content. Gravimetric method. Reference method; ISO 8968–1 (2014) Milk and milk products. Determination of nitrogen content. Part 1: Kjeldahl principle and crude protein calculation; ISO 22662 (2007) Milk and milk products. Determination of lactose content by high-performance liquid chromatography. Reference method; ISO 5534 (2004) Cheese and processed cheese. Determination of the total solids content. Reference method; ISO 5943 (2006) Cheese and processed cheese products. Determination of chloride content. Potentiometric titration method; the ash content was detected after burning a sample in a muffle furnace at 550°C for 5 h; the casein content (g/kg, %) was analyzed by the gravimetric method after casein isolation with acetone.
The chemicals used for the analyses were of analytical grade purity and obtained from Centralchem, Bratislava; Labo – SK, Bratislava; Merck, Bratislava; and iBioTech Bratislava.
Then, statistical analysis of individual composition parameters of cow’s and ewe’s lump cheese was performed, and the mean value and standard deviation were calculated for each parameter. The content of the gamma-2 and gamma-3 casein fractions in isolated caseins were analyzed after plasminolysis (g/kg and %) by isoelectric focusing. First, two calibration lines were prepared from isolated cow’s and ewe’s caseins mixed in several ratios to check the linearity of the isoelectric focusing method and the possibility of using it for quantification purposes. Second, the real calibration line, taking into account the different casein contents and gamma casein contents in cow’s and ewe’s lump cheeses, was created. This calibration line represents the real composition of Slovak bryndza cheese. Finally, statistical analysis of the densitometric determination of the gamma casein fractions in stained and unstained gels was performed to test the possibility of shortening the analysis time by omitting the staining procedure.
Furthermore, 40 samples of Slovak bryndza cheese produced by different food business operators from Slovakia and purchased from local markets were analyzed. A detailed description of the isoelectric focusing method, including cheese production and casein isolation, is given below.
Equipment
The following equipment was used: grater, Petri dishes, adjustable rod homogenizer 10-mm diameter, rpm range: 8000–20,000 (Lambda Life, Slovakia), extraction tubes, thermostat 40 ± 1°C (ST 1, Intertec, Slovakia), microcentrifuge tubes (Eppendorf), glass plates 265 × 125 × 0.5 mm (GE Healthcare, USA), rubber roller (width 15 cm); Gel-BondTM PAG film 265 × 125 mm (GE Healthcare, USA), Multiphor II Automatic Electrophoresis Device (GE Healthcare, USA), Multitemp II (GE Healthcare, USA), circulation cryostat thermostatically controlled at 17 ± 0.5°C (GE Healthcare, USA), centrifuge adjustable to 3000 g (5702 R, Lab Mark, Czech Republic), isoelectric focusing electrode strips IEF ≥265 mm long (GE Healthcare, USA), plastic dropping bottles for the anode and cathode solutions, plastic sample applicator strip (25 slots, 25 µL), stainless steel scissors, scalpels and tweezers, plastic staining and destaining dishes (280 × 150 mm), magnetic stirrer (RSLAB-1 C, Kvant, Slovakia) ultrasonic bath (LABORATORY 3, Thermo Fisher Scientific, USA), automatic pipettes 10–1000 μl (Finnpipette, Thermo Fisher Scientific, USA), automatic pipette 5–10 mL, (Finnpipette, Thermo Fisher Scientific, USA), refrigerator (2–6°C), freezer (–18 ± 1°C), thermostatically controlled water bath adjustable to 35 and 40 ± 1°C with shaker (SBS40, Ecomed), shaker (RSLAB-7, Kvant, Slovakia), vortex (IKA Vortex 3, Finnpipette, Thermo Fisher Scientific, USA), digestor, stopwatch, waste tank, analytical balance (0.00001 g, Sartorius Entris, Germany), pH meter (HI5221, Lambda Life, Slovakia), black ceramic table, PC with software Gel Pro Analyzer 6.0 (MEYER Instruments, USA), and Canon EOS 550 D Camera (18 Megapixels with manual focusing).
Chemicals and solutions
The following chemicals and solutions were used: Acrylamide/bis solution (T = 40%, c = 3.3%, Serva, Germany), Pharmalyte (6.7–7.7, 0.36 mEg mL−1, Sigma-Aldrich, Slovakia), Ampholine (5–7, 0.4 g mL−1, Sigma-Aldrich, Slovakia), Servalyt (6–8, 40%, Serva, Germany), bovine plasmin (EC. 3.4.21.7, activity at least 5 U mL−1, Roche, Switzerland), Urea (ultrapure, Merck, USA), Dithiothreitol (Merck, USA), Glycerol (87%, Merck, USA), Ammonium persulfate PER (ultrapure, Merck, USA), N,N,N′,N′-Tetramethy-1,2-ethylenediamine (TEMED) (ultrapure, Merck, USA), Repel-Silane (GE Healthcare, USA), Kerosene (Merck, USA), Coomassie Brilliant Blue G-250 (Serva, Germany), Trichloroacetic acid (ultrapure, Merck, USA), Methanol (ultrapure, Merck, USA), Acetic acid (ultrapure, Merck, USA), Glacial acetic acid (ultrapure, Merck, USA), Cooper pentahydrate (ultrapure, Merck, USA), Ethanol (ultrapure, Merck, USA), 1,4-Disulfanylbutane-2,3-diol (ultrapure, Merck, USA), Ammonium hydrogen carbonate (ultrapure, Merck, USA), Ethylenediaminetetraacetic acid EDTA (ultrapure, Merck, USA), ε-Aminocaproic acid (ultrapure, Merck, USA), Persilane (ultrapure, Merck, USA).
Reagents for protein isolation
Soxhlet method: Petrol ether (ultrapure, Merck, USA), Diethyl ether (ultrapure, Merck, USA). Isolation of caseins with acetone: Acetic acid (25 mL of glacial acetic acid were diluted to 100 mL with distilled water), 1 M Ammonium acetate pH 4.6 (800 mL of distilled water were diluted with 67 mL of 96% acetic acid in a 1000-mL graduated flask, 43 mL of 25% ammonia were added, the pH was adjusted with diluted acetic acid, and the volume was made up to 1000 mL with distilled water).
Protein dissolving buffer
Glycerol 5.75 g (87% w/w), urea 24.03 g, and dithiothreitol 250 mg were dissolved in water and the volume adjusted to 50 mL with distilled water. This buffer was stored in the refrigerator for a maximum of 1 week.
Reagents for plasmin cleavage of caseins
Ammonium carbonate buffer: a 0.2 mol L−1 ammonium hydrogen carbonate solution (1.58 g 100 mL−1 in water) containing 0.05 mol L−1 ethylenediaminetetraacetic acid (EDTA, 1.46 g 100 mL−1) was titrated with a 0.2 mol L−1 ammonium carbonate solution (1.92 g 100 mL−1 in water) containing 0.05 mol L−1 EDTA to pH 8). Bovine plasmin (EC. 3.4.21.7): minimum activity 5 U mL−1. ε-Aminocaproic acid solution: for enzyme inhibition (2.624 g ε-aminocaproic acid (6 amino-n-hexanoic acid) was dissolved in 100 mL of 40% (v/v) ethanol).
Milk
Raw ewe’s milk was obtained from the dairy farm Klátova Nová Ves, Slovakia. Raw cow’s milk was obtained from the dairy farm PD Vráble, Slovakia. Cow’s and ewe’s milk were obtained from bulk tanks. Sampling was performed according to ISO 707[Citation9] and before cheese manufacture. Samples were transported and stored at 5 °C. The risk of cross-contamination at farms was eliminated; no other animal species were kept on either farm.
Standards
Certified reference standards of a mixture of renneted ewes’ and goats’ skimmed milk containing 0% and 1% cow’s milk (Commission’s Institute for Reference Materials and Measurements, B-2440 Geel, Belgium), Double-distilled water or of equivalent quality water and analytical grade chemicals must be used.
Preparation of lump ewe’s and cow’s cheese
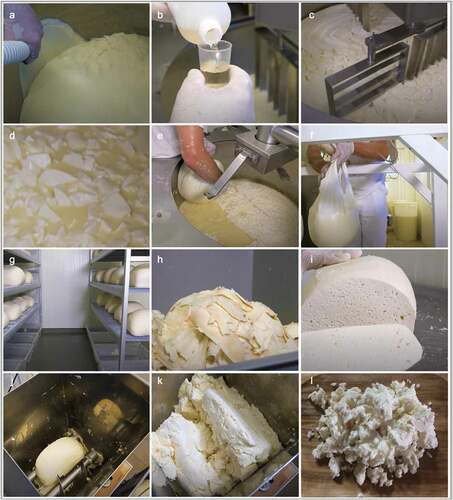
The cheese-making process is described in and , and the cheese was made in accordance with .[Citation3] The cheese was frozen at – 18°C after production until analysis. The Slovak bryndza was prepared by mixing and grinding one part ewe’s lump cheese with one part cow’s lump cheese and adding 2.00 g 100 g−1 of salt.
Table 1. Schedule of the lump cheese production process
Figure 1. The technological process of Slovak bryndza cheese production: (A) Filling the cheese boiler with ewe’s milk. (B) Adding the rennet. (C) Mixing the curd. (D) Curd mixed with whey. (E) Collecting and pressing the curd. (F) Hanging the lump cheese to drain the whey. (G) Fermentation and ripening of the lump cheese. In the first step, the temperature in the fermentation room is 21–25°C for 2–3 days, until the pH is 5.2. In the second step, the temperature is 8–20°C, for 4–6 days, until the pH is 4.2–4.8. (H) Peeling the cheese rind – technological waste. (I) Slicing ripened lump cheese. Typically, there should be small cavities in the cheese. (J) Slices of the lump cheese are ground in a grinder. (K) Ground cheese is mixed with salt (100% ewe’s bryndza cheese) or mixed with salt and ground cow’s lump cheese (at least 50% ewe’s cheese by dry matter). (L) The final product: Slovak bryndza cheese
Isolation of caseins from lump ewe’s cheese and lump cow’s cheese
We used the Soxhlet method for casein isolation from lump cheese. Cheese was grated with a grater into a Petri dish and mixed well. Grated cheese was frozen in the Petri dish at a temperature of – 28°C for approximately half an hour. Approximately 5 g of grated cheese was weighed into another Petri dish and dried in an oven at 40 ± 1°C for 1 h. Dried cheese was crushed in a mortar and mixed with a spoon. Dried cheese was transferred with a spoon to a glass extraction thimble filled with extraction paper for fat removal by Soxhlet extraction, which took 6 h. After extraction, the tube was inserted for 15 min in an oven heated to 40 ± 1°C. Dried casein was crushed in a mortar to produce a flowing powder. Casein powder was transferred to microcentrifuge tubes and stored (away from the light in a dry location).
Isolation of caseins with acetone
A 2.5-g sample of cheese was weighed into a 50-mL centrifuge tube. Ammonium acetate buffer (1 M, pH 4.6) was added and the sample homogenized with a rod homogenizer (8000 to 10 000 rpm) and centrifuged (5 minutes, 3000 g). The top layer (fat and whey) was removed. A 30-mL volume of acetone was added to the residue in a centrifuge tube, and the contents of the tube were mixed by vortexing and filtered through a fluted filter paper. Casein on the filter paper was washed 3 × with 20 mL of cooled acetone. The casein was dried in an oven for 15 minutes at 40 ± 1°C. Dried casein was crushed in a mortar to produce a flowing powder. Casein powder was transferred to microcentrifuge tubes and stored (away from light in a dry place).
Plasmin cleavage of β-caseins to intensify γ-caseins
Ten milligrams of isolated casein was dispersed in 0.5 mL ammonium carbonate buffer and homogenized for 20 minutes in an ultrasonic bath. The sample was heated to 40°C, and 10 μL of plasmin was added, mixed, and incubated for 1 h at 40 ± 1°C with continuous shaking. To inhibit the enzyme, 20 μL ε-aminocaproic acid solution was added, followed by 200 mg of solid urea (pre-weighed into a microcentrifuge tube) and 2 mg of dithiothreitol. The mixture was vortexed and incubated for 1 h at ambient temperature with continuous shaking. To obtain greater symmetry in the focused casein bands, the solution was freeze-dried following addition of the ε-aminocaproic acid, and then the residues were dissolved in 0.5 mL protein dissolving buffer. The reconstituted sample was stored at – 21°C.
Reagents for the production of urea-containing polyacrylamide gels
Stock gel solution was prepared by weighing 9.01 g of urea into a 20-mL volumetric flask, adding 2.4 g of glycerol (87% w/w, approx. 1 mL) and 2500 µL of acrylamide/bis solution (40% AA, 3.3% C), and adjusting the volume to 20 mL with distilled water following dissolution of the chemicals. PER solution (10% w/w) was prepared by weighing 6 mg of ammonium persulfate into a microcentrifuge tube and adding 60 mL of ultrapure distilled water. Ampholyte mixture with a pH range of 5–8 was prepared by mixing ampholytes with different pH ranges: Pharmalyte pH 6.7–7.7 (2.5 parts), Ampholine pH 5–7 (2 parts), and Servalyt pH 6–8 (2 parts).
The gel solution was prepared by pipetting 20 mL of stock gel solution into a 20-mL beaker, adding 1420 mL of ampholyte mixture with a pH range of 5–8, vortexing to mix, then degassing for 5 minutes in an ultrasonic bath. The gel was polymerized by addition of 16 mL of TEMED and 116 mL of PER solution (10% w/w). The gel was poured between the glass plates to approximately 0.5 cm from the top, overlayed with isopropanol, and allowed to polymerize for approximately 45 minutes. The polymerized gel had values of T: 5% and c: 3%.
Vertical polyacrylamide gel preparation
When preparing a gel of thickness 0.5 mm and size 125 × 260 × 0.5 mm we can expect consumption of 20 mL gel solution. Glass plate without sealing is thoroughly degreased with ethanol, then washed with ultra-pure distilled water and wiped to dryness. Then the glass plate is again moistened with ultra-pure distilled water and attached to it with direction from the center to the side with a Gel-BondTM PAG film sheet so that it came under the least possible air bubbles. Foil has a hydrophilic and hydrophobic side. The gel must be applied to the hydrophilic side, protected by paper (it is very important because it can eliminate gel damage during the staining procedure). On the hydrophilic side, the water spills. On the hydrophobic side, water is formed into the shape of water droplets. Place a protective paper sheet on the Gel-BondTM PAG film sheet. Then the water from under the sheet is removed by a roller which is pressed to the paper sheet from the center alternately on both sides. The protective paper sheet is removed from the Gel-BondTM PAG film sheet and the presence of air bubbles is checked. There should be as few as possible air bubbles because, after the polymerization, the Gel-Bond film with polyacrylamide gel has to be easily removed without damage to the gel. The glass plate with the seal also has to be degreased with ethanol and then washed with ultra-pure distilled water and wiped to dryness. On the plate is then 1 mL of persilane spread over the surface. Persilane must be wiped dry with paper towels. Glass plates are connected by clips and placed in a rack. Prepare the gel solution, which immediately after preparation is poured from the top side with a pipette from the middle so to eliminate the formation of air bubbles, poured the gel into 0.5 cm from the top edge. After pouring the gel immediately overlay the gel with a small volume of isopropanol (the larger volume of isopropanol can rise through the glass during the opening glass panels and it would lead to the contact of isopropanol with the gel and this can cause creation the of air bubbles in the gel). The polymerization takes 45 minutes. After polymerization clips are removed and glass plates are inverted upside down which could leave residues of isopropanol. Glass plates are carefully opened with a spatula (it is necessary to avoid any mechanical damage to the gel and damage with air bubbles). Gel-BondTM PAG film sheet with polyacrylamide gel is wiped from the bottom with paper towels (it is necessary to wipe off the excess of isopropanol). The prepared gel can be used immediately, or it can be rolled into the tube (two titration flask connected with parafilm tape), which is protected against drying out and placed in a refrigerator prepared gel can be stored at 2–6°C for max. 1 month. Used glass plates are cleaned with ethanol and ultra-pure distilled water and wiped with paper towels.
Ready-to-use gels
It is possible to use commercial ready-to-use gels and thus omit the lengthy gel preparation procedure. We recommend the Servalite Focus gel 3–10 24 S (Serva), 0.65 mm thick precast polyacrylamide gel, bound to GEL-FIX™ support film for isoelectric focusing. The gels are nontoxic because catalysts and other non-polymerized substances such as acrylamide monomers are removed from the matrix. They contain a special SERVALYT™ cocktail designed to achieve an optimal pH gradient. Electrode solutions and electrode strips are not required, as the electrodes are placed directly on the gel surface.
Reagents for isoelectric focusing
Anode solution was prepared fresh by weighing 2.8235 g of phosphoric acid (85% w/w), adding 6 g of glycerol (87% w/w), and diluting to 50 mL with ultrapure distilled water. Cathode solution was prepared fresh by weighing 1 g of sodium hydroxide, adding 6 g of glycerol (87% w/w) and diluting to 50 mL with ultrapure distilled water.
Reagents for protein staining
Fixative: Fixative solution, 20% (v/v) trichloroacetic acid TCA, was prepared by mixing 160 mL ultrapure distilled water with 40 mL TCA 100% (v/v) (500 g TCA diluted to 500 mL with ultrapure distilled water). Fixative solution, 5% (v/v) trichloroacetic acid TCA, was prepared by mixing 210 mL ultrapure distilled water with 70 ml TCA 20% (v/v).
Regeneration solution: The regeneration solution was prepared by diluting 500 mL methanol and 200 mL glacial acetic acid to 2000 mL with distilled water. The destaining solution was prepared fresh every day by mixing equal volumes of stock solutions of 50% (v/v) methanol and 20% (v/v) glacial acetic acid.
Staining and destaining solutions: Staining stock solution 1 was prepared by dissolving 3.0 g Coomassie Brilliant Blue G-250 in 1000 mL 90% (v/v) methanol using a magnetic stirrer (approximately 45 minutes) and filtering through two medium-speed, folded filters. Staining stock solution 2 was prepared by dissolving 5.0 g copper sulfate pentahydrate in 1000 mL 20% (v/v) acetic acid. Staining working solution was prepared by mixing 125 mL of each stock solution immediately before staining. The staining solution was prepared on the day of use. Destaining solution was prepared by mixing 200 mL methanol 50% (v/v) and 200 mL glacial acetic acid 20% (v/v).
Isoelectric focusing
Start the predefined program on the isoelectric focusing equipment (). The amount of the sample applied to the application strip holes can be 15 or 20 µL of the sample. Samples must be applied to each second hole (this eliminates the blend of the sample in the gel).
Table 2. Isoelectric focusing setup
Fixation
The gel was immersed for 45 minutes in a fixative solution of 20% TCA in a plastic container with a cover under constant agitation on a shaker with low-frequency oscillations. The gel was further fixed overnight at 4°C in a fixative solution of 5% TCA in a closed container. After fixation, the gel was washed two times 30 minutes with 200 mL 5% TCA and 2 times 30 seconds with a regenerative destaining solution. The image of the gel can be obtained by camera or scanner after completion of fixation, proteins are fixed and visible, but, if necessary, the dye staining solution may be applied for the archiving of stained gel.
Staining
The gel was stained for 45 minutes immersed in 200 mL of staining solution without shaking.
Destaining
The gel was immersed in destaining solution for 10–15 min and then washed once for 30 seconds with 150 mL ultra-pure distilled water. Destaining the gel is very important, bad destaining can be caused due to air bubbles under the gel, used ampholytes and their distribution on the gel, poor concentration, and destaining solution, especially failure to meet the time of destaining. Background of the gel after destaining should not be very dark (it is necessary to recognize individual casein fractions), also much-destained gel can cause problems especially at low concentrations of gamma casein.
Drying
After destaining, the gel was dried. The lower part of the film was wiped with a paper towel, and the gel was dried in the open air. The dried gel was stored between sheets of foil, protected from light, in a dry place.
Image capture
Images of the gel () were obtained by scanning the dried and stained gel with a suitable scanner (minimum resolution 600 dpi, TIF format, grayscale) or by photographing the stained gel with a camera with a resolution of at least 15 Megapixels. The second option is to photograph the fixed unstained gel. The obtained image was processed in RAW format and then converted to grayscale TIF format using the software Gel–Pro Analyzer 6.0.
Figure 2. Casein fraction separated after isoelectric focusing: r1 – bovine γ2-casein, r2 – ovine γ2-casein, r3 – bovine γ3-casein, r4 – ovine γ3-casein. Ratio of bovine to ovine γ2-and γ3-caseins (%)
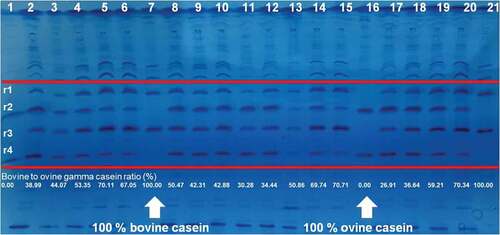
Image processing
Image processing (), image analysis, and evaluation of measured data were performed using the software Gel–Pro Analyzer 6.0 or another image processing software program. The image was processed and analyzed according to the software manual. The image was processed in several consecutive steps. It was necessary to transform the image of the stained gel to grayscale and subsequently invert the image. An image of an unstained gel with white bands was inverted to grayscale and the colors subsequently inverted to dark. The next step of image processing was the removal of background noise.
Figure 3. Image processing of the casein fraction separated after isoelectric focusing: peak 1 – bovine γ2-casein, peak 2 – ovine γ2-casein, peak 3 – bovine γ3-casein, peak 4 – ovine γ3-casein
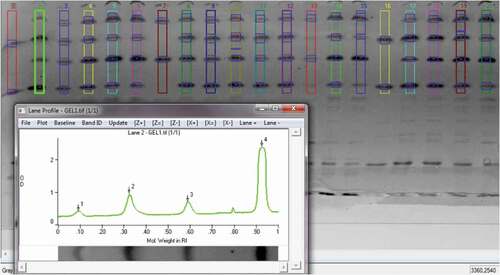
Image analysis
Lines with protein bands were identified automatically by software or manually. The line width, length, and, if necessary, shape were set. Consequently, individual bands were detected by the software or manually, and the height of the band was set manually. The most important part of the gel contained γ2- and γ3-casein band markers. Analysis of these markers included the densitometric determination of the density of the peak area ratio of bovine to ovine γ2- and γ3-caseins. The obtained value was compared with the peak area ratio of γ2-and γ3-caseins of the reference standards (casein isolated from Slovak bryndza cheese with different amounts of cow compounds 0%, 10%, 20%, 30%, 40%, 50%, 60%, 70%, 80%, 90%, and 100% of dry matter). The second option (described in detail in this article) was to plot the results of the densitometric analysis on the calibration line, which represented the real concentration of casein and gamma casein fractions in cow’s and ewe’s cheeses. This calibration line should respect the different contents of casein in dry matter of cow’s and ewe’s lump cheeses, which are mixed in bryndza cheese, and the different % ratios of bovine and ewe gamma casein. The data (densitometric values) were exported to Microsoft Excel and evaluated.
The method is operating satisfactorily if there is a clear positive signal for both bovine γ2- and γ3-caseins in the 1% reference standard but not in the 0% reference standard. A sample is judged as being positive if both bovine γ2- and γ3-caseins and the corresponding peak area ratios are equal to or greater than the level of the 1% reference standard.
A positive control (100% ewe casein), negative control (100% cow casein), and 1% reference standard (99% casein = ewe, cow 1% casein) were analyzed on the same gel. It was not necessary to include the calibration line on the same gel as the samples, because the analysis was based on the ratio of gamma casein (%), not the gamma casein amounts.
Evaluation of measured data
The bovine-to-ovine gamma casein ratio can be calculated from the results of densitometric determination according to EquationEq. 1(1)
(1) .
where r – is the density of the bands (r1 – bovine γ2-casein, r2 – ovine γ2-casein, r3 – bovine γ3-casein, r4 – ovine γ3-casein). After determination of the bovine-to-ovine gamma casein ratio, the amount of bovine casein and ovine casein in samples with a known amount of these caseins (self-prepared calibration samples) was determined by using a linear calibration line ( and ), with EquationEq. 2(2)
(2) representing the equation of the line. We used this approach to test the feasibility of using this method for quantification purposes.
Figure 4. Calibration line 1 (unstained gel)
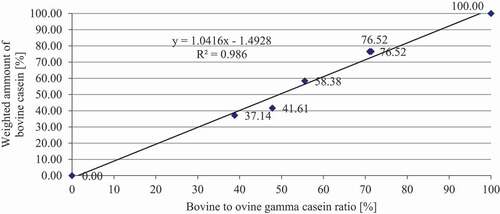
Figure 5. Calibration line 2 (unstained gel)
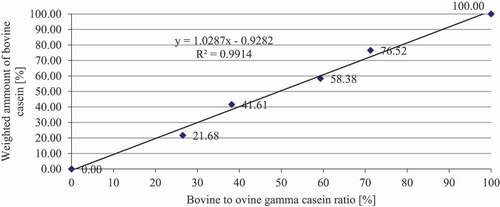
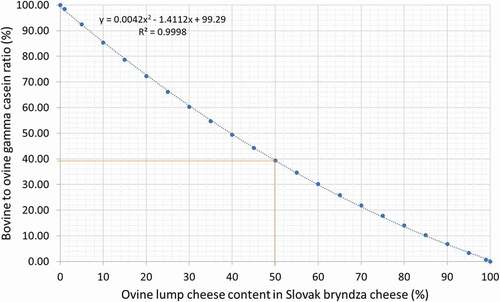
where y is bovine casein (%) in cheese sample; x is bovine to ovine gamma casein ratio (%). In the case of real cheese samples with an unknown ovine and bovine casein content, it is not possible to use the above-mentioned linear calibration line ( and ). In this situation, it is necessary to use the quadratic model[Citation8] or the polynomial model as described in . The calibration line must include the fact that cow’s and sheep’s milk contain different amounts of casein and, at the same time, different amounts of the gamma-2 and gamma-3 casein fractions. This means that if we mix one part of lump cow’s cheese with one part of lump ewe’s cheese with the same dry matter content, then the bovine-to-ovine gamma casein ratio will not be equal to one. From a practical point of view, it is necessary to first determine this bovine-to-ovine gamma casein ratio (%) in an unknown sample of the cheese by densitometry analysis, then plot it on the calibration line (), and finally, read the content of ewe’s lump cheese from this calibration line.
Figure 6. The calibration curve for determination of the ewe’s lump cheese content (%) in Slovak bryndza cheese mixed with cow’s lump cheese
Statistical analysis
Statistical analysis of produced lump cheeses: We first performed a Shapiro–Wilk test to test the normality of the data on 30 samples of the cheese produced. Subsequently, we used a t-test to determine whether there was a difference between these cheeses in individual parameters (dry matter, protein, fat, lactose, ash, fat in dry matter, casein and gamma casein, pH). The analysis was performed separately for both cow’s lump cheese and ewe’s lump cheese. We have considered the results to be significant at p < .05.
Statistical comparison of lump cheeses: Then, one-way ANOVA was performed to test for statistical differences between each parameter of the composition of two groups of data (cow’s and ewe’s lump cheese). We determined statistical difference between dry matter, protein, fat, lactose, ash, fat in dry matter, casein and gamma casein content in cow’s and ewe’s lump cheese. We considered the results to be significant at p < .05. The mean value and standard deviation of the casein content in cow’s and ewe’s lump cheese were calculated.
Statistical comparison of stained and unstained gels: The Shapiro–Wilk test and paired t-test were used for statistical analysis of two groups of data (the bovine-to-ovine ratio determined in stained and unstained gels). We considered the results to be significant at p < .05. We used XLSTAT 2020.5 statistical software by Addinsoft.
Results and discussion
We found a mean casein content of 2.6 g 100 g−1 (n = 30) in raw cow’s milk and 19.08 ± 0.66 g 100 g−1 (n = 30) in cow’s lump cheese prepared in our laboratory, and 2.64% of the casein content in cheese was related to gamma casein, 0.50 ± 0.14 g 100 g−1 (). We found a mean casein content of 4.7 g 100 g−1 (n = 30) in raw ewe’s milk and of 21.22 ± 0.83 g 100 g−1 (n = 30) in ewe’s lump cheese prepared in our laboratory, and 3.60% of the casein content in cheese was related to gamma casein, 0.76 ± 0.24 g 100 g−1 (). We analyzed our experimental results by one-way ANOVA and found statistically significant (p < .05) differences between the results of all composition parameters of cow’s and ewe’s lump cheeses. Given that there are significant (p < .05) differences in the composition of these two kinds of cheese, this fact must be taken into account in the formation of the calibration line. The differences in composition parameters were the following: dry matter content 46.02 vs 52.98 g 100 g−1, protein content 19.75 vs 21.94 g 100 g−1, fat content 22.88 vs 27.52 g 100 g−1, lactose 1.63 vs 1.37 g 100 g−1, ash 1.76 vs 2.22 g 100 g−1, casein 19.08 vs 21.22 g 100 g−1, and gamma casein 0.50 vs 0.76 g 100 g−1. These results are in agreement with those of other researchers .[Citation10] They found a fat content of 19.4%–26.3% and a dry matter content of 42.5%–54.1% in commercial Slovak bryndza cheeses purchased from the market.
Table 3. Results of cow’s lump cheese composition determination
Table 4. Results of ewe’s lump cheese composition determination
Table 5. Results of Slovak bryndza cheese composition determination
Table 6. Weighted amounts of ovine and bovine casein (mg)
Table 7. Results of densitometric determination of peak area of gamma caseins in the unstained gel
Table 8. Results of densitometric determination of peak area of gamma caseins in the stained gel
Table 9. Bovine-to-ovine gamma casein ratio in Slovak bryndza cheese with different ovine and bovine contents
The variability of the protein content in ewe’s milk in Slovakia was also published by Oravcová et al. .[Citation11] The mean content of proteins in the Tsigai breed was 5.94 g 100 g−1 ± 0.69%, Improved Valachian 5.82 g 100 g−1 ± 0.62%, and Lacaune 5.62 g 100 g−1 ± 0.692%. The mean protein content in ewe’s milk in Slovakia was 5.86 g 100 g−1 (4.928–6.30 g 100 g−1). The protein content in ewe’s milk is 5.5 g 100 g−1 ± 0.62%, and the casein content is 4.7 g 100 g−1 ± 0.5% .[Citation12] The casein content in ewe’s milk was 80.7–82.69% .[Citation13] The casein content in ewe’s milk can be affected by the somatic cell count and can vary from 76.37% to 79.71% .[Citation14] The casein content in ewe’s milk is 80%–85% .[Citation15] The content of the gamma casein fraction in ewe’s milk casein is 9 ± 1% .[Citation16] The content of gamma casein in cow milk is 2.4% of the total protein content .[Citation17] The mean protein content in cow’s milk in Slovakia was 3.32 g 100 g−1 ± 2.54%, and the casein content was 2.61 g 100 g−1 ± 2.46% n = 94,146 .[Citation18–20] The content of the gamma casein fraction in cow’s milk is 6 ± 2% .[Citation16] In contrast with these results, we found the following variation in gamma casein as a percentage of the total casein content: 2.64 ± 0.79% in cow’s lump cheese, 3.60 ± 0.79% in ewe’s lump cheese, and 3.10 ± 0.58% in Slovak bryndza cheese 0.66%.
Subsequently, we performed isoelectric focusing to test if it was possible to clearly distinguish specific markers and use this method for quantification purposes. Separated casein fractions are presented in . In this image, 21 vertical lines can be seen, and each of these lines consists of several bands. The most important area is highlighted with red lines. In this area, the γ2-casein (horizontal rows r1 and r3) and γ3-casein (horizontal rows r2 and r4) fractions are located. In the case of 100% bovine casein, there are missing γ2-casein bands in the horizontal rows r2 and r4. In the case of 100% ovine casein, there are missing γ3-casein bands in rows r1 and r3.
represents image processing in the Gel–Pro Analyzer software. The x-axis represents the molecular weight in Rf of proteins isolated on the gel. The Rf is the migration distance of the protein. Bands are visualized as peaks. The peak area is given by the interval of molecular weight and the height of the peak. If the protein concentration in the band is higher, then the color of the band is darker, and the peak is higher. The density of the band is given by the area of the peak, and a larger area means a higher band density. We have calculated only the density of individual bands located in rows r1, r2, r3, and r4.
The weighted amount of ovine and bovine casein is presented in . We calculated bovine casein (%), ovine casein (%), and the total amount of casein in the sample (mg). Results of densitometric determination of peak area of gamma caseins in the unstained gel are presented in and of those in the stained gel in . We calculated the bovine-to-ovine gamma casein ratio (%) from individual r1, r2, r3, and r4 gamma casein markers.
For this study, two calibration lines ( and ) were created with the bovine- to-ovine ratio (%) (x-axis) () and the weighted amount of cow casein (%) (y-axis) (). We obtained calibration lines with satisfactory characteristics (R2 = 0.986 and R2 = 0.9914), which described the linear model well. Therefore, this method can be used for quantification purposes. Also, Suhaj et al.[Citation8] calculated similar calibration characteristics. These authors used the ratios of bovine/ovine γ3-casein and bovine/ovine γ2-casein, which improved the characteristics of the calibration curves (R2 = 0.9911; R2 = 0.9971). We agree with the results of their research: the bovine-to-ovine ratio (%) should be used to calculate the calibration line because the ovine and bovine γ2- and γ3-peaks alone did not provide acceptable results for the determination of the proportion of ewe and cow casein in cheese samples. However, in contrast with these authors, we also found it necessary to take into account different concentrations of casein and γ2- and γ3-caseins in ewe’s and cow’s lump cheese (), as well as biological and technological factors. The ratios of casein fractions were also successfully used by several authors .[Citation21–23]
The mean casein content and gamma casein ratio of cow’s and ewe’s lump cheeses ( and ) were used to create the calibration line ( and ), where the bovine-to-ovine gamma casein ratio was plotted on the y-axis and the ovine lump cheese content (%) on the x-axis ( and ). This calibration line represents the real proportion of ewe’s and cow’s caseins in Slovak bryndza cheese.
The accuracy of this calibration line is satisfactory R2 = 0.9999, but it can be improved by a detailed analysis of the composition of milk and cheese prepared from different ewe and cow breeds during different periods of lactation and from different years. The analysis of the fat content, solids content, protein content, casein content, and gamma casein fractions in ewe’s and cow’s lump cheese produced during different periods of the year and analysis of the composition of many samples of cheese prepared by food business operators will increase the robustness of the calibration line and should be taken into account during the calculation of the uncertainty of the measurement. The gamma casein content in cow’s and ewe’s lump cheese should be determined on a large number of samples from all over Slovakia and from different kinds of bryndza cheese (mixed winter, spring, and summer). The content of gamma casein found in cow’s lump cheese was 2.64 ± 0.79%, and that in ewe’s cheese was 3.60 ± 1.14%. The standard deviations were found to overlap, which means that analysis of a large data set will be necessary. The analysis may be influenced by the above-mentioned biological factors, in particular by a change in the content of milk components such as protein, casein, and gamma casein.
The advantages of this method are its ease of use and good reproducibility by application of ampholytes with a high concentration of urea .[Citation24] Also, Špoljarić et al.[Citation23] proved that this method has to be reliable and sensitive to detect raw cow’s milk in fresh and ripened cheeses produced from ewe’s or goat’s milk, or mixtures of ewe’s and goat’s milk. We agree, but the method is very time-consuming; however, the staining procedure can be omitted.
One of the aims of our research was to evaluate the possibility of omitting the gel staining procedure, which is time-consuming and sometimes can lead to problems. We have empirically found that caseins are well precipitated on the gel after isoelectric focusing and fixation with a fixative solution of 20% TCA, and they are well visible. Therefore, we analyzed the results of densitometric determination of unstained and stained gels with statistical methods. First, we performed the normality test on both data sets. The result of the Shapiro–Wilk test was 0.324 and indicated that the data had a normal distribution. Since the p-value was >α, H0 is accepted, and the average is considered to be equal to the μ0. Consequently, we analyzed the results of densitometric determination of unstained and stained gels by a paired t-test. The calculated p-value was 0.426. This means that if we were to reject H0, the probability of a type I error (rejecting a correct H0) would be too high: 42.69%. The results were not significantly different at p < .05; therefore, it is possible to use an unstained gel in this determination.
Also, we analyzed 40 commercial samples of Slovak bryndza, purchased in the supermarkets and local markets. The obtained results are summarized in . These results are similar to those of Slovak bryndza prepared in our laboratory conditions (). Slovak bryndza from markets had a lower dry matter, – 3.25 g 100 g−1; protein, – 2.79 g 100 g−1; and casein, – 2.49 g 100 g−1 content. The bovine-to-ovine gamma casein ratio was almost identical. In the future, we would like to analyze an even larger number of commercial Slovak bryndza samples over a longer period, to obtain more robust data.
Table 10. Mean results of the Slovak bryndza purchased from the market
Adulteration of milk and dairy products with different types of milk, other than those declared on the label, presents a big problem for food monitoring. Analysis of milk proteins is a suitable solution to this problem, [Citation25] but in the case of the detection of cow’s milk proteins in ewe’s milk, it is necessary to first perform plasminolysis of γ-caseins. Following plasminolysis, bovine beta-casein will be cleaved into specific γ-caseins, which can be used as specific markers. This proteolysis will result in the formation of γ-2 and γ-3 caseins, [Citation7,Citation22,Citation26,Citation27] which can be seen in . Hydrolysis of cheese proteins with plasmin and consequent separation of bovine, ovine, caprine, and buffalo γ-caseins by isoelectric focusing at pH 3–10 according to their different isoelectric points and the densitometric evaluation of the electrophoretic bands must performed .[Citation24] Detection of cow’s milk in ewe’s cheeses is based on the separation of proteins in polyacrylamide gels. Proteins have different isoelectric points (pI) at which they remain immobilized in the gel. Cow’s γ2- and γ3-caseins, originating from the hydrolysis of β-casein by plasmin, in comparison with the value of the isoelectric points of the same proteins from ewe’s or cow’s milk, have different pI values .[Citation7] The isoelectric points of cow’s γ2- and γ3-casein are at pH values of 7.0 and 6.5, respectively, as opposed to those of ewe’s or goat’s γ2- and γ3-casein, which are at 7.2 and 6.7 .[Citation24] This means that after protein separation, specific protein bands can be seen on the polyacrylamide gel (). Consequently, these bands can be used as markers to determine the bovine-to-ovine ratio in the cheese. Also, the quantification of the cheese type present in the mixture of cow’s and ewe’s cheese can be calculated when an appropriate calibration curve is prepared. The problem with the γ2-casein marker should be expected in aged cheeses, where it could be affected by proteolysis. The presence of modified γ2-casein (with pI = 6.7), which derives from the interaction between γ2-casein and aldehydes coming from microbial metabolism, could be present on the gel .[Citation28] There are several methods available to detect adulteration in ewe’s cheese, [Citation29–31] and these can be used in combination with this method to validate the results.
Since too many variables affect the percentage of individual cheeses in mixed Slovak bryndza cheese, the obtained quantitative results should be considered only as approximate values in the adulteration control .[Citation8] We agree that several factors that may affect the outcome of this method should be taken into account. Further experiments should be performed to investigate the effect of the bovine-to-ewe casein ratio in mixed cheese, changes in the content of individual casein fractions during the lactation period in different ewe and cow breeds, season, somatic cells, the effect of rennet and heat treatment of milk, the addition of protein concentrates to milk, and the length of cheese ripening.
The moisture content decreased during ripening in all cheeses. Most whey drained from the cheese within the first 24 h of lump formation. During the remaining days, the remaining whey residues drained from the cheese only very slowly, and at the end of the maturing process, none of the whey flowed away. The cheeses had to be turned regularly during the fermentation and maturation process and wiped with a cloth to dry the cheese surface.
The moisture in the cheese would be considered as a relevant source of different proteolysis types .[Citation32] Primary proteolysis in cheese may be defined as those changes in caseins and peptides that can be detected by electrophoretic methods and is mainly the result of the action of indigenous proteinases and the residual coagulant. However, proteinases from starter lactic acid bacteria and nonstarter microorganisms are also active in the degradation of cheese proteins .[Citation33] Secondary proteolysis is attributed to the proteinases and peptidases of the cheese microorganisms, which degrade medium-to-large casein peptides to low-molecular-weight peptides and free amino acids .[Citation34] The protein and moisture contents of the cheeses were unaffected by SCC, but a significant increase in pH with ripening time was observed in high-SCC cheeses. The results also pointed to a significant increase in proteolysis related to SCC levels, showing that intact casein, both alphas1, and beta-casein, decreased as the SCC of milk increased and that the proteolytic fragments, mainly I-alphas1, increased with SCC levels .[Citation35]
All of these factors can affect the precision and accuracy of this laboratory method and will be examined in our further research. Also, we agree with Mayer et al., [Citation22] who stated that, because of the different casein contents of ewe’s and goat’s milk, different calibration curves must be used for cheeses made either from cow’s and ewe’s milk or from cow’s and goat’s milk. As the estimated percentage of cow’s milk in mixed cheese is greatly affected by the casein content of the milk used for cheesemaking, quantitative results in adulteration control must be regarded as approximate values.
On the other hand, our results prove that isoelectric focusing of gamma caseins can also be used for quantification of bovine and ovine gamma casein in Slovak bryndza cheese. During the validation of this method, we fulfilled all requirements of the international standard ISO 17025. All measurement tools, such as analytical scales or pipettes, were calibrated by Slovak legal metrology and regularly checked during the experiments. The principles of good laboratory practice were fulfilled and verified by internal audits. We determined several analytical characteristics of this method. The LOD was given by a certified reference standard as 1% of bovine casein in ovine casein. The LOQ of bovine gamma casein in the sample was 100%. The accuracy of the method was determined on two different mixtures of ovine and bovine caseins (41.61% and 55.83%), which were around the set legislation limit of 50% w/w of bovine cheese in ovine cheese in dry matter. Consequently, the determined casein content was 41.51% and 56.37%. These values represent the yield (99.76% and 100.97%). The interlaboratory reproducibility of the method was tested by the work of four laboratorians, which analyzed the same sample at different times. The calculated interlaboratory reproducibility was 1.22%. When calculating the uncertainty of the measurement, we identified several analytical operations or instruments that can be a source of individual uncertainties of the B type, for example, the analytical balance used for weighing cheese samples and casein, as well as the pipettes used for pipetting 0.5 mL of ammonium carbonate buffer, 0.02 mL of ε-aminocaproic acid, 0.5 mL of dithiothreitol, and 0.025 mL of sample onto the gel. Consequently, we took into account the uncertainty of the calibration line, the variability of the casein content in ewe’s and cow’s milk, and the variability of gamma casein fractions. Finally, we calculated the combined expanded uncertainty of measurement U as the sum of the final U of the laboratory work (1.38%) + U of the variability of protein content in Slovak bryndza cheese made by food business operators (10%, n = 40), which includes the variation in biological factors such as the breed and lactation period, as well as technological factors such as the different dry matter contents of cow’s and ewe’s lump cheese, different concentrations of salt, which increase the dry matter content of cheese, addition of CaCl2 in renneting, different age of the lump cheese, different concentrations of casein and gamma casein in milk, and finally, the bovine-to-ovine gamma casein ratio. The final uncertainty of measurement U was 11.38% at a concentration level of 50% of ewe’s lump cheese in the mixed Slovak bryndza cheese.
Based on the values calculated during the method validation, we can conclude that this laboratory method is suitable for the quantification of the proportion of ewe’s and cow’s lump cheeses in Slovak bryndza cheese. This conclusion is valid only if the manufacturer has complied with the standard operating procedure specified in the legislation. Other methods of adulteration, in particular, the addition of whey proteins or the effect of milk pasteurization or ultra-high-temperature treatment of milk before cheesemaking need to be examined in further research. The amount of casein in each type of milk or animal species should be investigated to reduce the calculated uncertainty of measurement.
We recommend that producers need to avoid technological mistakes and adjust their product specifications of mixed Slovak bryndza cheese so that the proportion of ewe’s lump cheese to cow’s lump cheese would be 60:40 to avoid problems with composition and to fulfill the product specification and protected geographical indication of the Slovak bryndza cheese.
Conclusion
Isoelectric focusing of γ-caseins after plasminolysis can be used for the quantitative determination of ewe’s and cow’s lump cheese in traditional Slovak bryndza cheese. We tested the cheese, which was made by mixing ewe’s and cow’s lump cheese that was made from unpasteurized ewe’s and cow’s milk. The calculated extended uncertainty of measurement U was 11.38% for this laboratory method. This method can be applied in routine laboratory practice to detect adulteration of specific cheese products consisting of ewe’s and cow’s milk or their mixture. It is possible to shorten the method by omitting the staining procedure following isoelectric focusing and take a photo or scan the unstained fixed gel. In further research, we want to focus on several factors that can affect the results and improve the accuracy and precision of this laboratory method. The mean composition of Slovak bryndza cheese determined in our research was the following: protein 18.65 ± 1.90 g 100 g−1, fat 23.97 ± 1.75 g 100 g−1, lactose 1.47 ± 1.90 g 100 g−1, ash 4.54 ± 0.28 g 100 g−1, fat in dry matter 49.34 ± 2.55 g 100 g−1, casein 18.38 ± 1.92 g 100 g−1, gamma casein 0.60 ± 0.19 g 100 g−1, and the bovine-to-ovine gamma casein ratio 0.65 ± 0.12 g 100 g−1. Adulteration of food with a protected geographical indication has a great impact on all involved parties, including producers, farmers, consumers, enterprises, the government, and official food control authorities. Creating a detailed product specification and developing reliable analytical methods are essential to ensure the integrity of the system and build consumer confidence. A decrease in consumer confidence could lead to economic losses and the loss of traditions. Manufacturers need to be aware that there are reliable laboratory methods to detect food adulteration. Our proposed laboratory method will contribute to the detection of illegal practices and strengthen the position of responsible food business operators in the market.
Disclosure statement
The authors declare no conflict of interest
Additional information
Funding
References
- EC. 2007. Publication of an Application Pursuant to Article 6(2) of Council Regulation (EC) No 510/2006 on the Protection of Geographical Indications and Designations of Origin for Agricultural Products and Foodstuffs. Off. J. Eur. Union. 50(4), 17–22. October, 2007, C 232
- EC. 2008a. Commission Regulation (EC) No 676/2008 of 16 July 2008 registering certain names in the Register of protected designations of origin and protected geographical indications (Ail de la Drôme (PGI), Všestarská cibule (PDO), Slovenská bryndza (PGI), Ajo Morado de Las Pedroñeras (PGI), Gamoneu or Gamonedo (PDO), Alheira de Vinhais (PGI), Presunto de Vinhais or Presunto Bísaro de Vinhais (PGI)) In Official Journal of the European Union, 51, 17. July, 2008, L 189, 19–20.
- MARD SR. 2016. Decree of the Ministry of Agriculture and Rural Development of the Slovak Republic on Certain Milk Products. In Coll. of the law of the SR.
- PPA-ATIS. 2019. Milk and Dairy Market Report April 2019. Agrárne trhové informácie Slovenska (Agrarian market information of Slovakia), 27:1, 1–58. https://www.apa.sk/download.php?afID=2104
- Gálik, J. 2019 Situation and Prospective Report NPPC-VÚEPP Bratislava. Sheeps, 27:1, 1–58. http://www.vuepp.sk/dokumenty/komodity/2019/OV04_19.pdf
- Mayer, H. K.;. Milk Species Identification in Cheese Varieties Using Electrophoretic, Chromatographic and PCR Techniques. Int. Dairy J. 2005, 15(6–9), 595–604. DOI: https://doi.org/10.1016/j.idairyj.2004.10.012.
- EC. 2008b. Commission Regulation (EC) No 273/2008 of 5 March 2008 Laying down Detailed Rules for the Application of Council Regulation (EC) No 1255/1999 as Regards Methods for the Analysis and Quality Evaluation of Milk and Milk Products. Off. J. Eur. Union. 88, 53–61. 51, 29. March, 2008
- Suhaj, M.; Stankovská, M.; Kolek, E. Quantification of Ovine and Bovine Caseins in Slovakian Bryndza Ewes’ Cheese by Isoelectric Focusing. J. Food Nutr. Res. 2010, 49(1), 45–52.
- ISO 707:2008. (2008) Milk and milk products. Guidance on sampling. International standard organization.
- Štefániková, J.; Ducková, V.; Miškeje, M.; Kačániová, M.; Čanigová, M. The Impact of Different Factors on the Quality and Volatile Organic Compounds Profile in “Bryndza” Cheese. Foods. 2020, 9, 1195. DOI: https://doi.org/10.3390/foods9091195.
- Oravcová, M.; Margetín, M.; Peškovičová, D.; Daňo, J.; Milerski, M.; Hetényi, L.; Polák, P. Factors Affecting Ewe’s Milk Fat and Protein Content and Relationships between Milk Yield and Milk Components. Czech J. Anim. Sci. 2007, 52(7), 189–198. DOI: https://doi.org/10.17221/2274-cjas.
- Balthazar, C. F.; Pimentel, T. C.; Ferrão, L. L.; Almada, C. N.; Santillo, A.; Albenzio, M.; Mollakhalili, N.; Mortazavian, A. M.; Nascimento, J. S.; Silva, M. C.; et al. Sheep Milk: Physicochemical Characteristics and Relevance for Functional Food Development. Compr. Rev. Food Sci. Food Saf. 2017, 16(2), 247–262. DOI: https://doi.org/10.1111/1541-4337.12250.
- Jandal, J. M.;. Comparative Aspects of Goat and Sheep Milk. Small Ruminant Res. 1996, 22(2), 177–185. DOI: https://doi.org/10.1016/s0921-4488(96)00880-2.
- Pirisi, A.; Pirelda, G.; Podda, F.; Pintus, S. 1993. Effect of Somatic Cell Count on Sheep Milk Composition and Cheesemaking Properties. Somatic cells and milk of small ruminants. Proceedings. Bella, Italy, 25–27 September 1993. EAAP Publications, 77, 245–251.
- Palo, V.;. Charakteristika Ovčieho Mlieka (Characteristics of Ewe’s Milk). Bull. Food Res. 1998, 37(4), 211–218.
- Damjanović, S.; Samražija, D.; Havranek, J. Metode Za Dokazivanje Patvorenja Mlijeka I Sira Drugim Vrstama Mljeka (Methods for Proving Adulteration of Milk and Cheese with Other Types of Milk). Mljekarstvo. 2006, 56(3), 221–232.
- Goff, H. D.; The Dairy Science and Technology eBook. Dairy Chemistry and Physics. Composition and Structure: Overview. Canada: University of Guelph. https://www.uoguelph.ca/foodscience/book/export/html/1883
- SVFI BA. 2008. Annual Report of Sample Analysis in Central Testing Laboratories in Slovakia. State Veterinary and Food Institute Bratislava, National Reference Laboratory for Milk and Milk Products, 5.
- SVFI BA. 2009. Annual Report of Sample Analysis in Central Testing Laboratories in Slovakia. State Veterinary and Food Institute Bratislava, National Reference Laboratory for Milk and Milk Products, 5.
- SVFI BA. 2010. Annual Report of Sample Analysis in Central Testing Laboratories in Slovakia. State Veterinary and Food Institute Bratislava, National Reference Laboratory for Milk and Milk Products, 5.
- Chen, F.-T. A.; Zang, J.-H. Determination of Milk Proteins by Capillary Electrophoresis. J. AOAC Int. 1992, 75(5), 905–909. DOI: https://doi.org/10.1093/jaoac/75.5.905.
- Mayer, H. K.; Heidler, D.; Rockenbauer, C. Determination of the Percentages of Cows’, Ewes’ and Goats’ Milk in Cheese by Isoelectric Focusing and Cation-exchange HPLC of γ- and para-κ-caseins. Int. Dairy J. 1997, 7(10), 619–628. DOI: https://doi.org/10.1016/s0958-6946(97)00064-2.
- Špoljarić, J.; Mikulec, N.; Plavljanić, D.; Radeljević, B.; Havranek, J.; Antunac, N. Proving the Adulteration of Ewe and Goat Cheeses with Cow Milk Using the Reference Method of Isoelectric Focusing of γ-casein. Mljekarstvo. 2013, 63(3), 115–121.
- Sienkiewicz, T.; Dogan, M.; Kroh, L. W. Investigation of Proteins in Ewe, Goat and Cow Cheeses by Gel Isoelectric Focusing. Pol. J. Food Nutr. Sci. 2006, 56(15), 203–207.
- Borková, M.; Snášelová, J. Possibilities of Different Animal Milk Detection in Milk and Dairy Products – A Review. Czech J. Food Sci. 2005, 23(2), 41–50. DOI: https://doi.org/10.17221/3371-cjfs.
- Eigel, W. N.; Hofmann, C. J.; Chibber, B. A.; Tomich, J. M.; Keenan, T. W.; Mertz, E. T. Plasmin-mediated Proteolysis of Casein in Bovine Milk. Proc. National Academy Sci. 1979, 76(5), 2244–2248. DOI: https://doi.org/10.1073/pnas.76.5.2244.
- Addeo, F.; Moio, L.; Chianese, L.; Stingo, C.; Resmini, P.; Berner, I.; Krause, I.; Di Luccia, A.; Bocca, A. Use of Plasmin to Increase the Sensitivity of the Detection of Bovine Milk in Ovine Cheese by Gel Isoelectric Focusing of Y2-caseins. Milchwissenschaft. 1990, 45, 708–711.
- Restani, P.; Velona, T.; Carpen, A.; Duranti, M.; Galli, C. L. γ-Casein as a Marker of Ripening And/or Quality of Grana Padano Cheese. J. Agric. Food Chem. 1996, 44(8), 2026–2029. DOI: https://doi.org/10.1021/jf950633a.
- Zeleňáková, L.; Židek, R.; Čanigová, M.; Žiarovská, J.; Zajác, P.; Maršálková, L.; Fikselová, M.; Golian, J. Research and Practice: Quantification of Raw and Heat-treated Cow Milk in Sheep Milk, Cheese and Bryndza by ELISA Method. Potravinarstvo Slovak J. Food Sci. 2016, 10(1), 14–22. DOI: https://doi.org/10.5219/566.
- Fekete, T.; Šnirc, M.; Belej, Ľ.; Židek, R.; Golian, J.; Haščík, P.; Zeleňáková, L.; Zajác, P. Authentication of Caprine Milk and Cheese by Commercial qPCR Assay. Potravinarstvo Slovak J. Food Sci. 2017, 11:1(2017), 580–586. DOI: https://doi.org/10.5219/780.
- Šnirc, M.; Fekete, T.; Belej, Ľ.; Židek, R.; Golian, J.; Haščík, P.; Zajác, P.; Čapla, J. Detection of Ovine Milk Adulteration Using Taqman Real-time PCR Assay. Potravinarstvo Slovak J. Food Sci. 2017, 11(1), 338–343. DOI: https://doi.org/10.5219/782.
- Zhao, X.; Zheng, Z.; Zhang, J.; Sarwar, A.; Aziz, T.; Yang, Z. Change of Proteolysis and Sensory Profile during Ripening of Cheddar‐style Cheese as Influenced by a Microbial Rennet from Rice Wine. Food Sci. Nutr. 2019, 7(4), 1540–1550. DOI: https://doi.org/10.1002/fsn3.1003.
- Fox, P. F.;. Acceleration of Cheese Ripening. Food Biotechnol. 1988, 2(2), 133–185. DOI: https://doi.org/10.1080/08905438809549685.
- Juan, B.; Ferragut, V.; Buffa, M.; Guamis, B.; Trujillo, A. J. Effects of High Pressure on Proteolytic Enzymes in Cheese: Relationship with the Proteolysis of Ewe Milk Cheese. J. Dairy Sci. 2007, 90(5), 2113–2125. DOI: https://doi.org/10.3168/jds.2006-791.
- Revilla, I.; Rodríguez-Nogales, J. M.; Vivar-Quintana, A. M. Proteolysis and Texture of Hard Ewes’ Milk Cheese during Ripening as Affected by Somatic Cell Counts. J. Dairy Res. 2007, 74(2), 127–136. DOI: https://doi.org/10.1017/s0022029906002342.