
 ?Mathematical formulae have been encoded as MathML and are displayed in this HTML version using MathJax in order to improve their display. Uncheck the box to turn MathJax off. This feature requires Javascript. Click on a formula to zoom.
ABSTRACT
Trigonella foenum-graecum L. (fenugreek) leaves are nutritionally rich green leafy vegetables consumed in South-East Asian and Middle-Eastern countries. Scientific data suggests properties including anti-inflammatory, antipyretic, anti-nociception, and hepatoprotective. However, the molecules responsible for these properties are yet to be identified. In the present study, we have isolated and characterized an anti-inflammatory nutraceutical molecule based on bioassay from the fresh leaves of fenugreek. The lipoxygenase inhibition assay revealed 79.9 ± 1.1% and 69.0 ± 2.9% inhibition in ethanolic and aqueous extracts, respectively. The ethanolic extract purified on a semi-prep HPLC column yielded a nutraceutical molecule quercetin glycoside (QG) having potent inhibition of lipoxygenase (75.3 ± 1.6%) at 10 mM and hyaluronidase (67.4 ± 4.0%) at 2 mM, respectively. The QG structure was elucidated by spectroscopic data, including FTIR, UHPLC-MS/MS, and 1D and 2D NMR as Quercetin-3-O-diglucoside-7-O-glucoside. QG also suppressed ROS, NO, and IL-6 production in LPS stimulated RAW264.7 cells. Radical scavenging assays of DPPH and ABTS revealed the potent antioxidant activity of QG with an EC50 of 245.5 and 68.8 μM, respectively. Our results demonstrate that newly characterized quercetin glycoside from fresh leaves of fenugreek possesses potential anti-inflammatory and antioxidant activities.
INTRODUCTION
Inflammation is an essential physiological response of the body to foreign invasion and stress. However, its inefficient regulation may lead to the development of chronic inflammatory diseases. Inflammation provides a unifying pathophysiological mechanism underlying many chronic disorders, including diabetes, cardiovascular disease, certain cancers, bowel diseases, asthma, arthritis, and osteoporosis.[Citation1] Inflammation causes cell damage, releasing arachidonic acid from the cell membrane. Mammalian oxygenases like lipoxygenases (LOX) are one of the major enzymes involved in the arachidonic acid metabolism pathway. LOX metabolizes arachidonic acid to potent pro-inflammatory leukotrienes that produce the classic signs of inflammation – redness, edema, pain, and fever. These symptoms are commonly treated with non-steroidal anti-inflammatory drugs (NSAIDs) and steroids, often resulting in serious side effects, including gastrointestinal ulcers, liver and kidney damage.[Citation2] LOX also releases reactive oxygen species (ROS), which in excess cause cellular oxidative stress and are implicated in lipids, proteins, and DNA damage. ROS are known to play a central role in the onset and progression of inflammatory processes.[Citation3]
The production of LTB4, major leukotriene associated with rheumatoid arthritis, is reported to be blocked by LOX inhibitors. Hyaluronidase is another enzyme implicated in arthritis. Increased expression of hyaluronidase is involved in the pro-inflammatory response. This has prompted the search for natural inhibitors of LOX and hyaluronidase to act as therapeutic agents.[Citation4,Citation5] Soybean LOX-1 resembles human LOX in its substrate specificity and inhibition characteristics[Citation6] and hence was used for LOX inhibition studies in the current study.
Trigonella foenum-graecum L., commonly known as fenugreek in English, is an ancient medicinal herb dating from Egyptian times.[Citation7] South-East Asian and Middle-Eastern countries are the most consumers of fenugreek.[Citation8] It is used as an herb (dried or fresh leaves), spice (seeds), and green leafy vegetables (fresh leaves, sprouts, and microgreens). In South-East Asia and the Middle-Eastern countries, fresh fenugreek leaves are a part of the regular diet. They are added to curries and side dishes and relished for their slightly bitter taste and appealing aroma. There are reports regarding the anti-inflammatory, antipyretic, and anti-nociceptic activity of fenugreek leaves.[Citation9–11] However, not much scientific data are available concerning the identification of molecules responsible for these properties. Flavonoid glycosides have many beneficial properties, including anti-obesity, anti-inflammatory, anti-HIV activity, anti-allergy, antibacterial, and antitumor.[Citation12]
Thus, the present study aimed to isolate and characterize an anti-inflammatory nutraceutical molecule based on bioassay from fresh leaves of fenugreek, which can act as a natural anti-inflammatory agent. A combination of studies involving enzyme and ROS inhibition and antioxidant activity will indicate a potential anti-inflammatory activity.
MATERIALS AND METHODS
Chemicals and reagents
Soybean lipoxygenase (>50,000 IU/mg solid), hyaluronidase, linoleic acid, nordihydroguiaiaretic acid (NDGA), 2,2-diphenyl-1-picrylhydrazyl (DPPH), 2,2-azinobis-(3-ethylbenzothiazoline-6-sulfonate) (ABTS), bovine serum albumin, gallic acid, rutin, ascorbic acid, deuterated methanol (CD3OD), hyaluronic acid, sulfanilamide, lipopolysaccharides (E. coli O111:B4) and 2ʹ,7ʹ-dichlorofluorescein diacetate (DCFH-DA), were purchased from M/s Sigma–Aldrich, St. Louis, MO. MTT (3-(4, 5-dimethylthiazolyl-2)-2, 5-diphenyltetrazolium bromide), penicillin–streptomycin antibiotic solution, and N-(1-Napthyl)ethylenediamine dihydrochloride were purchased from HiMedia (Mumbai, India). Dulbecco’s modified Eagle’s medium (DMEM) and fetal bovine serum (FBS) were purchased from GIBCO, Life technologies (NY, USA). IL-6 ELISA kit (SEA079Mu) was obtained from Cloud-clone Corp (TX, USA). All solvents used were of HPLC grade, and other chemicals were of analytical grade.
Plant material and sample preparation
Fenugreek plants were purchased fresh from the local markets of Mysuru, Karnataka, India. The plant was identified, and a voucher specimen (Voucher number 1275) is kept at the herbarium of the Department of Studies in Botany, University of Mysore, India. The edible portions, that is, leaves with tender stalks, were separated, washed, and kept for drying (6–8 h) in a hot air oven (52 ± 2°C).[Citation13] The dried sample was powdered using a blender and stored in airtight containers at −20°C until further use. Ten grams of the fenugreek leaves powder was extracted in 100 mL distilled water and 70% ethanol individually for approximately eight hours. The residue obtained was re-extracted with a fresh solvent twice. Thus, the slurry was filtered through muslin cloth followed by Whatman No. 1 filter paper and the filtrates pooled and further concentrated under vacuum using a rotary evaporator (40 ± 2°C). The residue obtained was dissolved in 1% DMSO and kept at −20 ± 2°C until further use. Two extracts obtained were designated as aqueous (MDAQ) and 70% ethanolic (MDAL) extracts.
Total Phenolic Content (TPC) and Total Flavonoid Content (TFC)
The total phenolic contents of dried fenugreek leaf powder and the two extracts, MDAL and MDAQ, were determined by the Folin–Ciocalteu method.[Citation14] Briefly, dried fenugreek leaf powder (1 g) was extracted in 10 mL of acidified methanol. Various volumes of this solution were made up to 1.0 mL with deionized water, and 2 mL of 2% sodium carbonate and 1.0 mL of 50% Folin–Ciocalteu reagent were added. After incubation at room temperature for 1 h, the absorbance of the reaction mixture was measured at 765 nm against deionized water blank in a UV-Vis Spectrophotometer (Thermo Scientific Genesys 10S, Waltham, MA, USA). Appropriate dilutions of MDAL and MDAQ were used to estimate TPC by the same method as given above. Gallic acid was used as a standard, and the data were expressed as milligram Gallic Acid Equivalents (GAE)/g dried powder.
The total flavonoid content of fenugreek leaf powder was determined according to the aluminum chloride colorimetric method described by Pekal and Pyrzynska.[Citation15] Briefly, dried fenugreek leaf powder (1 g) was extracted in 10 mL of acidified methanol. Various volumes of it were made up to 1.0 mL with distilled water, and 0.3 mL of 5% sodium nitrite solution was added, followed by incubation of 5 min at room temperature. Later, 0.3 mL of 10% aluminum chloride was added, and the solution was made basic by adding 1 M sodium hydroxide. After incubation for 5 min at room temperature, the volume was made up to 10 mL by distilled water, and the reaction mixture absorbance was measured at 510 nm against a deionized water blank in a UV-Vis Spectrophotometer. Rutin was used as a standard. The data were expressed as milligram Rutin Equivalents (RE)/g dry weight.
Lipoxygenase (LOX) inhibition assay
LOX inhibition assay was used as a screening tool for checking the anti-inflammatory activity in the fenugreek leaves extract. LOX activity was assayed, according to Axelrod et al.[Citation16] An increase in absorbance at 234 nm due to the formation of hydroperoxide (ε = 25,000 M−1 cm−1) was monitored. For its inhibition studies, the enzyme was incubated with 1 mg/mL of MDAQ, MDAL, or with quercetin glycoside (QG) (0.1–10 mM) for 3 min in 0.2 M borate buffer (pH 9.0), and the addition of linoleic acid started the reaction. The reaction was followed for 7 min or till equilibrium, whichever is earlier at 25°C. Quercetin (1 mg/mL) and nordihydroguiaiaretic acid (NDGA- 0.0018 mg/mL) were the standards used.
Assay-guided fractionation of fenugreek leaves extract by HPLC
Liquid chromatographic separation of fenugreek leaves extracts (MDAL and MDAQ) was performed using the analytical HPLC system of Waters e2695 with a 250 × 4.6 mm i.d., 5 μm, RP C18 GraceSmart column at a flow rate of 1.0 mL/min. The column oven temperature was set at 25°C. The mobile phase consisted of a combination of A (0.2% formic acid in water) and B (acetonitrile). The flow of mobile phase was isocratic at 10% B (v/v) from 0 min to 10 min, and then the gradient increased linearly to 15% B at 20 min, to 22% B at 30 min, to 23% B at 38 min, to 26% B at 45 min, to 40% B at 50 min and then decreased to 10% B at 52 min and held at 10% B till 55 min. The PDA was set at 360, 320, and 280 nm for real-time display of the peak intensities. This time program was suitably modified for Waters 2545 preparative HPLC performed using Waters semi-preparative Spherisorb column of 250 mm × 10 mm i.d., 10 μm ODS, and a flow rate of 10 mL/min. The flow of the mobile phase was isocratic at 10% B (v/v) from 0 min to 3 min, and then it increased linearly to 15% B at 8 min, to 22% B at 16 min, to 23% B at 24 min, to 26% B at 28 min and then decreased to 10% B at 30 min till 33 min. Individually separated fractions were collected using the real-time display of peak intensities.
Several fractions were collected and checked for anti-inflammatory activity by LOX inhibition assay. The fraction at RT 4.233 min, which gave the highest LOX inhibition, was further purified on semi-prep HPLC. The LOX inhibition was carried out before identification by spectral studies.
Identification of molecule by Spectroscopy
Fourier-Transform Infrared (FTIR) Spectroscopy
An FTIR spectrum of QG was recorded with a Bruker Tensor II FTIR Spectrometer in the spectral range of 4000–400 cm−1.
Mass Spectrometry (MS)
Mass spectra of the QG was recorded on the Ekspert ultra LC 110-XL system, coupled to a Sciex Triple TOF MS/MS Mass spectrometer (High-Resolution Mass Spectrometry-HRMS) in negative ion mode with an m/z 100–2000 scan range, using an UPLC column RP C18 30 × 2.1 mm, 1.7 µM. The column temperature was kept at 30°C, and the flow rate was 200 µL/min.
Nuclear Magnetic Resonance (NMR)
The NMR spectra for QG was carried out at 500 (1H NMR) and 125 (13C NMR) MHz on a Bruker Avance 500 MHz spectrometer, by dissolving the compound in deuterated methanol (CD3OD) solvent. Proton test and 2D NMR experiments (HSQC, HMBC, COSY, and NOESY) were also carried out.
Hyaluronidase inhibition assay
Hyaluronidase inhibitory assay was performed by using the methodology described by Hynes & Ferretti[Citation17] and Nema et al.[Citation18] Hyaluronidase reacts with the substrate hyaluronic acid to release N-acetyl glucosamine. In the presence of any inhibitor, the release of N-acetyl glucosamine is reduced, and it is monitored by measuring the absorbance at 600 nm. The reaction mixture contains 5 μL of QG (31.25– 2000 μM) in 1% DMSO, pre-incubated with hyaluronidase (0.6 U/mL) made in 20 mM sodium phosphate buffer with 77 mM sodium chloride, and 0.01% bovine serum albumin (BSA), pH 7.0 for 10 min at 37°C. The control tube consisted of 1% DMSO incubated with the enzyme. Subsequently, 100 μL of hyaluronic acid (0.03% in 300 mM sodium phosphate, pH 5.35) was added to the incubation mixture and further incubated for 45 min at 37°C. Undigested hyaluronic acid was precipitated with acid albumin solution made up of 0.1% BSA in 24 mM sodium acetate and 79 mM acetic acid, pH 3.75. It was kept at room temperature for 10 min, and then absorbance was measured at 600 nm. An absorbance value of intact undigested hyaluronic acid was considered as an enzyme blank. For calculation of the percentage of enzyme activity, the following formula was used:
Antioxidant assays
DPPH• (2, 2-diphenyl-1-picrylhydrazyl) radical scavenging assay
In this assay, the purple chromogen radical DPPH (2, 2-diphenyl-1-picrylhydrazyl) is reduced by antioxidant/reducing compounds to a corresponding pale yellow hydrazine. The procedure described by Herald et al.[Citation19] was used with some modifications. A DPPH· solution of 60 μM in methanol was made, and 200 μL of this solution was added to all the wells except the blank wells in a microtitre plate. Sample, control, and standard solutions (50 μL) were added to the respective wells and kept in the dark at room temperature for 20 min. A decrease in absorbance at 517 nm of DPPH was taken at the end of the incubation period. Ascorbic acid (35.5–568 μM) was the standard and MDAL, and MDAQ (1 mg/mL) and QG (18.75–300 µM) were the samples tested. The activity was calculated as effective concentration EC50 of the sample by the following formula:
ABTS⁺ (2, 2-azinobis-(3-ethylbenzothiazoline-6-sulfonate)) radical cation or Trolox equivalent antioxidant capacity (TEAC) assay
The assay is based on the interaction between an antioxidant and ABTS radical cation (ABTS⁺) with absorption maxima at 734 nm. The ABTS⁺ is generated by reacting a 7.4 mM ABTS stock solution with a 2.6 mM potassium persulfate stock solution in a 1:1 proportion for 12–16 h in the dark. This solution is then diluted by mixing 1 mL ABTS⁺ solution with 60 mL methanol. The assay described by Thaipong et al.[Citation20] with modifications for microplate was utilized. The ABTS⁺ solution (200 μL) was added to all the wells except the blank wells, which contained only vehicle solvent and methanol. Sample, control, and standard (50 μL), in quintuplets, were added to the respective wells, and a decrease in absorbance was noted at exactly 10 min at 734 nm. Many natural antioxidants do not attain equilibrium in 10 min of reaction time. Hence, the final reading was taken after 2 h of incubation in the dark. The conversion of the blue-green ABTS⁺ radical form to its neutral colorless form conveys the antioxidant property of the sample. Trolox (25–200 μM) was used as standard. MDAL and MDAQ (1 mg/mL) and QG (18.75–300 µM) were tested for ABTS radical scavenging property. The effective concentration was calculated according to the formula given above. The Trolox equivalent antioxidant capacity (TEAC) was calculated according to the equation given by Re et al.[Citation21]
Where m(sample) and m(Trolox) is the slope of the plot of percentage radical scavenging property vs. concentration of the sample and Trolox, respectively.
Cell culture
RAW264.7 cell line was procured from National Center for Cell Science, Pune, India. The cells were maintained in Dulbecco’s modified Eagle’s medium, high glucose, supplemented with 1 mM sodium pyruvate, 10% fetal bovine serum (FBS), and 100 U/mL of penicillin, and 100 μg/mL streptomycin in a humidified 5% CO2 incubator at 37°C.
Cell viability assay
The effect of QG on the viability of the RAW264.7 cell line was performed by using tetrazolium salts like MTT (3-(4, 5-dimethylthiazolyl-2)-2, 5-diphenyltetrazolium bromide). The yellow MTT is reduced by metabolically active cells to form intracellular purple formazan crystals, which can be solubilized and quantified by spectrophotometric means. RAW264.7 cells were seeded at a density of 1 × 10⁴ cells/well in a 96-well plate and incubated at 37°C in a 5% CO2 incubator for 24 h. Afterward, they were treated with 1–1000 µg/mL of QG for 24 h. Cells treated with vehicle served as controls. Subsequent steps followed were similar to the procedure described by Perera et al.[Citation22] In brief, following incubation, spent media was removed, and the attached cells were washed with phosphate-buffered saline (PBS). To each well, 20 μL of MTT solution (5 mg/mL in PBS) and 180 μL of FBS-free media were added. After incubation in a CO2 incubator for 4 h, the spent media was carefully removed, and the formazan crystals formed within the cells were dissolved in 100 μL of cell-culture grade DMSO. Absorbance was taken at 570 nm with the reference wavelength at 660 nm in a multimode microplate reader (TECAN, Mannedorf, Switzerland). Results are expressed as percent viability taking the control cells as 100% viable.
Intracellular reactive oxygen species (ROS) estimation
Reactive oxygen species (ROS) production in lipopolysaccharide (LPS) stimulated RAW264.7 cells can be checked by using the non-fluorescent DCFH-DA (2ʹ, 7ʹ-dichlorofluorescein diacetate). In the presence of ROS, the DCFH is oxidized to highly fluorescent dichlorofluorescein (DCF), which can be quantified by fluorimeter. Thus, the ROS production in LPS stimulated cells and its inhibition by QG was checked by seeding 6 × 10⁴ cells/well in a 96-well black-walled plate for 16 h. The cells were pre-treated with QG (100 and 50 µM) along with quercetin (10 µM) as standard for 30 min, followed by stimulation with LPS (1.0 µg/mL) for 6 h. After incubation, the cells were incubated with 50 µM of DCFH-DA at 37°C for 30 min in the dark. After gentle washing of the cells with Hank’s balanced salt solution (HBSS), the fluorescence difference was checked at 485 nm excitation and 535 nm emission spectra in a multimode plate reader.[Citation23]
Nitric oxide and IL-6 estimation
Nitric oxide (NO) is another reactive oxygen species produced by LPS stimulated RAW264.7 cells whose inhibition gives clues about the anti-inflammatory property. The nitric oxide (NO) and IL-6 estimation were performed by seeding 2.5 × 10⁵ cells/well in a 24 well plate and incubating for 24 h. The cells were pre-treated with QG (100 and 50 µM) along with quercetin (10 µM) as standard for 30 min, followed by stimulation with LPS (1.0 µg/mL) for 18 h. Cells treated with vehicle and with 1.0 µg/mL LPS served as a negative and positive control, respectively. Cell supernatants were collected from each group for NO and IL-6 estimation.
NO was estimated by mixing cell supernatant (100 µL) with Griess reagent A (0.1% N-(1-Napthyl)ethylenediamine dihydrochloride in deionized water) and B (1% sulfanilamide in 5% concentrated orthophosphoric acid) in 1:1:1 proportion. The plates were incubated at room temperature for 10 min in the dark, and absorbance at 540 nm was measured in a microplate reader (BMG labtech, Ortenberg, Germany). The concentration of NO was calculated from a standard graph of sodium nitrite (1.56 −200 µM).[Citation23] IL-6 in the cell supernatants was estimated using IL-6 ELISA kit (Cloud-clone Corp, SEA079Mu) according to the manufacturer’s instructions. The absorbance was taken at 450 nm in a microplate reader.
Statistical analysis
All the experiments were conducted in triplicates, and the data were reported as mean ± standard deviation. All the statistical analyses were performed by regression analysis, one-way analysis of variance (ANOVA), followed by Tukey’s post hoc test. Results were considered significant when P < .05. * represents P < .05, ** – P <.01, *** – P < .001.
RESULTS AND DISCUSSION
Trigonella foenum-graecum L. leaves purchased fresh from the local markets were cleaned, washed, dried, and powdered. This powder was used for extraction and further experimentation.
Biomass yield, total phenolic, and flavonoid contents
The biomass yield and total phenolic and flavonoid contents of the washed and trimmed fresh fenugreek leaves were noted. The moisture content of the fresh fenugreek leaves was found to be 87.6 ± 0.5% on a wet basis, with the biomass yield of 12.0 ± 0.9% as a dried powder. The total phenolic content of the dried fenugreek leaf powder was found to be 7.3 ± 0.3 mg/g Gallic acid equivalents (GAE), while the total flavonoid content was 4.7 ± 0.8 mg/g Rutin equivalent (RE) d.w., respectively. Varied values of the phenolic content of fenugreek leaves have been reported ranging from 2.3 to 54.8 mg/g d.w.[Citation24–26] Flavonoid contents also show similar variations in literature. Aqueous (MDAQ) and 70% ethanolic (MDAL) extracts yielded 32.3 ± 2.3 and 36.8 ± 4.06 g of residue per 100 g d.w. The phenolic contents in MDAQ and MDAL were found to be 4.1 ± 0.4 and 9.3 ± 1.1 mg/g GAE d.w., respectively (). MDAL showed 2.26 times more phenolic content than MDAQ. There are considerable differences in the total phenolic and flavonoid contents being reported across the literature. This occurs due to many variables present in the studies – the solvent used for extraction, extraction method, extraction time, standards used for estimation, estimation methods, and environmental conditions affecting the samples.[Citation25]
Table 1. Inhibition of DPPH and ABTS by MDAL and MDAQ (1 mg/mL) and their corresponding phenolic contents
Lipoxygenase (LOX) inhibition assay
LOX enzyme inhibition was used as a guide for anti-inflammatory activity in fenugreek leaves. The inhibition of LOX was more in MDAL than in MDAQ. MDAL (1 mg/mL) inhibited 79.9 ± 1.1% of LOX whereas; MDAQ (1 mg/mL) showed 69.0 ± 2.9% inhibition. Comparatively, quercetin (1 mg/mL) and NDGA (0.0018 mg/mL) exhibited 97.2 ± 1.7% and 52.4 ± 4% of LOX inhibition, respectively ().
Figure 1. LOX-1 enzyme inhibition by MDAL and MDAQ (1 mg/mL) in comparison with quercetin (1 mg/mL) and nordihydroguiaiaretic acid (NDGA – 0.0018 mg/mL). Data were obtained as mean values of 3 independent tests and presented as ± SD
Chromatographic separation of fractions
Chromatographic separation by HPLC results in fractionation and visualization of a complex mixture of compounds present in crude extracts, and that was attempted. The LOX inhibition activity was better in the MDAL than in MDAQ, and hence, MDAL was chosen for visualization of peaks by analytical HPLC. Upon fractionation on a preparative scale (Figure S1), the fraction at RT 4.233 (quercetin glycoside – QG) showed relatively higher inhibition (47.9 ± 0.7%) of LOX activity at 1 mg/mL compared to the other fractions collected from preparative HPLC. Upon further purification, the fraction yielded a single peak (). The purified QG (yield of 3.43 mg/g d.w.) was further characterized by various spectroscopic studies, including FTIR, LC-MS/MS, and NMR.
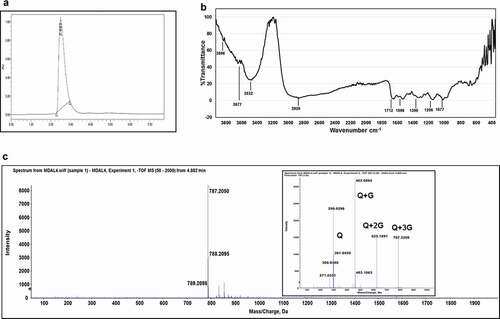
Figure 2. HPLC, FTIR, and LC-MS/MS profile of Quercetin Glycoside-QG. HPLC profile of QG on C-18 column (preparative), detection wavelength at 360 nm (a). Fourier transform infrared spectra of QG was obtained in the spectral range of 4000–400 cm−1 (b). LC-MS analysis using High-Resolution Mass Spectrometry (HRMS) of QG in the negative ion mode in the range of 100–2000 m/z. Inset represents the MS/MS pattern of QG (c)
Identification of QG by spectroscopic methods
FTIR spectroscopy
Spectral characterization was carried out using FTIR to elucidate the structure of QG. The FTIR spectra of QG () revealed several peaks, notably a broad, single, sharp peak at 3532 cm−1: OH groups in bonded form; peaks beyond 3600 cm−1: free OH groups; single, broad peak around 3000 cm−1 and multiple peaks in between 1650 and 1500 cm−1: benzene ring backbone; a unique, sharp peak at 1712 cm−1: ketone group in benzene structure; more than one peak in between 1100 and 1010 cm−1: C-O stretching of pyranosides.[Citation27,Citation28]
Mass spectroscopy
The QG yielded a single peak in mass spectrometry with m/z of 787.20 [M – H]ˉ in ESI negative ion mode (). The MS/MS fragmentation pattern of QG resulted in ions with m/z of 625, 462, and 301, corresponding to loss of 3 glycosyl moieties and the quercetin aglycone radical ( insert).
Structural characterization by NMR
The NMR spectral data of QG is presented in Table S1. The results from the 1D (1H and 13C, SEFT) (Figure S2a and S2b) and 2D NMR (HSQC, COSY, HMBC, and NOESY) (Figure S5a and S5b) experiments revealed the characteristic peaks of quercetin with glycoside attachments. The proton NMR spectrum presented five aromatic signals between 6.5 and 7.8 ppm range indicating the A and B rings of quercetin. The three doublet signals at 5.19, 5.10, and 4.80 ppm were inferred to be from anomeric protons of three glucose moieties. The signals in the range of 3.35 ppm to 4.15 ppm correspond to the three pyranoside units (Figure S3a). The 13C NMR spectrum and attached proton test spectrum indicated signals from the aglycone portion in the range of 105 ppm to 180 ppm. Also, the 13C spectrum presented three signals between 100 and 105 ppm, which were inferred as anomeric carbons (Figure S3b). Further, three signals appearing in the negative phase at 60.95, 60.82, and 60.35 ppm in the attached proton test experiment corroborated the presence of three hydroxyl methyl groups (Figure S4).
The 2D NMR experiments provided clarity on the site of glycoside linkages. There were two glycoside attachments to the aromatic nucleus. Among these, one was a monosaccharide at position 7, and the other was a disaccharide at the 3rd position (Figure S5a). The NOE correlation between anomeric protons at 5.1 ppm (1”‘) and aromatic protons at positions 6 and 8 of ring A confirmed the attachment of glucose moiety at position 7 (Figure S6). The heteronuclear multiple-bond correlations between anomeric proton (1ʹ to C3 and 1”‘ to C7) with aromatic quaternary carbon atoms 3 and 7 additionally supported the conclusion. The HMBC correlations between anomeric proton at 1” and C-4ʹ confirmed 1–4 linkage in the diglucoside at position 3 of quercetin (Figure S5a). All the proton and carbon correlations were established by 2D HSQC (Figure S5b, S7a, and 7b) and HMBC experiments to derive the molecular structure ( and Figure S8). The molecule identified by the above spectroscopic studies was Quercetin-3-O-diglucoside-7-O-glucoside. This is the first time that Quercetin-3-O-diglucoside-7-O-glucoside, isolated based on bioassay, has been reported in fresh fenugreek leaves to the best of our knowledge.
Figure 3. Structure of Quercetin-3-O-diglucoside-7-O-glucoside (QG) based on different spectroscopy data
Anti-inflammatory activity of QG
Lipoxygenase inhibition assay of QG
LOX catalyze fatty acids to produce leukotrienes, mediating inflammation. Thus, inhibiting LOX activity will mitigate the harmful effects of chronic inflammation. QG was tested at various concentrations from 0.1 to 10 mM and exhibited 75.3 ± 1.6% LOX inhibition at 10 mM. The IC50 of QG for LOX-1 was found to be 1.27 mM (, R2 = 0.99, P < .05). Quercetin is a functional substrate of LOX and causes a prolongation of the kinetic lag phase and an instant decrease in the initial rate of the reaction.[Citation29] The time course of LOX inhibition revealed a decrease in the reaction rate, leading to an increase in the lag phase, effectively observed at 2 mM and 10 mM concentration of QG (). Sadik et al.[Citation29] and Ha et al.[Citation30] reported similar time-dependent soybean LOX inhibition by quercetin. Rutin and isoquercitrin, which are glycosides of quercetin, presented no LOX inhibitory activity up to 200 μM.[Citation30] However, with this study, we were able to report inhibitory activity from 0.1 to 10 mM by QG (). Molecular modeling simulations on soybean lipoxygenase inhibition due to quercetin reveals that it possibly inhibits by the formation of semiquinone at the 3ʹ-OH, 7ʹ-OH and/or 4ʹ-OH positions. In the case of QG, since the third- and seventh- positions are occupied by glycosides, it leaves only the 4ʹ-OH group to interact with the binding site. This could be the reason for the higher IC50 of QG as compared to quercetin.[Citation30,Citation31]
Figure 4. Inhibition of LOX-1 by QG at different concentrations (0.1–10 mM) (a). Time course of LOX-1 inhibition by different concentrations of QG. The concentrations of QG used were 0 mM (―♦―), 0.4 mM (―□―), 0.8 mM (―▲―), 1 mM (―x―) and 2 mM (―●―) (b). Inhibition of hyaluronidase by QG at different concentrations ranging from 31.25–2000 μM (c). Data were obtained as mean values of 3 independent tests
Hyaluronidase inhibition assay of QG
QG presented potential inhibition of hyaluronidase with an IC50 of 619.64 μM (, R2 = 0.99, P < .05). Similar inhibition of hyaluronidase by quercetin and rutin was reported by Lee & Kim.[Citation32] Perera et al.[Citation22] also reported green leafy vegetables like curry leaves and brahmi exhibiting hyaluronidase inhibition of 40 and 52%, respectively. Thus, inhibition of hyaluronidase by flavonoid glycosides promises modulation of inflammation observed in certain inflammatory diseases like osteoarthritis and rheumatoid arthritis.[Citation33,Citation34]
Antioxidant activity
The free radical scavenging ability of fenugreek leaves was checked using the DPPH and ABTS radical assays. The alcoholic (MDAL) extract of fenugreek leaves showed remarkable DPPH radical scavenging activity, as shown in . The DPPH scavenging activity of MDAL correlated significantly with its phenolic content. QG had an EC50 value of 245.5 μM for DPPH () against standard ascorbic acid with EC50 of 679.0 μM. Similar results were documented by Wang et al.[Citation35] for quercetin glycosides. They found the EC50 ranging from 143.9 to 525.5 μg/mL for various quercetin glycosides by the DPPH radical scavenging assay.
Figure 5. Inhibition of DPPH* by QG (―■―) at various concentrations (18.75–300 μM) in comparison with ascorbic acid (―▲―) at different concentrations (35.5–568 μM) (a). Inhibition of ABTS⁺ by QG (18.75–300 μM) in comparison with a standard molecule Trolox® (25–200 μM). Inhibition percentage of ABTS⁺ by QG at 10 min (―■―) and 2 h (―●―) incubation and Trolox at 10 min (―♦―) and 2 h (―▲―) incubation are shown (b). Data were obtained as mean values of 3 independent tests
The ABTS method permits the measurement of antioxidant activity of mixtures of substances, which helps to differentiate between additive and synergistic effects. The addition of MDAL extract to the ABTS solution caused a rapid discolouration of the solution. Relatively, MDAQ exhibited a slower response. However, the maximal inhibition of ABTS by the two extracts after 10 min of incubation indicates a probable synergistic effect of the compounds extracted (). Since ABTS measures the total antioxidant activity of a sample by hydrogen-atom transfer mechanism, it can be concluded that both MDAL and MDAQ contain potent antioxidant compounds.
QG had an EC50 of 161.8 μM at 10 min incubation for the ABTS radical assay. However, to check whether the reaction has reached its end product, it was incubated for a total of 2 h in the dark.[Citation20] The extended incubation time resulted in the redox reactions attaining equilibrium and the correct evaluation of EC50. Thus, the EC50 at 2 h was 68.84 μM () against standard trolox with an EC50 of 128.7 μM. This drastic reduction in the effective concentration was also reflected in the TEAC values, which increased from 0.690 to 1.836, at 10 min and 2 h, respectively. The decrease in the EC50 reflects the complex kinetics in the redox reactions and a possible contribution of the oxidation by-products toward the total antioxidant capacity. A shorter testing time (6–10 min) may significantly underestimate the TEAC value of the sample. Thus, to accurately estimate the TEAC of a sample, it was evaluated after it had reached a steady state.
Anti-inflammatory assays in RAW 264.7 cell line
Preliminary anti-inflammatory assays carried out in the RAW264.7 macrophage cell line exhibited promising results. Initially, the cytotoxic effect of QG (1–1000 µg/mL) was tested on the macrophage cell line for 24 h of incubation using MTT assay. All the concentrations tested had similar cell viability (). Macrophage cells like RAW264.7 cells produce a high amount of ROS upon stimulation. The high ROS levels produced upon LPS activation were ameliorated dose-dependently by QG (). QG (100 and 50 µM) and quercetin (10 µM) pre-treated cells decreased LPS-induced ROS production by 50.1% (P < .001), 25.2% (P < .01), and 68.1% (P < .001), respectively. QG at 100 µM inhibited ROS production at par with standard quercetin. Quercetin is a well-known antioxidant, and the isolated QG from fenugreek leaves also demonstrated this activity in the in vitro ROS assay.
Figure 6. Inhibition of LPS induced inflammatory response by QG in RAW 264.7 cells. The effect of QG on cells’ viability at various concentrations (1–1000 µg/mL) was confirmed by MTT assay (a). Cells were pre-incubated with 50, and 100 µM of quercetin glycoside (QG50 and QG100) for 30 min, followed by stimulation with LPS, and the levels of ROS (b), NO (c), and IL-6 (d) were measured. Quercetin at 10 µM (Q10) was used as a positive control. *P < .05, **P < .01, ***P < .001 vs. LPS
Nitric oxide (NO) is one of the ROS and an early pro-inflammatory molecule produced by stimulated macrophages. Vehicle control cells produced negligible amounts of NO. However, on stimulation with 1 µg/mL of LPS, there was a marked increase in NO production. Subsequently, the treatment with QG dose-dependently decreased NO production. QG at 100 and 50 µM effectively suppressed LPS induced NO production by 80.2 and 42.9% compared to quercetin (73.1%) (). Inflammation is reported to be responsible for the excessive production of ROS and NO.[Citation3] The present data suggest that the induced oxidative stress by LPS stimulation was significantly protected by QG, indicating an anti-inflammatory response of QG.
ROS and NO act as early messengers and trigger the release of pro-inflammatory cytokines, including IL-6. It is another early pro-inflammatory molecule whose inhibition was observed by QG at 100 µM significantly (). Although generally, it has been observed that glycosylated flavonoids like QG are less inhibitory than their aglycones, few researchers have reported their anti-inflammatory activities in cell lines and animal studies. NO and cytokine inhibition by quercetin-3-O-diglucoside, and quercetin-3-O-glycoside in RAW264.7 cell line were reported by Jung et al.[Citation36] and Vien et al.[Citation37] Woo et al.[Citation38] found that quercetin-3-O- and −7-O-glucosides, isolated from Allium victorialis leaves, effectively inhibited NO production in LPS-induced BV-2 cells.
Taken together, our data indicate that QG isolated from fenugreek leaves might suppress the LPS-induced inflammation in RAW264.7 macrophages by suppressing oxidative stress and inhibiting the early signaling pathways of inflammation. Our data indicate that QG from fenugreek leaves is a potential anti-inflammatory nutraceutical molecule. Additionally, quercetin glycosides have higher plasma levels and residence time than quercetin, quercetin rhamnosides, or rutinosides. The addition of more glycosides to quercetin-3-O-glucoside enhances its bioavailability. Thus, the glycosides of quercetin are more bioavailable than the aglycone.[Citation12]
CONCLUSION
In the current study, a potent anti-inflammatory molecule, Quercetin-3-O-diglucoside-7-O-glucoside, from the fresh leaves of fenugreek was identified. It is a natural quercetin glycoside that shows anti-inflammatory properties, including lipoxygenase and hyaluronidase inhibition, along with suppressing ROS, NO, and IL-6 production efficiently in LPS stimulated RAW264.7 cells. In addition, it showed strong antioxidant activity. Fenugreek leaves are already known to contain high amounts of ascorbic acid, β-carotene, calcium, magnesium, iron, and other phytonutrients. The presence of quercetin glycoside in fenugreek leaves adds to its nutraceutical value.
Supplemental Material
Download MS Word (1.1 MB)Acknowledgments
The authors are grateful to Director, CSIR-CFTRI, Mysuru, for providing the necessary facility to carry out the research. Ms. Kavya S. Bhatt is thankful to the Council for Scientific and Industrial Research, India, for the award of the fellowship. The authors declare no conflict of interest.
Supplementary material
Supplemental data for this article can be accessed on the publisher’s website.
Related Research Data
References
- Ferrucci, L.; Fabbri, E. Inflammageing: Chronic Inflammation in Ageing, Cardiovascular Disease, and Frailty. Nat. Rev. Cardiol. 2018, 15(9), 505–522. DOI:https://doi.org/10.1038/s41569-018-0064-2
- Sinha, M.; Gautam, L.; Shukla, P. K.; Kaur, P.; Sharma, S.; Singh, T. P. Current Perspectives in NSAID-Induced Gastropathy. Mediators Inflammation. 2013, 2013, 258209. DOI:https://doi.org/10.1155/2013/258209
- Mittal, M.; Siddiqui, M. R.; Tran, K.; Reddy, S. P.; Malik, A. B. Reactive Oxygen Species in Inflammation and Tissue Injury. Antioxidants & Redox Signaling. 2014, 20(7), 1126–1167. DOI: https://doi.org/10.1089/ars.2012.5149.
- Kuhn, H.; Banthiya, S.; van Leyen, K. Mammalian Lipoxygenases and Their Biological Relevance. Biochim. Biophys. Acta, Mol. Cell Biol. Lipids. 2015, 1851(4), 308–330. DOI:https://doi.org/10.1016/j.bbalip.2014.10.002
- Hughes, S. D.; Ketheesan, N.; Haleagrahara, N. The Therapeutic Potential of Plant Flavonoids on Rheumatoid Arthritis. Crit. Rev. Food Sci. Nutr. 2017, 57(17), 3601–3613. DOI: https://doi.org/10.1080/10408398.2016.1246413.
- Prigge, S. T.; Boyington, J. C.; Gaffney, B. J.; Amzel, L. M. Structure Conservation in Lipoxygenases: Structural Analysis of Soybean Lipoxygenase-1 and Modeling of Human Lipoxygenases. Proteins: Structure, Function, and Genetics. 1996, 24(3), 275–291. DOI: https://doi.org/10.1002/(SICI)1097-0134(199603)24:3<275::AID-PROT1>3.0.CO;2-G.
- Petropoulos, G. Introduction. In Fenugreek: The Genus Trigonella; Petropoulos, G. Ed.; Taylor and Francis Inc.: London, U.K., 2002; pp 1-8.
- Kakani, R. K.; Anwer, M. M. Fenugreek. In Handbook of Herbs and Spices, 1st ed.; Peter, K. V., Ed.; Woodhead Publishing Ltd: Cambridge, UK, 2012; Vol. 1, pp 286–288.
- Ahmadiani, A.; Javan, M.; Semnanian, S.; Barat, E.; Kamalinejad, M. Anti-inflammatory and Antipyretic Effects of Trigonella Foenum-graecum Leaves Extract in the Rat. J. EthnopharmacolJournal of Ethnopharmacology. 2001, 75(2–3), 283–286. DOI: https://doi.org/10.1016/S0378-8741(01)00187-8.
- Parvizpur, A.; Ahmadiani, A.; Kamalinejad, M. Spinal Serotonergic System Is Partially Involved in antinociception Induced by Trigonella Foenum-graecum (TFG) Leaf Extract. Journal of Ethnopharmacology. 2004, 95(1), 13–17. DOI: https://doi.org/10.1016/j.jep.2004.05.020.
- Parvizpur, A.; Ahmadiani, A.; Kamalinejad, M. Probable Role of Spinal Purinoceptors in the Analgesic Effect of Trigonella Foenum (TFG) Leaves Extract. Journal of Ethnopharmacology. 2006, 104(1–2), 108–112. DOI: https://doi.org/10.1016/j.jep.2005.08.057.
- Xiao, J. B. Dietary Flavonoid Aglycones and Their Glycosides: Which Show Better Biological Significance?. Crit. Rev. Food Sci. Nutr. 2017, 57(9), 1874–1905. DOI: https://doi.org/10.1080/10408398.2015.1032400
- Valadez-Carmona, L.; Plazola-Jacinto, C. P.; Hernandez-Ortega, M.; Hernandez-Navarro, M. D.; Villarreal, F.; Necoechea-Mondragon, H.; Ortiz-Moreno, A.; Ceballos-Reyes, G. Effects of Microwaves, Hot Air and Freeze-drying on the Phenolic Compounds, Antioxidant Capacity, Enzyme Activity and Microstructure of Cacao Pod Husks (Theobroma Cacao L.). Innovative Food Sci. Emerging Technol. 2017, 41, 378–386. DOI: https://doi.org/10.1016/j.ifset.2017.04.012.
- Puttaraju, N. G.; Venkateshaiah, S. U.; Dharmesh, S. M.; Urs, S. M. N.; Somasundaram, R. Antioxidant Activity of Indigenous Edible Mushrooms. J. Agric. Food Chem. 2006, 54(26), 9764–9772. DOI: https://doi.org/10.1021/jf0615707.
- Pekal, A.; Pyrzynska, K. Evaluation of Aluminium Complexation Reaction for Flavonoid Content Assay. Food Analytical Methods. 2014, 7(9), 1776–1782. DOI: https://doi.org/10.1007/s12161-014-9814-x.
- Axelrod, B.; Cheesbrough, T.; Laakso, S. Lipoxygenase from Soybeans: EC 1. 13.11.12Linoleate: Oxygen Oxidoreductase. In Methods in Enzymology; Lowenstein J. M. Ed.; Academic Press: Massachusetts, USA, 1981; Vol. 71, pp 441–451.
- Hynes, W.; Ferretti, J. Assays for Hyaluronidase Activity. In Methods in Enzymology; Clark V. L. and Bavoil P. M. Eds.; Academic Press: Massachusetts, USA, 1994; Vol. 235, pp 606–616.
- Nema, N. K.; Maity, N.; Sarkar, B. K.; Mukherjee, P. K. Matrix Metalloproteinase, Hyaluronidase and Elastase Inhibitory Potential of Standardized Extract of Centella Asiatica. Pharmaceutical Biology. 2013, 51(9), 1182–1187. DOI: https://doi.org/10.3109/13880209.2013.782505.
- Herald, T. J.; Gadgil, P.; Tilley, A. High-throughput Micro Plate Assays for Screening Flavonoid Content and DPPH-scavenging Activity in Sorghum Bran and Flour. J. Sci. Food Agric. 2012, 92(11), 2326–2331. DOI: https://doi.org/10.1002/jsfa.5633.
- Thaipong, K.; Boonprakob, U.; Crosby, K.; Cisneros-Zevallos, L.; Byrne, D. H. Comparison of ABTS, DPPH, FRAP, and ORAC Assays for Estimating Antioxidant Activity from Guava Fruit Extracts. J. Food Compos. Anal. 2006, 19(6–7), 669–675. DOI: https://doi.org/10.1016/j.jfca.2006.01.003.
- Re, R.; Pellegrini, N.; Proteggente, A.; Pannala, A.; Yang, M.; Rice-Evans, C. Antioxidant Activity Applying an Improved ABTS Radical Cation Decolorization Assay. Free Radical Biol. Med. 1999, 26(9–10), 1231–1237. DOI: https://doi.org/10.1016/S0891-5849(98)00315-3.
- Perera, H.; Samarasekera, J.; Handunnetti, S. M.; Weerasena, O. In Vitro Anti-inflammatory and Anti-oxidant Activities of Sri Lankan Medicinal Plants. Ind. Crops Prod. 2016, 94, 610–620. DOI: https://doi.org/10.1016/j.indcrop.2016.09.009.
- Wu, D. L.; Yotnda, P. Production and Detection of Reactive Oxygen Species (ROS) in Cancers. J. Visualized Exp. 2011, 57, e3357. DOI: https://doi.org/10.3791/3357
- Yadav, R. K.; Kalia, P.; Kumar, R.; Jain, V. Antioxidant and Nutritional Activity Studies of Green Leafy Vegetables. Intl. J. Agric. Food Sci. Technol. 2013, 4(7), 707–712.
- Sreeramulu, D.; Reddy, C. V. K.; Chauhan, A.; Balakrishna, N.; Raghunath, M. Natural Antioxidant Activity of Commonly Consumed Plant Foods in India: Effect of Domestic Processing. Oxid. Med. Cell. Longevity, 2013, 2013, 369479. DOI:https://doi.org/10.1155/2013/369479
- Singh, P.; Vishwakarma, S. P.; Singh, R. L. Antioxidant, Oxidative DNA Damage Protective and Antimicrobial Activities of the Plant Trigonella Foenum-graecum. J. Sci. Food Agric. 2014, 94(12), 2497–2504. DOI: https://doi.org/10.1002/jsfa.6585.
- Kovalev, I. P.; Litvinenko, V. I. Investigation of Flavonoid Glycosides. Chemistry of Natural Compounds. 1965, 1(4), 233–241. DOI: https://doi.org/10.1007/BF00566864.
- Silverstein, R. M.; Webster, F. X.; Kiemle, D. J. Infrared Spectrometry. In Spectrometric Identification of Organic Compounds. 7 (John Wiley and Sons Inc., Hoboken, NJ, USA, 2005). 72–108.
- Sadik, C. D.; Sies, H.; Schewe, T. Inhibition of 15-lipoxygenases by Flavonoids: Structure–activity Relations and Mode of Action. Biochemical Pharmacology. 2003, 65(5), 773–781. DOI: https://doi.org/10.1016/S0006-2952(02)01621-0.
- Ha, T. J.; Shimizu, K.; Ogura, T.; Kubo, I. Inhibition Mode of Soybean Lipoxygenase-1 by Quercetin. Chemistry & Biodiversity. 2010, 7(8), 1893–1903. DOI: https://doi.org/10.1002/cbdv.200900249.
- Fiorucci, S.; Golebiowski, J.; Cabrol-Bass, D.; Antonczak, S. Molecular Simulations Enlighten the Binding Mode of Quercetin to Lipoxygenase-3. Proteins: Structure, Function, and Bioinformatics. 2008, 73(2), 290–298. DOI: https://doi.org/10.1002/prot.22179.
- Lee, J. H.; Kim, G. H. Evaluation of Antioxidant and Inhibitory Activities for Different Subclasses Flavonoids on Enzymes for Rheumatoid Arthritis. J. Food Sci. 2010, 75(7), H212–H217. DOI: https://doi.org/10.1111/j.1750-3841.2010.01755.x.
- Nagaya, H.; Ymagata, T.; Ymagata, S.; Iyoda, K.; Ito, H.; Hasegawa, Y.; Iwata, H. Examination of Synovial Fluid and Serum Hyaluronidase Activity as a Joint Marker in Rheumatoid Arthritis and Osteoarthritis Patients (By Zymography). Ann. Rheum. Dis. 1999, 58(3), 186–188. DOI: https://doi.org/10.1136/ard.58.3.186.
- Helli, B.; Shahi, M. M.; Mowla, K.; Jalali, M. T.; Haghighian, H. K. A Randomized, Triple-blind, Placebo-controlled Clinical Trial, Evaluating the Sesamin Supplement Effects on Proteolytic Enzymes, Inflammatory Markers, and Clinical Indices in Women with Rheumatoid Arthritis. Phytother. Res. 2019, 33(9), 2421–2428. DOI: https://doi.org/10.1002/ptr.6433.
- Wang, J. H.; Lou, J. F.; Luo, C.; Zhou, L. G.; Wang, M. G.; Wang, L. Phenolic Compounds from Halimodendron Halodendron (Pall.) Voss and Their Antimicrobial and Antioxidant Activities. International Journal of Molecular Sciences. 2012, 13(9), 11349–11364. DOI: https://doi.org/10.3390/ijms130911349.
- Jung, H. G.; Kim, H. H.; Dey, D. K.; Yu, J. M.; Kim, H.; Cho, Y. H.; Jang, J. Y.; Park, J. Y.; Kang, S. C.; An, B. J. The Anti-inflammatory and Immune-Boosting Potential of Quercetin-3-O-β-D-glucopyranosyl-(1 → 6)-β-D-glucopyranoside in LPS–Stimulated RAW264.7 Macrophages. Revista Brasileira De Farmacognosia. 2020, 30(2), 233–239. DOI: https://doi.org/10.1007/s43450-020-00027-3.
- Vien, L. T.; Van, Q. T. T.; Hanh, T. T. H.; Huong, P. T. T.; Thuy, N. T. K.; Cuong, N. T.; Dang, N. H.; Thanh, N. V.; Cuong, N. X.; Nam, N. H.; et al. Flavonoid Glycosides from Barringtonia Acutangula. Bioorganic & Medicinal Chemistry Letters. 2017, 27(16), 3776–3781. DOI: https://doi.org/10.1016/j.bmcl.2017.06.066.
- Woo, K. W.; Moon, E.; Park, S. Y.; Kim, S. Y.; Lee, K. R. Flavonoid Glycosides from the Leaves of Allium Victorialis Var. Platyphyllum and Their Anti-neuroinflammatory Effects. Bioorganic & Medicinal Chemistry Letters. 2012, 22(24), 7465–7470. DOI: https://doi.org/10.1016/j.bmcl.2012.10.043.