
 ?Mathematical formulae have been encoded as MathML and are displayed in this HTML version using MathJax in order to improve their display. Uncheck the box to turn MathJax off. This feature requires Javascript. Click on a formula to zoom.
ABSTRACT
A multi-class multi-residue analytical method was validated in this paper for simultaneously identifying 204 veterinary drugs in pork by UPLC-QTRAP MS/MS, including sulfonamides, quinolones, β-agonists, and nitroimidazoles. MRM-IDA-EPI mode of QTRAP was used to establish a secondary mass spectrum library of these 204 veterinary drugs, which could enhance the qualitative analysis of suspect substances. The separation of substances was performed on a C18 column, with a gradient elution of 0.1% formic acid solution in water and methanol. Electrospray ionization (ESI), fast polarity switching, and scheduled MRM mode were used to collect the characterization results. Factors that affected the recovery were delicately optimized, such as solvent proportion, formic acid content, and purification method. We finally determined the extracting method with formic acid-acetonitrile-water (0.1:90:10, v:v:v) and purifying method with Cleanert LipoNo as a package for dispersive solid-phase extraction. Matrix effects on the quantitative results were also investigated. Some compounds had strong matrix inhibition or enhancement, and the matrix matching external standard method was used to quantify the compounds accurately. The correlation coefficient R2 was over 0.99 within the calibration linearity range for the detected 204 veterinary drugs. The limit of quantification (LOQ) was 0.5 ~ 5 μg/kg. The recoveries ranged from 61.4% to 118.8% with RSDs of 3.1% to 19.2% (n = 6).
Introduction
Excessive veterinary drug residues are usually caused by the drug abuse in order to reduce the mortality rate of animals, which becomes one of the important factors that affect the safety of animal-derived food.[Citation1–3] The use of veterinary drugs is becoming increasingly secretive and complex, and new types of residues are appearing constantly in the market. All these make it difficult to effectively analyze and control the suspect residues in animal-derived food.[Citation4] To effectively monitor the risk of veterinary drug residues, it is necessary to establish a comprehensive and effective screening method for veterinary drug residues.[Citation5] Traditional detection methods are limited to screening multiple types of drugs simultaneously and usually require complicated detection steps. Ultra-performance liquid chromatography-tandem mass spectrometry (UPLC-MS/MS) has been widely used for the detection of veterinary drug residues due to its high sensitivity, high selectivity, and anti-interference capability.[Citation6–9] There are many reports on the pretreatment solutions of multiple veterinary drug residues. For example, the method of solid–liquid extraction and low-temperature purification was used to determine more than 20 categories of 115 veterinary drugs and drug residues in milk powder, butter, fish tissue, and eggs.[Citation10] QuEChERS purification was used to determine four kinds of veterinary drug residues in seafood, sulfa, tetracycline, quinolone, and malachite green residues.[Citation11] Enhanced matrix removal of lipids (EMR-Lipid) was utilized to analyze multi-class, multi-residue veterinary drug detection.[Citation12–14] A solid-supported liquid extraction clean-up using a diatomaceous earth mini-cartridge was applied to co-extract seven veterinary drugs in processed chicken food and muscle.[Citation15] These studies continuously promote the development of veterinary drug residue analysis from a single category to a cross-category high-throughput analysis.
At present, there are many commercialized pre-treatment methods in China, and there have been many related applications reported on this topic.[Citation12,Citation13,Citation16] However, most of them are usually applied for detection of certain or several types of veterinary drug residues, and their scope of application is relatively limited. In addition, few comparisons between these different purification methods are reported. In this paper, four different purification methods by commercial Oasis PRiME HLB, Captive EMR-Lipid, ProElut QuEChERS, and Cleanert LipoNo were evaluated by comparing their spike recovery rates. Furthermore, the scope of their application has been expanded to 18 categories of 204 veterinary drugs, including 22 sulfonamides, 19 quinolones, 14 β-agonists, etc., which provides a strong support for further study.
The matrix of animal-derived food is complex, mostly because they are rich in sugar, protein, fat, and other components. In contrast, the residual content of veterinary drugs is very small and the polarity difference is large, [Citation8,Citation10] making it difficult for detection since the matrix effects can easily interfere with the result.[Citation17] Conventional detection methods can only carry out quantitative detection of known objects, while they are poor in qualitative determination and deficient in screening suspect products. In order to solve these problems, mass spectrometric database is widely used for qualitative confirmation of suspect objects.[Citation18] There are reports using an internal database to identify 143 veterinary drugs and drug residues in fish tissues and milk through UHPLC-QTOF MS.[Citation19] Currently, existing standard databases are mostly based on pesticide residues, such as the National Institute of Science and Technology (NIST) Standard Reference Database[Citation20]and Chemistry Database,[Citation21] which provide a reliable basis for the screening of multiple pesticide residues. However, there are few commercially available large-scale databases based on veterinary drugs. The use of QTRAP to establish a secondary mass spectrum library of veterinary drugs is even rarer. Therefore, the establishment of a veterinary drug mass spectrum library is of great significance for the qualitative confirmation and rapid detection of veterinary drug residues in animal-derived samples.[Citation22] In this study, the MRM-IDA-EPI composite scan mode of QTRAP-MS/MS was used to obtain the secondary mass spectrum. Combining with the molecular weight, molecular formula, CAS Number, and other information about the compounds, we finally established a corresponding library. The compounds were qualitatively determined based on the matching information collected in the library so that both the reliability of the test results and the screening function were enhanced. The method established in this study is simple, rapid, sensitive, reliable, and with a good reproducibility. It provides experience and reference to establish a technology for detecting multi-class multi-residue of veterinary drugs.
Materials and methods
Equipment and reagents
Allegra X-30 R centrifuge was purchased from Beckman Coulter (Beckman Coulter Inc., USA). N-EVAP 112 mode nitrogen evaporator was obtained from Organomation (USA). Digital vortex mixer was obtained from IKA (Germany). RiOs Essential 16 water purification system was purchased from Millipore (Bedford, MA, USA). Mass grade acetonitrile and methanol were purchased from Merck (Darmstadt, Germany). Mass grade formic acid was obtained from TCI (Tokyo, Japan). Oasis PRiME HLB (6cc/200 mg) was purchased from Waters (USA). Captive EMR-Lipid (6 mL 600 mg) was obtained from Agilent Technology (USA). ProElut QuEChERS (150 mg PLS-A/50 mg PSA) was bought from Dikma Technology (Dikma Co. Ltd., Beijing, China). Cleanert LipoNo (15 mL) was purchased from Agela (Agela Co. Ltd., Tianjin, China).
Preparation of standard solution
All standard substances were purchased from Alta Technology (Alta Technology Co., Ltd., Tianjin, China) or Dr Ehrenstorfer (Augsburg, Germany). They were divided into different groups according to their classification and stability. Detailed drug information is listed in . The solid was formulated into a storage solution of 1000 μg/mL. The dissolved solvents were chosen based on their solubility, including methanol, acetonitrile, methanol-water, and methanol-acetonitrile-water. A 2000 ng/mL standard stock solution was prepared by accurately pipetting the standard solution into methanol and stored at −20°C for a maximum valid time of 6 months. Right before each use, a working standard solution at 100 ng/mL of each compound was freshly prepared in water.
Table 1 204 compounds information and MRM mass spectrometry acquisition parameters
Sample preparation
Comparison of different purification methods
Pork samples were bought from a local supermarket. 2.00 g of sample was weighed into a 50 mL plastic centrifuge tube. Then, 20 ng (i.e. 10 ng/g) mixed standard substances and 10 mL formic acid-acetonitrile- water (0.1:80:20, v:v:v) were added. The mixture was vortexed for 1 min and further extracted with ultrasound for 2 min. After centrifugation at 8,000 r/min for 3 min, 3 mL supernatant was transferred to Oasis PRiME HLB, Captive EMR-Lipid, ProElut QuEChERS, and Cleanert LipoNo, respectively. 2 mL effluent or supernatant was taken and concentrated to 0.5 mL with nitrogen-blow under 40°C. The products were redissolved with acetonitrile- water (10:90, v:v) to 1 mL. After centrifugation at 10,000 r/min for 5 min, the supernatant was transferred to sample vial for UPLC-MS/MS analysis. Each purification method was repeated for 3 times, and blank experiment was performed at the same time.
Comparison of different extraction solutions
2.00 g of sample was weighed into a 50 mL plastic centrifuge tube. 20 ng (i.e. 10 ng/g) mixed standard substances was added. For one group, 10 mL formic acid-acetonitrile- water (0.1:80:20, 0.2:80:20, 0.5:80:20,v:v:v) solution was added, respectively. For the other, 10 mL formic acid-acetonitrile- water (0.1:70:30, 0.1:80:20, 0.1:90:10,v:v:v) solution was added, respectively. The mixture was vortexed for 1 minute, and further extracted with ultrasound for 2 min. After centrifugation at 8,000 r/min for 3 min, 3 mL supernatant was transferred to Cleanert LipoNo. 2 mL supernatant was taken and concentrated to 0.5 mL with nitrogen-blow under 40°C. The products were redissolved with acetonitrile-water (10:90, v:v) to 1 mL. After centrifugation at 10,000 r/min for 5 min, the supernatant was transferred to sample vial for UPLC-MS/MS analysis. Each extraction method was repeated for 3 times, and blank experiment was performed at the same time.
Matrix effects (MEs) evaluation
There are lots of reports on the relationship between matrix concentration and matrix effects.[Citation23] The relative ratios between signals of blank matrix matched standards and pure solvent standards were then calculated to evaluate the matrix effects. Calculation was as follows:
ME < 100% indicates matrix inhibition, while ME > 100% suggests matrix enhancement. If ME = 100%, it means that the matrix has no effect on the ion response. Matrix effects are negligible if ME is between 80% and 120%.[Citation24]
Chromatography and mass spectrometry conditions
Waters Acquity UPLC I_Class ultrahigh performance liquid chromatograph and ACQUITY UPLC BEH C18 2.1 × 100 mm, 1.7 μm column were purchased from Waters (USA). This column is suitable for the simultaneous analysis of different chemical properties. Column temperature was set at 45°C. The injection volume was 2 μL and flow rate was 0.30 mL/min. The elution solvents were 0.1% formic acid-water solution (A) and methanol (B) with the following gradient: 0 ~ 0.5 min, 2% B; 0.5 ~ 13.0 min, 2%–99% B; 13.0 ~ 15.0 min, 99% B, 15.0 ~ 15.1 min, 99%–2% B; 15.1 ~ 17.0 min, 2% B.
QTRAP® 6500+ mass spectrometer with ESI source was obtained from AB SCIEX (USA). Fast polarity switching and scheduled MRM mode were used in this study.[Citation25] MRM detection window was set as 60 s. Ion spray voltage was 5,500 V (+) or −4,500 V (-), with curtain Gas at 30 psi, source temperature at 500°C, atomizing gas (GS1) at 50 psi, drying gas (GS2) at 60 psi. CAD gas value was high, and resolution was unit. The mass spectrometry parameters such as retention time (RT/min), molecular ion peak (Q1/Q3, m/z), collision energy (CE/V), and declustering potential (DP/V) of each compound are shown in .
Establishment of secondary mass spectrometry library
After creating the MRM method, IDA standard parameters and EPI mode had been added. The values were as follows: scan rate 10,000 Da/s, scan range 70–950 Da (+), 70–400 Da (-), CE 40 V/-40 V, and CES 15 V/-15 V. Under different collision energy, the intensity of the fragment peaks is significantly different. We can obtain the diagram of the fragment ion mixture under the three collision energies as low, medium, and high through CES setting. For example, we obtained a composite diagram of three energies of 25 V, 40 V, and 55 V by setting the collision energy as 40 ± 15 V, which could improve the specificity of the secondary spectrum. During the collection process, the system automatically switches to QTRAP mode once the MRM channel intensity exceeds the preset value. It will trigger the EPI mode to obtain the mass spectrum of product ions. These mass spectra were collected to form a library.
Methodological verification
Three levels of mixed standard solutions of the LOQ, 2LOQ, and 10LOQ were added to the pork to perform the recovery experiment. Extraction and purification were performed according to the optimum conditions. We performed six parallel determinations at each addition level. A calibration curve was determined by the analysis of five calibration levels (LOQ, 2LOQ, 5LOQ, 10LOQ, and 20LOQ). We added standard solutions to the blank sample and then prepared them to obtain a mixed matrix standard solution. The response value of the quantitative ion of each target was taken as the ordinate and mass concentration as abscissa. The standard curve was drawn to obtain the linear regression equation.
Results and discussion
Optimization of mass spectrometry parameters
Depending on the molecular weight and charging mode, the standard solution was directly injected into the ion source through a needle pump. We obtained the molecular ion peak and determined the parent ion of each target through the primary mass spectrometry. Then, the DP voltage was optimized. A secondary mass spectrometry was performed on the parent ion to identify two to three characteristic product ions with higher response and stability, and optimize the CE voltage.
In order to obtain the optimal intensity of the target substance during sample analysis, the chromatographic column was connected under the normal injection mode. The appropriate mass spectrum conditions were selected by optimizing the atomization voltage, curtain gas, ion source temperature, nebulizing gas, drying gas, and so on. By adding standard solution to blank samples, the ion pairs with less interference and the higher signal-to-noise ratio were monitored and identified as quantitative and qualitative ion pairs. The collection was then performed within a 60 s time window based on the retention time to obtain enough collection points.
Optimization of liquid phase conditions
Selection of mobile phase systems
Different mobile-phase systems were investigated in this study. It was found that ammonium acetate generally made the peak sharper. Meanwhile, the peak shape of quinolones tailed, and the peak intensity of sulfonamide, quinolone, and β-agonist decreased. The formic acid had significantly improved the tailing problem, which might be due to the better solubility of quinolones. The disadvantage was that the negative mode response was reduced, especially for estradiol and estriol. The chromatographic pressure in acetonitrile was moderate, but the peak shape of some compounds showed a slightly forward or trailing phenomenon. The pressure of methanol was higher than acetonitrile. Considering resolution, response intensity, and peaks shape in high-throughput screening, 0.1% formic acid-methanol-water system was used. And the flow rate gradient elution was 0.3 mL/min. The column pressure was moderate, and the mobile phase was easy to prepare, which was beneficial to the efficiency of testing.
Optimization of mobile phase ratio
The ion pairs alone could not be completely distinguished because there are many homologues in the mixture, such as sulfamonomethoxine/sulfameter/sulfamethoxypyridazine, sulfadimethoxine/sulfadoxine, sulfacetamide/sulfaguanidin, flumequin/ oxolinic acid, albendazol sulfone/5-hydroxy mebendazole, rimantadine/memantine, 4-epitetracycline/tetracycline, α-zearalenol/β-zearalenol/zearalanone. In order to solve that, the results needed to be qualitatively confirmed in combination with the retention time. Therefore, the mobile-phase gradient was optimized to achieve baseline separation of these compounds. Different compounds could be separated in this study as shown in (RT) and . All of the targets peaked before 13 min, and the instrument analysis time for one injection was 17 min.
Figure 1. Total ion chromatograms of the 204 veterinary drugs at MRM mode
Optimization of purification method
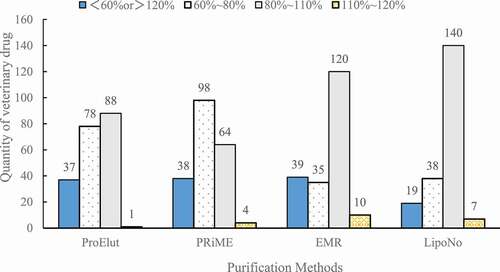
In this study, we compared four kinds of commercial pretreatment methods as Oasis PRiME HLB, Captive EMR-Lipid, ProElut QuEChERS, and Cleanert LipoNo. The experiments were repeated 3 times at 20 ng (i.e. 10 ng/g) spiked level. The detailed data were shown in . The average recovery rates of different purification methods were analyzed[Citation14,Citation22] and the results are shown in . The purification of Cleanert LipoNo showed the best recovery rate compared with the other three purification methods. It has the largest number of drugs whose recovery rates were between 80% and 110%, while least number of drugs whose recovery rates were less than 60% or more than 120% (). Therefore, Cleanert LipoNo was used for purification for the subsequent analysis in this study.
Table 2 Methodological verification data (n = 6) and mean recoveries of four purification methods (n = 3) in pork
Figure 2. Comparison of the recovery rates of the measured substances by four purification methods (n = 3)
Optimization of extraction solvents
Acetonitrile is a commonly used extraction solvent, which can extract more drugs and introduce fewer impurities in the detection of veterinary drug residue. Formic acid could play a role in precipitating proteins. The experiment compared the extraction effect of different ratios of acetonitrile-water (70:30, 80:20, 90:10, v:v)) and different formic acid contents (0.1%, 0.2%, 0.5%). The experiment repeated 3 times at a standard addition level of 20 ng (i.e. 10 ng/g) to calculate the average recovery rates. The results are shown in .
Figure 3. Recovery distribution of 204 compounds with different acetonitrile ratios and formic acid contents in extraction solvents (n = 3)
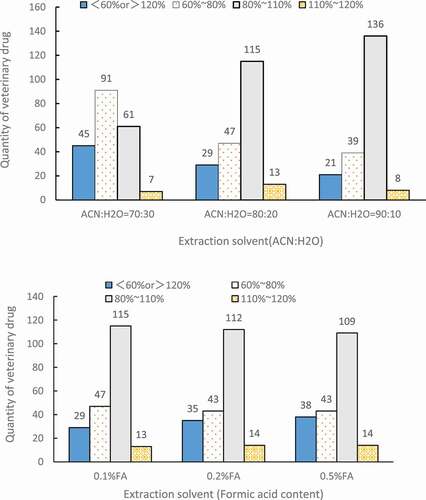
When acetonitrile–water ratio was 90:10 (v:v), it showed the largest number of drugs whose recovery rates were between 80% and 110%, while least number of drugs whose recovery rates were less than 60% or more than 120%. The change of formic acid in the extraction solvent had no obvious effect on the recovery, which was consistent with the reported study.[Citation16] Therefore, a mixed solution of formic acid-acetonitrile-water (0.1: 90:10, v:v:v) was selected for extraction in this study.
Matrix effects
Proteins and fats from the sample could enter the test solution, and they would compete with the target compounds in the ion source of LC-MS/MS. The response of the targets was enhanced or inhibited. All these result in matrix effects.[Citation26] Matrix effects affect the accuracy of the data.[Citation27] By calculating ratios between signals of blank matrix matched standards and pure solvent standards, it () showed that the MEs of the 19 compounds were less than 80%. Matrix inhibition effects were obvious, especially for sulfaguanidin, sulfathiazole, sulfacetamide, betamethasone, and clobetasol 17-propionate. The MEs of the 11 compounds were more than 120%, which indicated obvious matrix enhancement effects, especially for fluticasone propionate, dexamethasone 21-acatate, salbutamol, and terbutaline.
Methodological verification
The recoveries of the 204 compounds were not all between 60% and 120% by pure solvent standard curve. By adding standard solutions to the blank sample as described above, we could obtain accurate results. The method was validated in terms of linearity, accuracy, precision, and LOQ in pork. LOQ was calculated based on a signal-to-noise ratio of 10 and expected to produce satisfactory results. A study of recovery was carried out to determine the accuracy and precision of the method.
In our study, each compound had a good linear relationship in the corresponding concentration range, and the linear coefficient R2 was over 0.99. LOQ of all analytes achieved less than 2.0 μg/kg, except glucocorticoids. The recovery rate was between 61.4% and 118.8%, and the relative standard deviation (RSD) was in the range of 3.1% and 19.2%, which showed a good reproducibility. Detailed data is summarized in .
Application of secondary mass spectral library
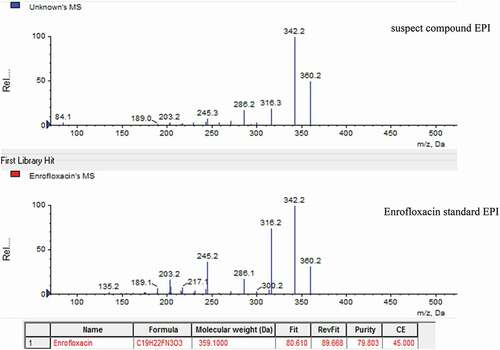
The established secondary mass spectral library can be searched to identify suspect compounds. The value of fit and purity was set as the evaluation index. Generally, the larger the value of fit and purity is, the larger the possibility of the target is. For example, shows a suspected compound whose value of fit and purity was about 80 with close to enrofloxacin in the library. Therefore, this compound was further confirmed.
Figure 4. Picture of the results of search library
Conclusion
Most standard methods can only analyze single or one type of veterinary drugs, with limited universality and timeliness in China. They no longer meet the current demand for high-throughput analysis of veterinary drug residues. This article established a high-throughput method for the simultaneous determination of 204 veterinary drug residues in animal-derived foods, including sulfonamides, quinolones, β-agonistsand nitroimidazoles, etc. A secondary mass spectrometry library of 204 veterinary drugs was constructed to identify suspects in the samples. The four commercial purification methods were compared, and the conditions affecting the recovery rate were optimized. We finally determined the extracting method with formic acid-acetonitrile-water (0.1:90:10, v:v:v) and purifying method with Cleanert LipoNo as a package for dispersive solid-phase extraction. Matrix effects on the quantitative results were also investigated. Some compounds had strong matrix inhibition or enhancement, and the matrix matching external standard method was used to quantify the compounds accurately. The LOQ was 0.5 ~ 5 μg/kg. The recoveries ranged from 61.4% to 118.8%. This method was verified in screening veterinary drug residues, and in-depth research will continue to establish a more comprehensive screening platform for veterinary drugs in the future.
Acknowledgments
This work was funded by the program “Suzhou science and technology project (SS2019039).” The authors declare no competing financial interest. Xiaoqin Li and Hongliu Ding conceived and designed the experiments. Xiaoqin Li, Xinye He, and Shuqin Zhang performed the experiments. Xiaoqin Li, Zhijuan Fang, and Xinye He analyzed the data. Xiaoqin Li, Zhijuan Fang, and Hu Ye wrote the manuscript.
Disclosure statement
No potential conflict of interest was reported by the author(s).
Additional information
Funding
References
- Rakotoharinome, M.; Pognon, D.; Randriamparany, T.; Ming, J. C.; Idoumbin, J.; Cardinale, E.; Porphyre, V. Prevalence of Antimicrobial Residues in Pork Meat in Madagascar. Trop. Anim. Health Prod. 2014, 46(1), 49–55. DOI: https://doi.org/10.1007/s11250-013-0445-9.
- Love, D. C.; Rodman, S.; Neff, R. A.; Nachman, K. E. Veterinary Drug Residues in Seafood Inspected by the European Union, United States, Canada, and Japan from 2000 to 2009. Environ. Sci. Technol. 2011, 45(17), 7232–7240. DOI: https://doi.org/10.1021/es201608q.
- Zhang, W.; Yu, Z.; Ho, H.; Wang, J.; Wang, Y.; Fan, R.; Han, R. Analysis of Veterinary Drug Residues in Pasteurized Milk Samples in Chinese Milk Bars. J. Food Prot. 2020, 83(2), 204–210. DOI: https://doi.org/10.4315/0362-028X.JFP-19-333.
- Shankar, B. P.; Manjunatha, P. B. H.; Chandan, S.; Ranjith, D.; Shivakumar, V. Rapid Methods for Detection of Veterinary Drug Residues in Meat. Vet. World. 2010, 3(5000), 241–246. DOI: https://doi.org/10.5455/vetworld.2010.241-246.
- Schneider, M. J.; Lehotay, S. J.; Lightfield, A. R. Validation of a Streamlined Multiclass, Multiresidue Method for Determination of Veterinary Drug Residues in Bovine Muscle by Liquid Chromatography-tandem Mass Spectrometry. Anal. Bioanal. Chem. 2015, 407(15), 4423–4435.
- Frenich, A. G.; Romero-González, R.; Aguilera-Luiz, M. M. Comprehensive Analysis of Toxics (Pesticides, Veterinary Drugs and Mycotoxins) in Food by UHPLC-MS. TrAC Trends Anal. Chem. 2014, 63, 158–169. DOI: https://doi.org/10.1016/j.trac.2014.06.020.
- Anumol, T.; Lehotay, S. J.; Stevens, J.; Zweigenbaum, J. Comparison of Veterinary Drug Residue Results in Animal Tissues by Ultrahigh-performance Liquid Chromatography Coupled to Triple Quadrupole or Quadrupole-time-of-flight Tandem Mass Spectrometry after Different Sample Preparation Methods, Including Use of a Commercial Lipid Removal Product. Anal. Bioanal. Chem. 2017, 409(10), 2639–2653.
- Didier, O.; Staub, S. A.; Patrick, E. Veterinary Drug Residue in Food of Animal Origin in Switzerland: A Health Concern? Chimia. 2018, 72(10), 713–717. DOI: https://doi.org/10.2533/chimia.2018.713.
- Cao, G.; Zhan, J.; Shi, X.; Deng, X.; Zhu, J.; Wu, W.; Chen, X. Analysis of 140 Veterinary Drugs and Other Contaminants in Poultry Muscle by Ultrahigh- Performance Liquid Chromatography-tandem Mass Spectrometry. Chromatographia. 2018, 81(4), 707–718. DOI: https://doi.org/10.1007/s10337-018-3475-7.
- Dasenaki, M. E.; Thomaidis, N. S. Multi-residue Determination of 115 Veterinary Drugs and Pharmaceutical Residues in Milk Powder, Butter, Fish Tissue and Eggs Using Liquid Chromatography–tandem Mass Spectrometry. Anal. Chim. Acta. 2015, 880, 103–121. DOI: https://doi.org/10.1016/j.aca.2015.04.013.
- Chen, J.; Wei, Z.; Cao, X. QuEChERS Pretreatment Combined with Ultra-performance Liquid Chromatography- Tandem Mass Spectrometry for the Determination of Four Veterinary Drug Residues in Marine Products. Food Anal. Methods. 2019, 12(5), 1055–1066. DOI: https://doi.org/10.1007/s12161-018-01431-1.
- Luo, P.; Liu, X.; Kong, F.; Chen, L.; Wang, Q.; Li, W.; Wen, S.; Tang, L.; Li, Y. Simultaneous Determination of 169 Veterinary Drugs in Chicken Eggs with EMR-Lipid Clean-up Using Ultra-high Performance Liquid Chromatography Tandem Mass Spectrometry. Anal. Methods. 2019, 11(12), 1657–1662. DOI: https://doi.org/10.1039/C9AY00275H.
- Lehotay, S. J.; Lightfield Alan, R. Extract-and-inject Analysis of Veterinary Drug Residues in Catfish and Ready-to-eat Meats by Ultrahigh-performance Liquid Chromatography-tandem Mass Spectrometry. J. AOAC Int. 2020, 103(2), 584–606. DOI: https://doi.org/10.1093/jaoacint/qsz036.
- Zhao, L.; Lucas, D.; Long, D.; Richter, B.; Stevens, J. Multi-class Multi-residue Analysis of Veterinary Drugs in Meat Using Enhanced Matrix Removal Lipid Cleanup and Liquid Chromatography-tandem Mass Spectrometry. J. Chromatogr. A. 2018, 1549, 14–24. DOI: https://doi.org/10.1016/j.chroma.2018.03.033.
- Kotaro, S.; Tsuneo, H.; Ichiro, T.; Tetsuya, S. Simultaneous Determination of Multi-class Veterinary Drugs in Chicken Processed Foods and Muscle Using Solid-supported Liquid Extraction Clean-up. J. Chromatogr. B. 2017, 1057, 15–23. DOI: https://doi.org/10.1016/j.jchromb.2017.04.041.
- Moreno-González, D.; Hamed, A. M.; Gilbert-López, B.; Gámiz-Gracia, L.; García-Campaña, A. M. Evaluation of a Multiresidue Capillary Electrophoresis-quadrupole-time-of-flight Mass Spectrometry Method for the Determination of Antibiotics in Milk Samples. J. Chromatogr. A. 2017, 1510, 100–107. DOI: https://doi.org/10.1016/j.chroma.2017.06.055.
- Manimekalai, M.; Rawson, A.; Sengar, A. S.; Kumar, K. S. Development, Optimization, and Validation of Methods for Quantification of Veterinary Drug Residues in Complex Food Matrices Using Liquid-chromatography – A review. Food Anal. Methods. 2019, 12(8), 1823–1837. DOI: https://doi.org/10.1007/s12161-019-01512-9.
- Hernández, F.; Ibáñez, M.; Sancho, J. V.; Pozo, O. J. Comparison of Different Mass Spectrometric Techniques Combined with Liquid Chromatography for Confirmation of Pesticides in Environmental Water Based on the Use of Identification Points. Anal. Chem. 2004, 76(15), 4349–4357. DOI: https://doi.org/10.1021/ac049768i.
- Dasenaki, M. E.; Bletsou, A. A.; Koulis, G. A.; Thomaidis, N. S. Qualitative Multiresidue Screening Method for 143 Veterinary Drugs and Pharmaceuticals in Milk and Fish Tissue Using Liquid Chromatography Quadrupole-time-of-flight Mass Spectrometry. J. Agric. Food Chem. 2015, 63(18), 4493–4508. DOI: https://doi.org/10.1021/acs.jafc.5b00962.
- NIST Chemistry WebBook. NIST Standard Reference Database Number 69. 2016. http://webbook.nist.gov/chemistry
- Shanghai Institute of Organic Chemistry of CAS. Chemistry Database[DB/OL]. http://www.organchem.csdb.cn.[1978-2020]
- Yin, Z.; Chai, T.; Mu, P.; Xu, N.; Song, Y.; Wang, X.; Jia, Q.; Qiu, J. Multi-residue Determination of 210 Drugs in Pork by Ultra-high-performance Liquid Chromatography-tandem Mass Spectrometry. J. Chromatogr. A. 2016, 1463, 49–59. DOI: https://doi.org/10.1016/j.chroma.2016.08.001.
- Stahnke, H.; Kittlaus, S.; Kempe, G.; Alder, L. Reduction of Matrix Effects in Liquid Chromatography- Electrospray Ionization-mass Spectrometry by Dilution of the Sample Extracts: How Much Dilution Is Needed? Anal. Chem. 2012, 84(3), 1474–1482. DOI: https://doi.org/10.1021/ac202661j.
- Matuszewski, B. K.; Constanzer, M. L.; Chavez-Eng, C. M. Strategies for the Assessment of Matrix Effect in Quantitative Bioanalytical Methods Based on HPLC-MS/MS. Anal. Chem. 2003, 75(13), 3019–3030. DOI: https://doi.org/10.1021/ac020361s.
- Dresen, S.; Ferreirós, N.; Gnann, H.; Zimmermann, R.; Weinmann, W. Detection and Identification of 700 Drugs by Multi-target Screening with a 3200 QTRAPLC-MS/MS System and Library Searching. Anal. Bioanal. Chem. 2010, 396(7), 2425–2434. DOI: https://doi.org/10.1007/s00216-010-3485-2.
- Shao, B.; Jia, X.; Wu, Y.; Hu, J.; Tu, X.; Zhang, J. Multi-class Confirmatory Method for Analyzing Trace Levels of Tetracycline and Quinolone Antibiotics in Pig Tissues by Ultra-performance Liquid Chromatography Coupled with Tandem Mass Spectrometry. Rapid Commun. Mass Spectrom. 2007, 21(21), 3487–3496. DOI: https://doi.org/10.1002/rcm.3236.
- He, Z.; Chen, S.; Wang, L.; Peng, Y.; Luo, M.; Wang, W.; Liu, X. Multiresidue Analysis of 213 Pesticides in Leek and Garlic Using QuEChERS-based Method and Gas Chromatography-triple Quadrupole Mass Spectrometry. Anal. Bioanal. Chem. 2015, 407(9), 2637–2643. DOI: https://doi.org/10.1007/s00216-015-8485-9.