
ABSTRACT
The objective of this study was to characterize the insoluble and soluble dietary fiber present in Argentine and Italian artichoke (Cynara scolymus) by-products by comparing chemical analysis and ATR-FTIR spectroscopy. Non-edible bracts of Argentine (AR) and Italian (Benevento (BN) and Sicily (SC)) artichoke cultivars were employed. The soluble and insoluble dietary fibers were extracted by physical procedures and determined by chemical, attenuated total reflection Fourier transform infrared (ATR-FTIR) spectroscopy, and chemometric analysis (principal components analysis, PCA). No differences in total dietary fiber content between AR and SC samples were observed, although they both showed higher values than BN. With respect to insoluble fiber, this fraction represents 82.5%, 63.5%, and 55.2% of the total dietary fiber for BN, SC and AR, respectively. Fibers from AR presented different compositions and structures, as determined by ATR-FTIR, compared to those of the Italian cultivars (BN and SC). Comparing the results of dietary fiber measured by ezymogravimetric assay with those obtained by ATR-FTIR and PCA, we conclude that it is possible to discriminate samples that contain different kinds of fiber using ATR-FTIR.
Introduction
Several vegetables, such as cabbage, asparagus, artichoke, and onion, result in a huge amount of waste during processing of up to 40–50% of their fresh weight.[Citation1] Such underused material contains both soluble and insoluble fiber that can be extracted and used for several food applications[Citation2] or even in other industries in which fibers are used as potential reinforcers of composite structures.[Citation3] Dietary fiber consists of a complex group of natural carbohydrate polymers made of a variety of nonstarch polysaccharides, such as cellulose, hemicelluloses, lignin, and pectin.[Citation4] Soluble fiber easily dissolves in water and it is broken down into a gel-like substance in the gut colon. Indigestible part in insoluble fibers of plant material does not dissolve in water and is left intact as food moves through the gastrointestinal tract. Unlike simple carbohydrates, which include most simple sugars, fiber is a complex carbohydrate and does not raise blood sugar levels. High dietary fiber consumption is associated with the prevention and treatment of diseases, such as obesity, diabetes, colorectal cancer, and atherosclerosis.[Citation5] In fact, the main physiological function of dietary fiber is to expand the stomach to provide a powerful satiety signal, allowing the feeling of being full and satisfied. The other functions of dietary fiber are to support the fermentation of bacteria and the increment of the fecal volume, mainly in the large intestine.[Citation6]
In recent years, numerous reports have highlighted that artichokes are particularly rich in soluble and insoluble fiber, which is also abundant in the inedible portion of artichokes, bracts or leaves, which are usually regarded as waste. In particular, the artichoke canning industry generates a large amount of agricultural waste that represents approximately 80–85% of the total biomass of the plant, consisting mainly of leaves.[Citation7] Such waste could be used for the recovery of dietary fiber that is both soluble and insoluble. In artichokes, insoluble fiber is constituted mainly by cellulose and hemicellulose, while the soluble fiber fraction is formed mainly by inulin, which is characterized by its prebiotic and bifidogenic effects.[Citation8]
FTIR spectroscopy has become an attractive alternative to traditional analytical methods due to the small amount of sample needed, the simple preparation that does not require hazardous solvents, and the rapidity and reproducibility of the analyses.[Citation9,Citation10] The performance of the developed SIMCA model was evaluated through the interclass distance between the insoluble and soluble fiber in the samples, the three-dimensional principal component analysis score plot, and the recognition and rejection rates of the samples. It is expected that the method could be useful to verify the fiber typology of several other agrifood by-products.
Materials and methods
Materials
Three cultivars of globe artichoke (Cynara scolymus) were collected at the commercial maturity stage: “Madrigal” (La Plata, Argentina), “Violetto di Sicilia” (Bronte, Italy), and “Bianco di Benevento” (Benevento, Italy). Samples were washed with water, and the external nonedible bracts were manually cut from the capitula. Bracts were freeze dried, milled into powder (500 µm) and kept in plastic bags until further analysis. All the chemicals and standard reagents used were from Sigma Aldrich (Buchs, Switzerland).
Solvents and reagents
Standard samples: chlorophyll a (CAS: 479–61-8) with purity > 95% HPLC (impurity of chlorophyll b < 0.4%) and chlorophyll b (CAS: 519–62-0) with purity > 90% HPLC (impurity of chlorophyll a < 0.5%) were purchased from Sigma–Aldrich (Milan, Italy). Solvents and reagents included acetone, triolein, methanol, n-hexane, hydrochloric acid and acetic acid, which were purchased from Sigma–Aldrich (Milan, Italy). Formic acid (FA), water (H2O), and methanol (MeOH) were provided by Carlo Erba Reagents (Milan, Italy). Deionized H2O was obtained from a Milli-Q water system (Millipore, Darmstadt, Germany).
Separation of soluble and insoluble fiber
Separation of soluble and insoluble fiber was carried out according to Boubaker et al.[Citation11]with slight modifications. One gram of the artichoke powder was extracted with 20 mL of distilled water at 70°C for 60 min under constant agitation (500 rpm) before being centrifuged for 15 min at 4000 rpm. The supernatant was collected and saved for further extraction. The solid residue was re-extracted under the same conditions and thereafter freeze dried (insoluble fiber). Both supernatants were mixed, and the final volume was measured. Extraction of the soluble fibers was carried out by pouring the corresponding volume of pure ethanol into the total supernatant to achieve a final concentration of 80% ethanol. The mixture was then sonicated at 40 kHz for 10 min and centrifuged (15 min at 4000 rpm); finally, the alcoholic phase was discarded, and the pellet containing soluble fiber was freeze-dried.
Dietary fiber quantification
Total and insoluble dietary fiber was determined by enzymatic hydrolysis (Megazyme kit, K-TDRF, Megazyme, Wicklow, Ireland) according to the official AOAC method.[Citation12] Soluble dietary fiber was calculated as total dietary fiber minus insoluble dietary fiber. Assays were performed in duplicate.
ATR-Fourier transform infrared (FTIR) spectroscopic analysis
ATR-FTIR analysis was performed using a Spectrum 400 spectrophotometer (PerkinElmer, Waltham, MA USA) equipped with a DTGS detector. Overall, 32 scans/spectrum were acquired in the 4000–650 cm−1 range with a resolution of 4 cm−1. Dried samples of soluble and insoluble fiber were analyzed without any previous treatment. To test repeatability, analyses were performed in triplicate, and average spectra were used. Spectra were analyzed using PE Spectrum software version 10.5.1, which was purchased with the instrument.
Statistical analysis
Spectrum Assure ID software (trademark of PerkinElmer, Inc., Part Number 0993 4516 Release E; Publication Date July 2006; Software Version 4.x) and a sample checking system that utilizes FTIR and FTNIR spectroscopy to generate sample-specific ’fingerprints’ of production materials were used. The soft independent modeling class algorithm (SIMCA) algorithm was employed to classify new samples. SIMCA develops separate models (so-called disjointed class models or SIMCA hyperboxes) based on principal component analysis (PCA) for each training set category. Spectra were subjected to baseline correction and normalization prior to the statistical analysis (PCA), which was used as an unsupervised classification technique to sort the spectra into different categories. The score plot consisting of a projection of the original data onto principal component axes was used to visualize clustering among samples (sample patterns, groupings, or outliers). Hence, PCA was performed to evaluate the potential of ATR-FTIR to differentiate the spectra of different fiber typologies. For cluster analysis, the spectral ranges of (I) 3600–2800, (II) 1800–1500, (III) 1499–1200, and (IV) 1199–650 cm−1 from 10 samples for each group were independently analyzed. The performance of the developed SIMCA model was evaluated using the interclass distance among the AR “Madrigal” (La Plata, Argentina), SC “Violetto di Sicilia” (Bronte, Italy), and BN “Bianco di Benevento” (Benevento, Italy) groups, three-dimensional principal component analysis, score plots, and the recognition and rejection rates of the samples.
Results and discussion
Chemical analysis
Artichokes produce a huge amount of waste when they are used to prepare culinary dishes. In fact, the percentage of the edible part compared to waste from artichokes is between 30 and 50%.[Citation13–15] Therefore, it is very important to recover reusable components from artichoke waste, especially fiber, due to its nutritional benefits.[Citation16,Citation17] Considering this, we first analyzed the percentage of soluble and insoluble fiber present in external nonedible artichoke bracts by chemical methods. In , the results of the chemical analysis are reported. All samples showed values of total dietary fiber higher than 50%; nevertheless, Argentine bracts of “blanco madrigal” (AR) and Italian bracts of “violetto di Sicilia” (SC) had the highest content (average 60%), while Italian bracts of “bianco di Benevento” (BN) had the lowest amount (average 55%). On the other hand, the sample with the highest content of soluble fiber was AR (approximately 27%), followed by SC (approximately 22%). The lowest amount of soluble fiber was observed in BN (less than 10%). In the case of insoluble fiber, the BN bracts showed the highest content, followed by SC and AR bracts. Di Venere et al. in 2005[Citation18] found differences in the amount of soluble fiber between some artichoke cultivars, with values ranging from approximately 1 g x 100 g−1 (for cv. Hyerois to above 6 g x 100 g−1 in “Centofoglie,” “Bayrampasa” and “Mazzaferrata” varieties).
Table 1. Chemical analysis of the total dietary fiber (TDF), insoluble dietary fiber (IDF) and soluble dietary fiber (SDF) in non-edible artichoke bracts
These values are on a wet basis and consider only inulin as soluble fiber. In our study, the soluble fiber content reported in was at much higher values, although the results were calculated on dried samples and include all the components of soluble fiber, of which inulin is by far the soluble fiber most present in artichokes.[Citation7,Citation19] Other authors found that both the genotype and the environment influence the inulin content of artichoke.[Citation20] Moreover, genotypes with early production accumulated more inulin than genotypes with late production. Lattanzio et al. in 2009[Citation21] documented inulin content ranges in artichoke heads that were between 19 and 36% (dry matter basis), depending on the morphology of the cultivar.
ATR-FTIR spectra of insoluble and soluble fiber
The FTIR technique was used to differentiate the soluble and insoluble fiber of the different cultivars of artichoke byproducts. The ATR-FTIR profiles of the three cultivars of artichoke bracts widely overlapped (), suggesting similarities in the component structure. In , ATR-FTIR spectra of soluble () and insoluble () fractions of samples are reported. Regarding soluble samples, the intensity of the main bands can be ascribed to the amount of soluble fiber in the three types of artichokes, which are in the order of AR > SC > BN (), in agreement with what has been found by chemical analysis. All samples show similar global profiles with the wavelengths of the main bands equally but with different intensities. In fact, the richest sample for insoluble fiber was BN, followed by SC and finally AR, as evidenced in particular by the bands at 1733, 1623, 1417, 1371, 1320, 1238, 1150, 1100, 1052, and 1028 cm−1 present in all samples ().
Figure 1. ATR-FTIR spectra of bracts from: “blanco madrigal” (AR-Argentina, green curve), “violetto di Sicilia” (SC-Italy, red curve), “bianco di Benevento” (BN-Italy, black curve)
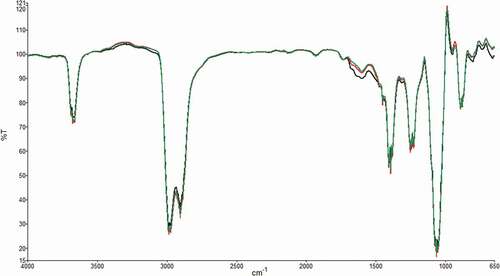
Figure 2. ATR-FTIR spectra of soluble (a) and insoluble (b) fractions of artichoke bracts. Samples: AR (green curve), SC (red curve), BN (black curve)
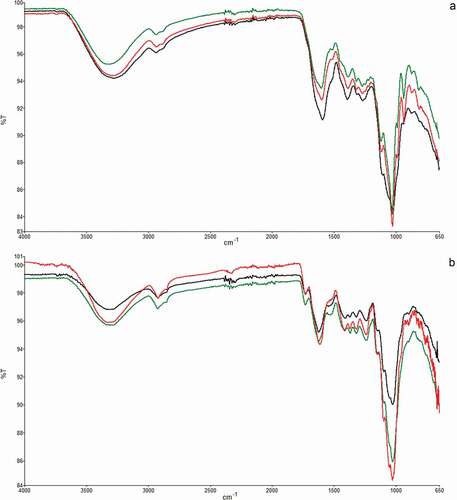
In , the main assignments of ATR-FTIR peaks for artichoke insoluble and soluble fiber are reported based on current literature.[Citation22,Citation23] Moreover, the peaks for pectin, inulin and hydroxy-methyl cellulose (HMC) used as reference samples are also included in to compare overlapping bands with the samples. From the examination of the bands, it can be deduced that soluble and insoluble samples showed two characteristic broad absorption bands at 3500–3000 cm−1 (O–H stretching vibration of the hydroxyl group) and 2900–2800 cm−1 (C–H stretching vibration of methyl and methylene), which revealed the presence of the typical structure of polysaccharide compounds.[Citation24] The peak at 1743 cm−1 corresponds to a carbonyl group stretching vibration of ester groups, and the peak at 1647 cm−1 belongs to aromatic benzene of lignin, which was observed in all samples. The intense band at 1743 cm−1 is present only in soluble AR fiber and absent in soluble SC and BN samples, and it is ascribable to C=O stretching in pectin methylesters.[Citation25]
Table 2. Assignment of ATR-FTIR peaks of artichoke insoluble and soluble fiber of AR, BN and SC samples analyzed with SIMCA
Soluble AR and SC samples show bands well defined at 934 and 987 cm−1, while these bands are only hinted at in BN. These bands are present in the inulin spectrum, even though slightly shifted in their wavelength. Additionally, at 817 cm−1, all three samples have a band attributable to inulin (821 cm−1) of decreasing intensity, precisely in the order of AR, SC, and BN. The band at 874 cm−1 is present in AR, SC and BN and is attributable to inulin, even if it is present at 870 cm−1 in the inulin spectrum.
It was absent in the insoluble samples. At 986 cm−1, the inulin spectrum shows a band that is present in AR and SC but not in BN, suggesting that BN does not contain oligosaccharides. Additionally, the band at 1018 cm−1 in the AR and SC spectra and at 1027 cm−1 in the BN spectrum could be attributable to the presence of inulin, which shows an intense band at 1013 cm−1. The 2930 cm−1 inulin band is present in AR ( and b) and in SC (2933 cm−1), while it is absent in BN. This outcome confirms the chemical analysis, attributing a greater soluble fiber content to the AR sample, followed by SC and BN, which are characterized by a lower content.
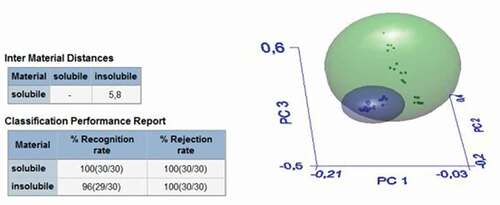
With the aim of developing models for discriminating between bracts with high or low contents of soluble fiber, ATR–FTIR spectra of all samples were subjected to SIMCA analysis. show the 3D-PCA score plots generated by the SIMCA models in the different comparisons. shows the results of SIMCA analysis for insoluble fiber samples of AR, SC and BN. In this case, the differences between the three samples were not significant, and only one cluster was obtained; in fact, the intermaterial or interclass distance (IMD) was inferior to 3 (). In , the spectra of the soluble fiber samples of the three zones were analyzed by SIMCA. Three clusters were obtained, green (AR), black (BN) and red (SC), with very significant intermaterial distances between the AR and Italian samples (SC and BN) with IMD values of 12.5 and 18.1 between the AR, SC and BN samples, respectively (). The recognition rate percentage was equal to 100; therefore, the three types of soluble samples are significantly different from each other; in particular, the AR sample was different from the SC one, as reported in . In , all soluble samples were compared with insoluble samples: they were separated into two distinct clusters, green for soluble and blue for insoluble samples, with an IMD of 5.8 and with a 100% recognition rate percentage. Thus, there is a significant difference between the soluble and insoluble fractions of the artichoke bract fiber.
Table 3. Interclass distance of insolube (IF) and soluble fibers (SF) of AR, BN and SC samples at the spectal ranges analyzed with SIMCA
Figure 3. SIMCA analysis for insoluble fiber samples (AR, SC, BN)
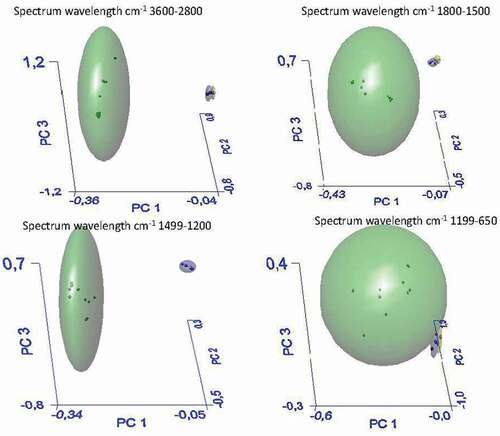
Figure 4. SIMCA analysis for soluble fiber samples (AR, SC, BN)
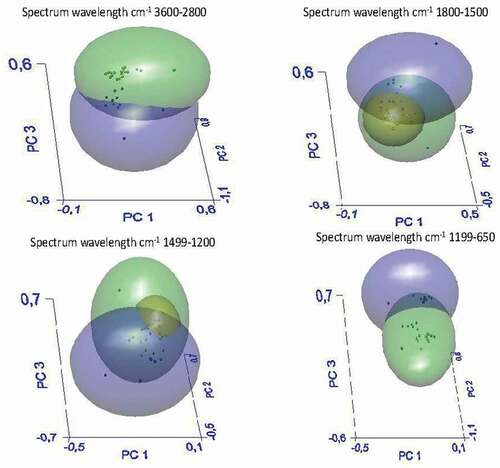
Figure 5. SIMCA analysis soluble fiber vs. insoluble fiber of all samples
In parallel, a one-way ANOVA test was performed for all soluble and insoluble samples, as reported in . A one-way ANOVA test was performed on the specific band regions of the soluble and insoluble samples, particularly in the following band regions: A) 3600–2800 cm−1, B) 1800–1500 cm−1, C) 1499–1200 cm−1, D) 1199–650 cm−1 and in the whole region E) 4000–650 cm−1. This analysis confirms the significant difference between the two groups of samples in the whole spectra and in specific band regions except in the 3600–2800 cm−1 region. Moreover, SIMCA analysis of all soluble and insoluble samples also showed a separation of geographical origin. Indeed, Italian samples did not show significant differences between them, but only with Argentine samples. Such differences could be due not only to the fact that artichokes are different cultivars but also to environmental conditions, such as water rains and soil conditions, including physical characteristics (granulometry, adsorption properties) and chemical composition (minerals, clay).[Citation20] The ATR-FTIR technique was applied to verify the significant differences between the soluble and insoluble fractions of the artichoke bracts. ATR-FTIR is a rapid and nondestructive technique capable of highlighting significant differences between the samples.
Table 4. Anova OneWay of insolube (IF) and soluble fibers (SF) of AR, BN and SC samples in the following spectral band regions: A) 3600–2800 cm−1; B) 1800–1500 cm−1; C) 1499–1200 cm−1; D) 1199–650 cm−1; E) 4000–650 cm−1.
Conclusion
Soluble/insoluble fiber of artichoke bracts was successfully analyzed with ATR-FTIR. Moreover, this technique indicates that there are geographical differences, indeed, the Italian cultivars are more similar to each other than to the Argentine cultivar. These findings proved that by-products of artichokes can be analyzed with a fast method such as ATR-FTIR to identify the content of soluble and insoluble fibers and also similarities between the type of fiber and between cultivars. The fiber recovery from artichokes by-products is important because it may be used in various foodstuffs in order to enrich them with an important component of the diet or in industrial applications such as fillers in paper and other composites.
Acknowledgments
We want to thank Ing. Adriana Riccetti and “Alcauciles Platenses” association for the provision of Argentinean artichoke samples.
Disclosure statement
No potential conflict of interest was reported by the author(s).
Additional information
Funding
References
- Rodríguez, R.; Jimenez, A.; Fernández-Bolanos, J.; Guillen, R.; Heredia, A. Dietary Fibre from Vegetable Products as Source of Functional Ingredients. Trends Food Sci. Technol. 2006, 17(1), 3–15. DOI: https://doi.org/10.1016/j.tifs.2005.10.002.
- Maurya, A. K.; Pandey, R. K.; Rai, D.; Porwal, P.; Rai, D. C. Waste Product of Fruits and Vegetables Processing as a Source of Dietary Fibre: A Review. Trends Biosci. 2015, 8(19), 5129–5140.
- Fiore, V.; Valenza, A.; Di Bella, G. Artichoke (Cynara Cardunculus L.) Fibres as Potential Reinforcement of Composite Structures. Compos. Sci. Technol. 2011, 71(8), 1138–1144. DOI: https://doi.org/10.1016/j.compscitech.2011.04.003.
- Macagnan, F. T.; da Silva, L. P.; Hecktheuer, L. H. Dietary Fibre: The Scientific Search for an Ideal Definition and Methodology of Analysis, and Its Physiological Importance as a Carrier of Bioactive Compounds. Food Res. Int. 2016, 85, 144–154. DOI: https://doi.org/10.1016/j.foodres.2016.04.032.
- Kaczmarczyk, M. M.; Miller, M. J.; Freund, G. G. The Health Benefits of Dietary Fiber: Beyond the Usual Suspects of Type 2 Diabetes Mellitus, Cardiovascular Disease and Colon Cancer. Metabolism. 2012, 61(8), 1058–1066. DOI: https://doi.org/10.1016/j.metabol.2012.01.017.
- Hervert-Hernández, D.; Goñi, I. Dietary Polyphenols and Human Gut Microbiota: A Review. Food Rev. Int. 2011, 27(2), 154–169. DOI: https://doi.org/10.1080/87559129.2010.535233.
- Ruiz-Cano, D.; Pérez-Llamas, F.; Frutos, M. J.; Arnao, M. B.; Espinosa, C.; López-Jiménez, J. Á.; Castillo, J.; Zamora, S. Chemical and Functional Properties of the Different By-products of Artichoke (Cynara Scolymus L.) From Industrial Canning Processing. Food Chem. 2014, 160, 134–140. DOI: https://doi.org/10.1016/j.foodchem.2014.03.091.
- López-Molina, D.; Navarro-Martínez, M. D.; Rojas-Melgarejo, F.; Hiner, A. N.; Chazarra, S.; Rodríguez-López, J. N. Molecular Properties and Prebiotic Effect of Inulin Obtained from Artichoke (Cynara Scolymus L.). Phytochemistry. 2005, 66(12), 1476–1484. DOI: https://doi.org/10.1016/j.phytochem.2005.04.003.
- Subramanian, A.; Rodriguez-Saona, L. Chapter 7 - Fourier Transform Infrared (FTIR) Spectroscopy. In Infrared Spectroscopy for Food Quality Analysis and Control; Sun, D.-W., Ed.; Academic Press: San Diego, 2009; pp 145–178.
- Valand, R.; Tanna, S.; Lawson, G.; Bengtström, L. A Review of Fourier Transform Infrared (FTIR) Spectroscopy Used in Food Adulteration and Authenticity Investigations. Food Addit. Contam. 2020, 37(1), 19–38. DOI: https://doi.org/10.1080/19440049.2019.1675909.
- Boubaker, M.; Omri, A. E. L.; Blecker, C.; Bouzouita, N. Fibre Concentrate from Artichoke (Cynara Scolymus L.) Stem By-products: Characterization and Application as a Bakery Product Ingredient. Food Sci. Technol. Int. 2016, 22(8), 759–768. DOI: https://doi.org/10.1177/1082013216654598.
- AOAC. Official Methods of Analysis, 16th ed.; AOAC International: Gaithersburg, USA, 1998.
- Cappelletti, R.; Balducci, F.; Diamanti, J.; Mazzoni, L.; Capocasa, F.; Battino, M.; Mezzetti, B. Agronomic and Nutritional Quality, and Fresh and Processing Attitude, of Globe Artichoke (Cynara Cardunculus L. Var. Scolymus) Cultivars and an Italian Landrace. J. Hortic. Sci. Biotechnol. 2016, 91(6), 634–644. DOI: https://doi.org/10.1080/14620316.2016.1208545.
- Lim, T. K. Cynara Cardunculus. In Edible Medicinal And Non-Medicinal Plants: Volume 7, Flowers; Lim, T. K., Ed.; Springer Netherlands: Dordrecht, 2014; pp 291–328.
- Pandino, G.; Lombardo, S.; Mauromicale, G. Chemical and Morphological Characteristics of New Clones and Commercial Varieties of Globe Artichoke (Cynara Cardunculus Var. Scolymus). Plant Foods Human Nutr. 2011, 66(3), 291. DOI: https://doi.org/10.1007/s11130-011-0247-z.
- Femenia, A.; Robertson, J. A.; Waldron, K. W.; Selvendran, R. R. Cauliflower (Brassica Oleracea L), Globe Artichoke (Cynara Scolymus) and Chicory Witloof (Cichorium Intybus) Processing By-products as Sources of Dietary Fibre. J. Sci. Food Agric. 1998, 77(4), 511–518. DOI: https://doi.org/10.1002/(SICI)1097-0010(199808)77:4<511::AID-JSFA74>3.0.CO;2-2.
- Fissore, E. N.; Santo Domingo, C.; Gerschenson, L. N.; Giannuzzi, L. A Study of the Effect of Dietary Fiber Fractions Obtained from Artichoke (Cynara Cardunculus L. Var. Scolymus) on the Growth of Intestinal Bacteria Associated with Health. Food Funct. 2015, 6(5), 1667–1674. DOI: https://doi.org/10.1039/C5FO00088B.
- Di Venere, D.; Linsalata, V.; Pace, B.; Bianca, V.; Perrino, P. Polyphenol and Inulin Content in a Collection of Artichoke. IV Int. Congr. Artichoke. 2005, 681, 453–460.
- Machado, M. T. C.; Eça, K. S.; Vieira, G. S.; Menegalli, F. C.; Martínez, J.; Hubinger, M. D. Prebiotic Oligosaccharides from Artichoke Industrial Waste: Evaluation of Different Extraction Methods. Ind. Crops Prod. 2015, 76, 141–148. DOI: https://doi.org/10.1016/j.indcrop.2015.06.047.
- Melilli, M. G.; Tringali, S.; Bognanni, R.; Argento, S.; Calderaro, P.; Raccuia, S. A. Nutritional Quality of Globe Artichoke [Cynara Cardunculus L. Subsp. Scolymus (L.) Hegi] Head as Affected by Genotype and Environment of Cultivation. Acta Hortic. 2014, 1040, 187–192. DOI: https://doi.org/10.17660/ActaHortic.2014.1040.24.
- Lattanzio, V.; Kroon, P. A.; Linsalata, V.; Cardinali, A. Globe Artichoke: A Functional Food and Source of Nutraceutical Ingredients. J. Funct. Foods. 2009, 1(2), 131–144. DOI: https://doi.org/10.1016/j.jff.2009.01.002.
- Schulz, H.; Baranska, M. Chapter 12 - Fruits and Vegetables. In Infrared Spectroscopy for Food Quality Analysis and Control; Sun, D.-W., Ed.; Academic Press: San Diego, 2009; pp 321–353.
- Chylińska, M.; Szymańska-Chargot, M.; Kruk, B.; Zdunek, A. Study on Dietary Fibre by Fourier Transform-infrared Spectroscopy and Chemometric Methods. Food Chem. 2016, 196, 114–122. DOI: https://doi.org/10.1016/j.foodchem.2015.09.029.
- Yan, X.; Ye, R.; Chen, Y. Blasting Extrusion Processing: The Increase of Soluble Dietary Fiber Content and Extraction of Soluble-fiber Polysaccharides from Wheat Bran. Food Chem. 2015, 180, 106–115. DOI: https://doi.org/10.1016/j.foodchem.2015.01.127.
- Vidal, S.; Williams, P.; O’Neill, M. A.; Pellerin, P. Polysaccharides from Grape Berry Cell Walls. Part I: Tissue Distribution and Structural Characterization of the Pectic Polysaccharides. Carbohydr. Polym. 2001, 45, 315–323. DOI: https://doi.org/10.1016/S0144-8617(00)00285-X.