
 ?Mathematical formulae have been encoded as MathML and are displayed in this HTML version using MathJax in order to improve their display. Uncheck the box to turn MathJax off. This feature requires Javascript. Click on a formula to zoom.
ABSTRACT
Heat generation is inevitable during grain storage, i.e., temperature would raise in grain bulk mainly caused by environment and microbiology. However, grain usually has great thermal resistance, the inner grain bulk temperature would raise quickly caused by microbiology when mold appeared and propagated. Temperature has a direct relation with the grain quality, and generally used as a key index to monitor stored grain. Quickly and visual methods to show and predict the temperature of inner grain bulk would improve stored grain security. In this study, grain storage test was carried out in a house (4 m × 4 m × 7 m) with 30,000 kg corn (14.0%, wb). During the whole experiment, the mold analysis was carried out by detecting fungal spore. Heat transfer in the bulk corn during microbial heating was analyzed through cloud image created by MATLAB. Temperature changes of vertical and horizontal sections in the bulk corn were drawn to be cloud image. Areas of the six sections and bulk volume with a temperature over 25°C were calculated at different times. Then the relationships between the areas, volume and temperature difference were established. The results showed that under the action of microorganism, the center of bulk corn formed quickly high-temperature zone. The heat transfer distance (equivalent radius r) in the vertical and horizontal sections was a function of temperature difference , which showed an obvious linear relationship during high-temperature zone development. The volume of the high-temperature zone was a cubic polynomial function of temperature difference
. This study provides a new method for predicting the development of microbiological heating in grain storage and lays a foundation for research on stored grain automatic management.
Introduction
Consisting of endosperm and germ, corn is a main economic crop in the world.[Citation1] Over 100 million metric tons of corn were produced in 2015, with the United States, China, Brazil, and the continent of Africa producing 34%, 21%, 7.8%, and 7% of the total corn, respectively.[Citation2] Measures should be applied during storage to ensure the quality of grain such as lowing temperature by aeration[Citation3]and using insecticide or biological technology to control insects. In China, bulk corn is usually stored for 3 years or even longer and the longer storing period means the greater challenge for ensuring corn quality.[Citation4]
During long-term bulk corn storage, there are living and nonliving factors, which interacting with each other, can affect bulk corn quality and quantity. The living factors mainly include bulk corn itself, microorganisms, insects, etc. The nonliving factors commonly include storage time, bulk corn temperature, moisture content, and gas composition.[Citation5] The nonliving factors are influenced by ambient temperature and relative humidity, solar radiation, wind, and size and shape of storage structures,[Citation6,Citation7] mainly because external ambient heat can result in temperature gradient and water migration of bulk corn through heat exchange with the wall and top of the warehouse. In such condition, some pockets of bulk corn might be warmer than adjacent locations.[Citation5] These warm pockets of grain are usually defined as hotspots.[Citation5] Both fungi and insects can initiate warm pockets.[Citation8,Citation9] Hotspots are mainly caused by storage fungi especially Penicillium and Aspergillus.[Citation10] And the heat of microorganism respiration was the main heat source of initial hot spots.[Citation11] During the storage period, the growth of field fungi, such as Fusarium would be inhibited.[Citation12] According to research,[Citation13]the breakdown of 1 g of dry matter by aerobic respiration of microorganisms, 0.6 g of water and 15.4 kJ of heat energy will be released. The heat and water produced by respiration can induce a self-accelerating heating process. If the hotspots are not controlled, the bulk corn of whole warehouse will be affect. Therefore, measuring bulk corn temperature is the important and effective tool used by the grain industry for monitoring the storage status and ambient conditions of conventional storage structures to prevent grain mold and reduce losses from spoilage. Once a hotspot is found in the bulk grain, ventilation should be an effective and economical way used to low the grain temperature, which can effectively and economically avoid quality loss.[Citation14]
Cloud imaging is a method to record and mark phenomena with some physical quantities, such as temperature, humidity, force and velocity. It has been used in various fields including remote sensing, geologic examination of plant diseases and insect pest detection, seed viability evaluation, etc. For example, in the process of seed viability evaluation, the seed is heated or cooled, resulting in a temperature different from the surrounding environment. The seed viability can be judged by tracking the thermal profiles taken by the thermal imaging instrument.[Citation15]During the bulk corn storage, the heat produced by fungi and insects is not dissipated rapidly due to low thermal conductivity and diffusivity of the stored corn and low free convective currents inside the stored bulk corn.[Citation16] Jun Yin used the cloud image to analyze the temperature changes of bulk grain in different warehouse.[Citation17,Citation18] However, only qualitative analysis was conducted and not quantitative calculation had been missing. The corn temperature at different positions in the bulk corn can been montiored by sensors. By analyzing the temperature changes cloud image in different spaces and at different times of the bulk corn, the initial time and location of the hotspots can be determined, and then corresponding measures such as ventilation and cooling can be taken to eliminate the hotspots and maintain the quality of stored corn.
The stored bulk corn constitutes a multiphase system including both discrete (corn) and continuous (air) phases. To predict the temperature and moisture content alterations depending upon the external and internal interacting factors, numerical techniques was used to model the stored-grain ecosystem starting from the 1970’s. The finite difference method,[Citation19] finite element method,[Citation20] finite volume method[Citation21]and discrete element method[Citation22] are four main types of numerical methods. Compared with the above four methods, the cloud imaging analysis for bulk corn has the following advantages:(i) no boundary condition data need to be measured, which reduces the workload.(2) there is no need to calculate complex partial differential equations, which improves the running speed of the computer.
In summary, the aim of this research was to: (i) explore the application of cloud imaging for monitoring and predicting the microbiological heating of bulk corn, (ii) analyze the microbiological temperature changes of bulk corn different sections by cloud imaging, (iii) establish planar and spatial variation rules of cloud imaging analysis for bulk corn microbiological heating.
Materials and methods
Experimental station
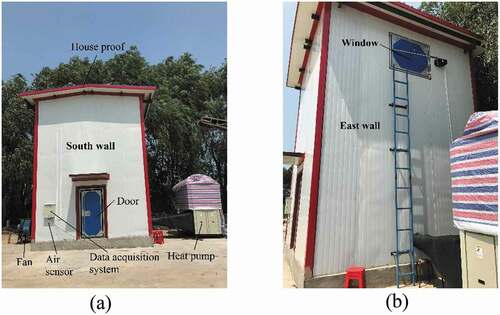
The experiment was conducted in a test house located in Changchun, Jilin province, China, 124°02ʹ E and 43°11ʹ N (). In China, most of the horizontal warehouses used for grain storage are rectangular buildings that are 20 ~ 40 m in width, 40 ~ 60 m in length, and 7 ~ 8 m in height. In order to simulate microbiological heating in horizontal warehouses, considering the warehouse shape, the test house was designed as a cuboid. And the wall and proof of the house were made of a color plate with rock wool (0.10 m thickness) to maintain the thermal insulation of the test house similar to that of the horizontal warehouses. The house was 4 m in east-west length, 4 m in south-north length and 7 m in height, which includes the 0.7 m section from the top of the cube to the peak of the roof. The bottom of the test house was concrete, which was consistent with the horizontal warehouses and was 0.3 m high above the ground. The east wall top of the house had a square window that was 1 m in length (). The south wall had a length of 1 m and a rectangular door with the height of 2 m (). The sealing and thermal insulation of the test house door and window is consistent with the horizontal warehouses. The window was opened when sampling but was closed at other times, and the door was closed during the experiment period. The east wall and west wall of the test house were, respectively, connected with a heat pump and a fan through pipes (). Both heat pump and fan can ensure the bulk corn quality by controlling grain temperature. The bulk corn was stored for 7 months. In order to explain temperature changes during bulk corn microbiological heating, we only analyzed the temperature and humidity data for 19 days after the bulk corn temperature began to rise during the storage period.
Figure 1. Photos of the test house
Storage product procurement and preparation
Approximately 30,000 kg of bulk corn newly harvested with high moisture content was purchased from a farmer in Jilin province, China. The bulk corn was dried and screened to remove impurities, which was considered to meet the bulk corn storage standard.[Citation23] Then the bulk corn was put into the test house and displayed in the form of particle heap in the test house. The height of the bulk corn was 4 m. After storage, the initial bulk corn temperature was 23°C. The moisture content (MC) of the bulk corn was determined by a electric blast drying oven (Ecocell 111, MMM, Inc., Germany) through drying 15 g samples in triplicate at 103°C for 72 h.[Citation24] The initial MC of the bulk corn was 14.0% (w.b.).
Measurements of temperature and relative humidity
Considering the distance between temperature sensors in the horizontal warehouses is generally between 1 and 3 meters and the storage capacity of the test house is small, 75 temperature measurement locations were arranged in the test house. The temperature of the bulk corn was monitored continuously every 0.5 h at 75 locations ( Vertical view) using the temperature sensors (MLG-II temperature sensor, Ming Lun Electronic Technology, Inc., Tianjin, Tex.; temperature accuracy±0.1%). The 75 locations were arranged in three horizontal sections, namely, H1, H2, and H3 ( Front view), in the bulk corn. The locations were evenly distributed in three horizontal sections, the sensors closest to wall were 0.4 m away from walls and 0.8 m between themselves ( Vertical view). The distance between two horizontal sections was 1.2 m ( Front view). Two temperature and relative humidity sensors (MLG-II temperature and humidity sensor, Ming Lun Electronic Technology, Inc., Tianjin, Tex.; temperature accuracy ±0.3%, humidity accuracy ±3.5%) were air and bin sensors. The air sensor was on the south wall to detect the air temperature and relative humidity (), and the bin sensor was in the air above the bulk corn surface in the test house to detect the bin temperature and relative humidity (). A data acquisition system (MLG digital type, Ming Lun Electronic Technology, Inc., Tianjin.) was connected to all the sensors used in the test () to collect the temperature and humidity data.
Figure 2. Cloud image sections and heights of the test house and bulk corn. Front view (a) and end view (a) show separately the three vertical sections, i.e., V1, V2, and V3, and three horizontal sections, i.e., H1, H2, and H3, in the bulk corn. (b) shows the locations of temperature sensors and bin sensor in the test house. Each solid circle indicates a temperature sensor location. (c) ■ is sampling points for detecting MC and fungal spores during the test
The data acquisition system uploaded these temperature and humidity data to the computer in the laboratory. These data could form cloud image after being processed by MATLAB.
Detection of fungi in the bulk corn
During the experiment, the mold degree of the bulk corn was evaluated by detecting the number of fungal spore. For spore counts, the procedure outlined in the SAG Standards[Citation25] was followed. Specifically, 10 g of corn was mixed with 30 mL of distilled water in a test tube, which was then shaken for 1 min to strip fungal spores from the corn. The liquid was then filtered through a 300 mesh cloth. The filtrate was placed on a hemocytometer and observed under a microscope to count the number of fungal spores. The initial fungal spore count of the bulk corn was determined to be 3 × 10⁴ g−1, which is proved good quality for stored bulk corn.[Citation25]
Analysis of the temperature cloud image
The temperature cloud image of three vertical sections, i.e., V1, V2, and V3, and three horizontal sections, i.e., H1, H2, and H3, were processed and analyzed with MATLAB. According to Yin’s research,[Citation26] the Newton interpolation method was used to reconstruct the temperature changes of these sections in the process of cloud image formation. To analyze temperature changes, high temperature zone areas in the six sections were calculated at different time. The main steps of this process were as follows: a picture of temperature cloud image was imported in MATLAB, and grayscale processing, binarization, and the area of high-temperature zone was calculated using the picture. Then, the area were treated as circles, and the radii of these circles were calculated as the equivalent radius (r).
Measurement of the volume of the high temperature space
The heat conduction in bulk corn is anisotropic. In order to simplify the calculation, the volume of the high-temperature zone was calculated as an ellipsoid with MATLAB. The equivalent radius of the H2 section was the length and width of the ellipsoid, and the equivalent radius of the V2 section was the height, so that the volume of the high-temperature zone at different times could be calculated.
Results and discussion
MC and mold change
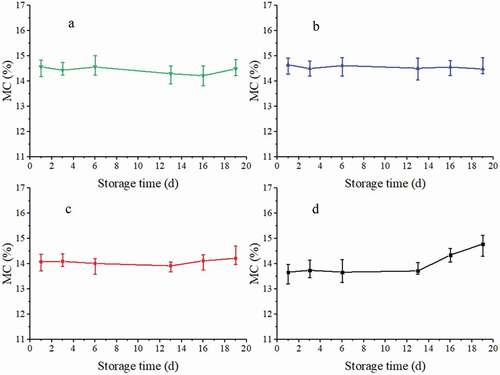
Water is a necessary factor for microbial growth.[Citation27] shows the variation of WC at four monitoring points A, B, C and D located at different layer heights of the bulk corn. It can be seen that during the test, the MC of the bulk corn of A, B and C changed little, but the MC of D at the top layer of the bulk corn increased significantly.
Figure 3. MC changes of the bulk corn at monitoring points A, B, C and D
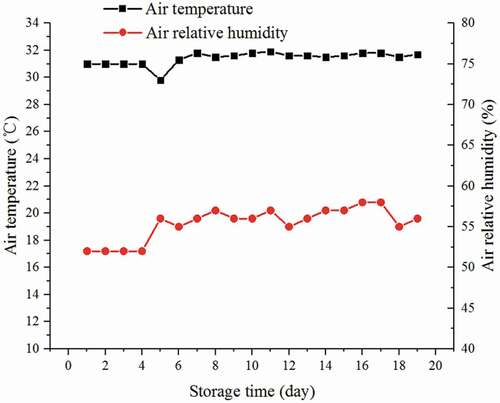
is the variation of fungal spore counts of points A, B, C and D at different layer heights of the bulk corn. According to SAG,[Citation25]1 × 10⁶ g-1 is the boundary between safety zone and mold risk zone. During the storage period, the growth of field fungi would be inhibited but storage fungi grows vigorously.[Citation12] It could be found from that fungus growth occurred in the bulk corn at B, C, D points. The growth cycle of fungi includes spore reproduction and mycelial growth.[Citation28] The spore counts of fungi at points B and C decreased, which may be that the storage fungi was in the period of massive mycelial growth. shows environmental temperature and relative humidity outside the test house. As can be seen from , the ambient temperature was basically maintained in the range of 31 to 32°C and the relative humidity was basically kept in the range of 53% to 58% during the bulk corn storage.
Figure 4. The changes of fungal spore counts of the bulk corn at monitoring points A, B, C and D
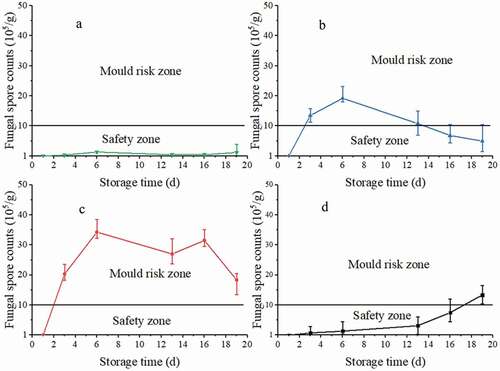
Figure 5. Air temperature and relative humidity outside the test house monitored by the air sensor in
Temperature change and heat transfer
show that the heat transferred in bulk corn with time. Based on the comprehensive analysis of the results obtained in , and the find no pests detecting in the samples from the high-temperature zone, a clearly demonstration was that microbiological heating occurred in the bulk corn. In the bulk corn, mold converted energy embedded in the grain (carbohydrates) into heat and produced water and CO2. Due to the heat released by the growth of storage fungi, the temperature in the central area of the bulk corn was higher than the temperature near the test house wall. Within the detection range of the sensor, the maximum temperature 47.5°C was located at (0.8, 2.6) and the minimum temperature 22.5°C was located in the area near the test house wall. The accumulation of heat in bulk would lead to the appearance of hot spots. Heat and water induced a self-accelerating heating process.[Citation29,Citation30]The initial hotspot was located in section V2 at 1.4 m bulk height. In the bulk corn, hot spot cause temperature differences, which are the energy sources of micro-airflow.[Citation31] The movement of micro-airflow and heat transfer caused moisture to move to the upper layer of the bulk corn.[Citation32] When heat and moisture reached a certain position, growth of microorganism could cause a new hot spot. As heat and moisture moved toward the upper layer, the hot spot in the bottom layers possibly declined due to a lack of oxygen. Every new hot spot occurrence would speed up the transfer of heat and moisture.
Figure 6. Temperature changes in the bulk corn in three vertical sections. (V1-a,V2-a,V3-a) storage for 1 day;(V1-b,V2-b,V3-b) storage for 11 days; (V1-c,V2-c,V3-c) storage for 19 days
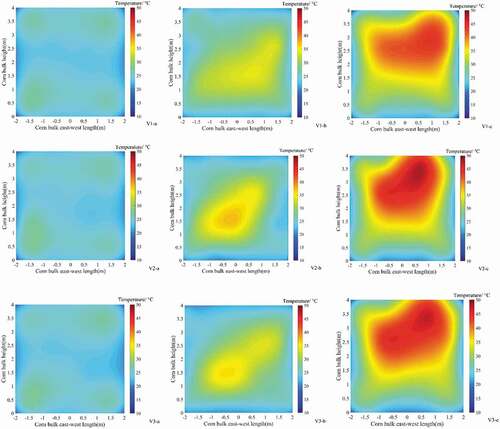
Figure 7. Temperature changes in the bulk corn in three horizontal sections. (H1-a,H2-a,H3-a) stored for 1 day;(H1-b,H2-b,H3-b) stored for 11 days; (H1-c,H2-c,H3-c) stored for 19 days. Section H1,1.4 m bulk height; Section H2, 2.6 m bulk height; Section H3, 3.8 m bulk height

When stored for 19 days, heat was transferred from the east side of the bulk corn, which might have been caused by the door. Stored grain inside a hot spot usually experiences rapid environmental changes related to factors, such as temperature, relative humidity, and gas. The development of hot spots consumes a high amount of oxygen and reduces the concentration of oxygen in the bulk corn. When sampling, the door would be open, and fresh air would enter and provide oxygen for mold growth.
High temperature zone change
In the test, the bulk corn temperature near the wall in the test house remained below 25°C. Therefore, the areas with a temperature over 25°C were set as the high-temperature zone areas in the six sections at different times. shows that the change trends of high-temperature zone areas in the three vertical sections were similar, while those of the three horizontal sections were not similar. The result reflects the anisotropy of the bulk grain. The stack effect could explain this phenomenon. Heat tranferred faster in the vertical direction than in the horizontal direction, which is in general agreement with the literature.[Citation33] The high-temperature zone area in section H1 began to decrease on the sixteenth day, and at the same time, the area of the high-temperature zone in section H3 increased. This might be due to the lack of oxygen in the lower bulk layer, which inhibited fungi growth.[Citation34] Then, the heat tranferred toward the higher-oxygen upper layer.
Figure 8. The areas change of high temperature zone in the three vertical sections and three horizontal sections

Temperature difference
where is the maximum temperature in one section, a,b are parameters to determine, and r is the equivalent radius of the high-temperature zone.
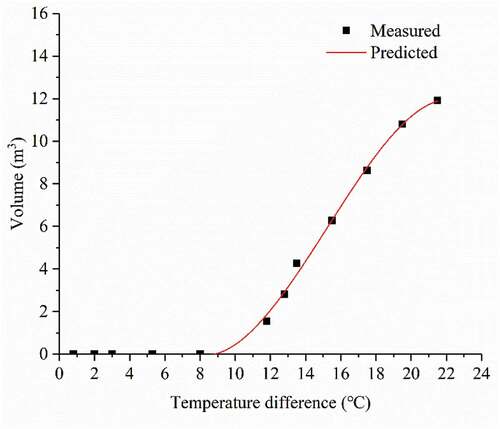
where a,b,c,d are parameters to determine; is the high-temperature zone volume.
shows the relationship between the equivalent radius (r) and the temperature difference in the six sections. In sections V1, V2, V3 and H1, H2, when the average reached approximately 8°C, that is, when the bulk corn maximum temperature reached approximately 33°C, heat tranfer was accelerated in bulk corn. However, in section H3, when
reached approximately 5°C, i.e., when the bulk corn maximum temperature reached approximately 30°C, heat tranfer was accelerated. In sections V1, V2, V3 and H2, the curve slope decreased with increasing r due to the movement of temperature and moisture to the bulk upper layer where microorganism grew fast. When the high-temperature areas began to increase, the equivalent radius (r) and
showed obvious linear relationships in the six sections ().
Table 1. Parameters in equation (2)
Table 2. Parameters in equation (3)
Figure 9. Relationship between the equivalent radius and temperature difference of high temperature zones in three vertical sections (section V1,V2,V3) and three horizontal sections (section H1,H2,H3). Predicted line was the fitting curve of equivalent radius rapidly rising

illustrates the volume change of the high-temperature zone with a temperature difference increase. When the average reached approximately 8°C, that is, when the bulk corn maximum temperature reached approximately 33°C, the volume of the high-temperature zone began to increase with the increase in the temperature difference. According to , when the maximum temperature reached a certain level (approximately 33°C in this study), the areas and volume began to increase rapidly. The temperature may be related to the thermal conductivity of grain bulk and fungal species. Therefore, it is necessary to control the temperature difference of the stored grain, especially at the center of the bin, so safe storage can be maintained.
Figure 10. Relationship between the high temperature zone volume and temperature difference. Predicted line was the fitting curve of equivalent radius rapidly rising
Conclusion
This study provides a new method for predicting the development of microbiological heating in grain storage. Using cloud image analysis can quickly show and predict the temperature change in the bulk corn. In the test house (4 m × 4 m × 7 m) with 30,000 kg corn, variation of WC and fungal spore counts in the bulk corn stated that fungi growth caused bulk corn heating. Under the action of microorganism, the center of bulk corn formed quickly high-temperature zone. Using MATLAB to analyze the cloud image, the following conclusions were found. The heat transfer distance (equivalent radius r) in the vertical and horizontal sections was a function of temperature difference , they showed an obvious linear relationship during high-temperature zone development. The volume of the high-temperature zone was a cubic polynomial function of temperature difference
. The research provides a new idea for grain storage, under the cloud image analysis, once the area or volume of a hotspot is found to grow rapidly in the bulk grain, ventilation should be prepared to low the grain temperature, which can retain the grain quality.
Author contributions
Experiment, Xiaomeng Wang; data curation, Xiaomeng Wang; writing—original draft preparation, Xiaomeng Wang; writing—review and editing, Xiaomeng Wang; supervision, Jianfang Shi; project
administration, Qizhen Xie and Xinqun Zhou; funding acquisition, Xinqun Zhou. All authors have read and agreed to the published version of the manuscript. The authors declare no conflict of interest.
Abbreviations
a,b,c,d determined parameters
MC bulk corn moisture content, %
r the equivalent radius of the high-temperature zone, m
temperature difference, °C
the maximum temperature in one section of bulk corn, °C
V volume of the high-temperature zone, m3
V1, V2, and V3 three vertical sections of bulk corn
H1, H2, and H3 three horizontal sections of bulk corn
Disclosure statement
No potential conflict of interest was reported by the author(s).
Additional information
Funding
References
- Chulze, S. N. Strategies to Reduce Mycotoxin Levels in Maize during Storage: A Review. Food Addit. Contam. Part A. 2010, 27(5), 651–657. DOI: https://doi.org/10.1080/19440040903573032.
- Suleiman, R.; Bern, C. J.; Brumm, T. J.; and Rosentrater, K. A. Impact of Moisture Content and Maize Weevils on Maize Quality during Hermetic and Non-hermetic Storage. J. Stored Prod. Res. 2018, 78, 1–10. DOI: https://doi.org/10.1016/j.jspr.2018.05.007.
- Hukill, W. V. Grain Cooling by Air. Agri. Eng. 1953, 34, 456–458.
- Zhang, S. B.; Zhai, H. C.; Huang, S. X.; Cai, J.-P. A Site-directed CO2 Detection Method for Monitoring the Spoilage of Stored Grains by Insects and Fungi in Chinese Horizontal Warehouses. J. Stored Prod. Res. 2014, 59, 146–151. DOI: https://doi.org/10.1016/j.jspr.2014.07.002.
- Jian, F.; Jayas, D. S. Understanding the Initiation and Development of Hotspots in Storage-grain Ecosystems. Appl. Zool. Res. 2014, 25(1), 01–10.
- Jian, F.; Chelladurai, V.; Jayas, D. S.; Demianyk, C. J.; White, N. D. G. Interstitial Concentrations of Carbon Dioxide and Oxygen in Stored Canola, Soybean, and Wheat Seeds under Various Conditions. J. Stored Prod. Res. 2014b, 57, 63–72. DOI: https://doi.org/10.1016/j.jspr.2013.12.002.
- Jian, F.; Digvir, S.; Jayas, D. S. How Many Kilograms of Grain per Sample Unit Is Big enough?Part II - Simulation of Sampling from Grain Mass with Different Insect Densities and Distribution Patterns. Stored Prod. Res. 2014c, 56, 67–80. DOI: https://doi.org/10.1016/j.jspr.2013.05.006.
- Sinha, R. N. Insects and Mites Associated with Hot Spots in Farm Stored Grain. Can. Entomol. 1961, 93(8), 609–621. DOI: https://doi.org/10.4039/Ent93609-8.
- Wallace, H. A. H.; Sinha, R. N. Fungi Associated with Hot Spots in Farm Stored Grain. Can. J. Plant Sci. 1962, 42(1), 130–141. DOI: https://doi.org/10.4141/cjps62-016.
- Christen, C. M. Deterioration of Stored Grains by Fungi. Botanical Rev. 1957, 23(2), 108–134. DOI: https://doi.org/10.1007/BF02930521.
- Jian, F.; Jayas, D. S.; White, D. N. G. Heat Production of Canola under Airtight and Non-airtight Storage Condition. Trans. ASABE. 2014a, 57, 1151–1162.
- Franzolin, M. R.; Gambale, W.; Cuero, R. G.; Correa, B. Interaction between Toxigenic Aspergillus Flavus Link and Mites (Tyrophagus Putrescentiae Schrank) on Maize Grains: Effect on Fungal Growth and Aflatoxin Production. J. Stored Prod. Res. 1999, 35(3), 215–224.
- Grundas, S. Advances in Agrophysical Research (New York: IntechOpen), 2013.
- Hammami, F.; Mabrouk, S. B.; Mami, A. Modelling and Simulation of Heat Exchange and Moisture Content in a Cereal Storage Silo. Math. Modelling Syst. 2016, 22(3), 207–220.
- Men, S.; Yan, L.; Liu, J. X.; Qian, H.; Luo, Q. A Classification Method for Seed Viability Assessment with Infrared Thermograph. Sensors. 2017, 17(4), 4.
- Gough, M. C.; Uiso, C. B.; Stigter, C. J. Air Convection Currents in Metal Silo Storing Maize Grain. Trop. Sci. 1990, 30(3), 217–222.
- Yin, J.; Wu, Z.; Zhang, Z., and Wu, X., Comparison and Analysis of Temperature Field Reappearance in Stored Grain of Different Warehouses. Trans. Chin. Soc. Agric. Eng. 2015, 31(1), 281–287 doi:https://doi.org/10.3969/j.issn.1002-6819.2015.01.037.
- Yin, J.; Wu, Z.; Zhang, Z., Wang, T.; Mao, Z. Analysis of the Formation Mechanism of Partial Condensation for the Stored Grain in Steel Squat Silo Based on Multi-fields Coupling Theory. J. Chin. Cereal. Oils Assoc. 2015, 30(5), 90–95.
- Alagusundaram, K.; Jayas, D. S.; White, N. D. G.; Muir, W.E. Finite Difference Model of Three-Dimensional Heat Transfer in Grain Bins. Can. Agric. Eng. 1990, 32, 315–321.
- Lawrence, J.; Maier, D. E.; Stroshine, R. L. Three-Dimensional Transient Heat, Mass, Momentum and Species Transfer in the Stored Grain Ecosystem:Part I. Model Development and Evaluation. Transactions of the ASABE. 2013, 56(1), 179–188. DOI: https://doi.org/10.13031/2013.42569.
- Thorpe, G. R. The Application of Computational Fluid Dynamics Codes to Simulate Heat and Moisture Transfer in Stored Grains. J. Stored Prod. Res. 2008, 44(1), 21–31. DOI: https://doi.org/10.1016/j.jspr.2007.07.001.
- Rusinek, R.; Kobyłka, R. Experimental Study and Discrete Element Method Modeling of Temperature Distributions in Rapeseed Stored in a Model Bin. J. Stored Prod. Res. 2014, 59, 254–259. DOI: https://doi.org/10.1016/j.jspr.2014.03.009.
- NFSRA. Maize GB 1353-2018, National Food and Strategic Reserves Administration; Beijing: China, 2018.
- ASABE. S352.2: Moisture Measurement Unground Grain and Seeds. 2009.
- SAG. Inspection of Grain and oils―Storage Fungus Examination, Enumeration of Spores of Fungi LS/T 6132–2018; State Administration of Grain: Beijing, China, 2018.
- Yin, J. Research on Multi-field Coupling Model of Wheat Grain and Condensation Prediction. PhD Thesis, Jilin University, Changchun, Jilin, China. 2015.
- Wang, R. Grain and oil storage (Beijing: China Light Industry Press) 2009.
- Fleurat-lessard, F. Stored Malting Barley: Management of Quality Using an Expert System; INRA Editions: Paris, 2001.
- Sinha, R. N.; Wallace, H. A. H. Ecology of a Fungi-induced Hot Spot in Stored Grain. Can. J. Plant Sci. 1965, 45(1), 48–59. DOI: https://doi.org/10.4141/cjps65-006.
- Sinha, R. N.; Wallace, H. A. H. Ecology of Insect-induced Hot Spots in Stored Grain in Western Canada. Res. Popul. Ecol. 1966, 8(2), 107–132. DOI: https://doi.org/10.1007/BF02518801.
- Jia, C.; Sun, D.; Cao, C. Mathematical Simulation of Temperature Fields in a Stored Grain Bin Due to Internal Heat Generation. J. Stored Prod. Res. 2000, 43, 227–233.
- Yin, J.; Wu, Z.; Zhang, Z. Wang , T.; Mao, Z. Analysis of the Formation Mechanism of Partial Condensation for the Stored Grain in Steel Squat Silo. 2015 ASABE Annual International Meeting, 26–29 July 2015, New Orleans, Louisiana, America, Paper Number: 152183562. 2015.
- Rashid, A. S.; Kurt, A. R. Measured and Predicted Temperature of Maize Grain (Zea Mays L.) Under Hermetic Storage Conditions. J. Stored Prod. Postharvest. Res. 2016, 7(1), 1–10.
- Wu, Z. Green Ecological Technology for Grain Storage; Beijing: China Science and Technology Press. 2011.