
 ?Mathematical formulae have been encoded as MathML and are displayed in this HTML version using MathJax in order to improve their display. Uncheck the box to turn MathJax off. This feature requires Javascript. Click on a formula to zoom.
ABSTRACT
The Amhara region of Ethiopia is endowed with honey of diverse varieties and qualities. However, there is a lack of information on its secondary metabolite content and antioxidant nature. For this study, 47 fresh honey samples were collected from seven administrative zones throughout three provinces in the Amhara National Regional State, Ethiopia. The honey samples’ restorative nature was evaluated by the quantitative determination of phenolic content and antioxidant capabilities using standard colorimetric methods. The finding showed that the mean values of total polyphenol content based on gallic acid equivalent (GAE) ranged from 17.03 to 42.04 mg GAE per 100 g of honey. The mean value of the entire flavonoid content using catechin equivalent (CE) was from 3.20 to 7.40 mg CE, and when using quercetin equivalent (QE), it ranged from 1.67 to 5.08 mg QE, per 100 g of honey sample. The ascorbic acid equivalent antioxidant content (AEAC) of the honey samples – ranged from 16.23 to 26.5 9 mg AEAC per 100 g of the honey samples. The percent antioxidant activities (% AA) of the honey samples—ranged from 23.74 to 40.11%. There was a strong positive correlation between phenolic content and antioxidant properties. Amber-colored honey enjoyed the highest value on the stated parameters based on the samples’ colors, while the white-colored samples registered the least value. Based on the findings, it is concluded that the region’s honey has a magnificent therapeutic nature. Using the principal component analysis (PCA) model, the top three principal components described 96.63% of the total variations. The linear discriminant analysis (LDA) model has an average of 68.1% discriminant power. The LDA model was cross-validated by the leave-one-out cross-validation approach, and 70.21% of it clustered adequately. In the biplot analysis, honey sample distribution based on their color clustered better than the geographic origin and climate factors.
Introduction
In addition to being one of the most conventional sweetening foods, honey has been used as a folk medicine for millennia.[Citation1,Citation2] Ancient Egyptians and the Greeks used honey to treat various health problems like stomach ulcers and skin wounds and strengthen the human immune system. Some of the chemicals in honey responsible for its medicinal properties are hydrogen peroxide, methylglyoxal, and phenolic molecules, with the acidic nature and high sugar content of honey. A general common term used to name the traditional curative use of honey and other bee products is said to be Apitherapy.[Citation3,Citation4] Different investigators believe that exogenous admissions of antioxidant substances through the diet can counterbalance the impact of oxidant materials such as the free radicals and diminishing oxidative stress. Honey is one of the natural bee products that contains a variety of polyphenol compounds that are beneficial to reducing oxidative stress by cleaning up or scavenging reactive molecules like free radicals.[Citation5,Citation6] Oxidative stress is an imbalance between the production of highly reactive molecules and antioxidant defenses. This condition can be the main cause of physical damage and malfunctioning of the biological molecules like lipids, nucleic acids, and proteins, leading to various disorders such as cancer, metabolic disorders, and cardiovascular dysfunction.[Citation7,Citation8]
The therapeutic nature of honey mainly comes from the polyphenol compounds present in it as one component.[Citation1,Citation9] Polyphenols are heterogeneous classes of chemical compounds categorized into flavonoids and phenolic acids.[Citation7,Citation10] These antioxidant compounds are often the products of secondary metabolites of plants and enter into honey by the action of the bee families (Apis mellifera) visiting those plants.[Citation11,Citation12] Thus, the amount and type of these antioxidant polyphenol components present in honey mainly depend on its floral source or botanical source. However, the diversity of vegetation (floral variety) where honey bees collect the nectar is directly related to the geographical origin having different ecological and climatic features (weather condition, soil type, rainfall, soil mineral content, and the like). Hence, honey with the same floral or botanical source but made at different geographical origins may differ in its chemical ingredients and vice versa.
Moreover, the processing action of honey production may also significantly contribute to the honey’s chemical composition.[Citation13,Citation14] Honey from different geographic origins can be distinguished using the chemical components present in it combined with chemometric statistical methods such as linear discriminant analysis and cluster analysis. Of course, the botanical origin has a major contribution to the classification of honey in the different regions.[Citation15–18] Hence, polyphenols in honey can be used as a tool for classification and confirmation or as chemical markers to identify honey’s botanical and geographical origins.[Citation19] These compounds also have strong kin to honey’s nutritional, medicinal, and market values.[Citation20]
In Ethiopia, over 7000 flowering plant species have been recorded, of which 12% or more are probably endemic, which can be taken as one of the best conducive situation for having peculiar honey production.[Citation21] In addition to this, Ethiopia is the largest honey producer in Africa and the 10th largest in the world, producing more than 45,300 metric tons per year,[Citation22] which accounts for approximately 21.7% of African honey production. Amhara region is one of the honey-producing areas in the nation.[Citation23,Citation24] Thus, the diversity of vegetation and its wide variety of ecological and climatic features are conducive to having a peculiar honey type. However, so far only one study[Citation25] has been reported for the phenolic content of honey from a single district of the Amhara region at a site different from the site of this study.
On the other hand, reports showed that flavonoids could be determined colorimetrically using AlCl3 reagent under acidic and basic conditions. Certain flavonoids such as quercetin, rutin, galangin react with the reagent aluminum chloride in acidic media and absorb at 425 nm. In contrast, others (such as rutin, luteolin, and catechin) react with the same reagent under basic media and absorb at 510 nm.[Citation26]
To the best of our knowledge, the antioxidant properties of the region’s honey, its total polyphenol, and flavonoid contents have never been studied in depth. Moreover, no research was conducted to determine the total flavonoid content in acidic and basic media applied to the same sample and quantify the various flavonoid families using multiple standards. Furthermore, no attempt has been made to characterize the regions’ honey chemometrically using data on phenolic and flavonoid content, as well as its antioxidant properties. Therefore, the present research aimed to quantify the total polyphenol content, flavonoids contents, and antioxidant activity of the region’s honey and cluster the honey samples based on its geographical origin chemometrically using the experimental data obtained on honey samples taken from the Amhara region, Ethiopia.
Materials and methods
Sampling and research site
Ethiopia is a country found in the horn of Africa. Based on the information from Ethio-GIS, Ethiopia’s geographical location is nearly 3–15°N latitude and 33–48°E longitude. Its altitude ranges from the highest peak at Ras-Dashan Mountain, 4620 m above sea level, down to the Dallol Depression, found at 148 m below sea level. The location of the Amhara region in Ethiopia is 8° 45ʹ00” – 13° 30ʹ00”N latitude and 35° 45ʹ00” – 40°30ʹ00”E longitude. Its elevation ranges from 489 m – 4620 m above sea level. Based on the information taken from the Ministry of Agriculture,[Citation27] the region has both the three agroecological climatic conditions. The cold and humid highland zones with altitudes ranging from 2,300 m to 3,200 m above sea level, with a mean annual rainfall of 1200–2200 mm, and average annual temperatures of 11.5–17.5°C. The midland areas have an altitude range of 1,500 m – 2,300 m above sea level, with a mean annual rainfall of 800–1,200 mm, and an average annual temperature of 17.5–20°C. While the lowland climatology, which is mostly warm and semiarid, is defined by an altitude less than 1,500 m above sea level, with an average annual rainfall of 200–800 mm, and a mean annual temperature of 20–27.5°C.
Forty-seven fresh honey samples were gathered from seven distinctive administrative zones found in three major districts (Gojjam, Gondar, and Wollo). The districts have huge potential in honey production for local and export markets in both agroecological climatic areas. The honey samples were obtained directly from local apiarists in October, November, and December 2019.
Pilot refinement (separation of debris, dead bees, and other strange materials) was done on the honey samples and was stored at 4 ± 0.5°C. Furthermore, in Ethiopia, honey is traditionally marketed based on its color (white, yellow, and amber) through visual observation and its geographical origin. lists the test samples according to their codes, geographic origins, sampling zone climate, and color of the honey sample.
Table 1. The honey samples based on their geographical origin, color, and climate of the sampling areas
Chemicals, reagents, and instruments
The major chemicals used in the study were as follows: Folin-Ciocalteu reagent, Ascorbic acid, Methanol, Gallic acid, Catechin, and Quercetin obtained (from Sigma–Aldrich Chemie, Steinheim, Germany), 2,2-diphenyl-1-picrylhydrazyl (DPPH)-extra pure (C18H12N5O6, M.Wt. 394.3 g/mol) (from Sisco Research Laboratories Pvt. Ltd Maharashtra, India), AlCl3 (from Fluka Goldie, Mumbai, India), Na2CO3 and NaOH (from BLULUX Laboratories, India), and NaNO2 (from Guangzhou Jinhuada Chemical Reagent), were purchased. UV–VIS spectrophotometer (Carry 60, Agilent Technologies) was used for measuring the absorbance of the prepared standards and samples. Throughout the experiment, deionized water was used for preparing solutions, rinsing, and diluting practice.
Antioxidant potential
Total polyphenol content (TPC)
The TPC of the honey samples was determined by the Folin-Ciocalteu reagent method.[Citation13,Citation28] Exactly 0.1 g/mL honey solution from each stored sample was prepared by dissolving it in distilled water. Then 1.5 mL of this solution was taken and mixed well with 1.5 mL of undiluted commercially available Folin-Ciocalteu reagent. After 5 min, 7.5 mL of 0.7 M Na2CO3 solution was added and incubated for about 2 hours in the dark at room temperature. The absorbance of the blue solution was taken by scanning the wavelength of the UV-VIS spectrophotometer against the reagent blank. Finally, the absorbance of each sample at 760 nm was selected and recorded to calculate the concentration of the total polyphenols. The sample blank was prepared from the same material except for the reagent, and the absorbance value was subtracted so that the pure target analyte absorbance was obtained. Standard solutions of gallic acid (1 mg/L up to 70 mg/L) were prepared and analyzed the same way as the sample to produce a calibration curve. Then the total polyphenol content was calculated and expressed in mg of gallic acid equivalents (GAE)/100 g of honey.
Total flavonoid content-catechin equivalent (TFC-CE)
Total flavonoid content using catechin standard was estimated using aluminum chloride colorimetric method in basic media.[Citation26,Citation29] Primarily, 0.1 g/mL of honey solution was prepared for each sample. Catechin standard solutions (from 0.05 mg/mL to 30 mg/mL) were also prepared through serial dilution from 150 mg/mL stock to generate calibration curve. Then, 2 mL (either sample or standard) solution was taken and mixed with 8 mL distilled water and 600 μL of 5%, NaNO2. To this mixture, 600 μL of 10%, AlCl3, and 4 mL of 1 M NaOH solution were introduced after 5 and 6 -minutes of waiting time consecutively. After a 10 minute incubation period, the solution was subjected to spectral analysis using UV–Vis spectrophotometer from 300–600 nm against the reagent blank prepared from all other materials except for the sample. The absorbance of a reagent blank was subtracted to obtain the net absorbance of the sample. This reagent blank was prepared from the same material used for the sample solution but using distilled water instead of the sample. Finally, the absorbance at 510 nm was taken, and total flavonoid content was calculated and expressed in mg of catechin equivalents (CE)/100 g of honey.
Total flavonoids content-quercetin equivalent (TFC-QE)
Similar to TFC-CE analysis, TFC-QE was determined based on the aluminum chloride colorimetric method but with a naturally acidic media.[Citation26,Citation30] 1 mL of 0.1 g/mL sample honey solution was mixed with 4 mL of distilled water followed by adding 5 mL of 2% AlCl3 in methanol and was mixed well. After a 10 minute incubation period, the solution was subjected to spectral analysis using UV-Vis spectrophotometer from 300 nm to 600 nm wavelength range against the reagent blank made from AlCl3, methanol, and distilled water. The absorbance of the sample blank prepared from the sample, methanol, and distilled water was taken and subtracted to have only the absorbance of the pure analyte. The calibration curve was generated from the absorbance of the quercetin standards (1 mg/mL up to 30 mg/mL) by the same approach. Finally, the peculiar absorbance of each sample at 425 nm was selected and recorded to calculate the concentration of total flavonoids. The total flavonoid content was then calculated and expressed in mg of quercetin equivalents (QE)/100 g of honey.
DPPH free radical-scavenging assay (% AA)
The radical scavenging activities of honey samples were measured using the free, stable radical 2,2-diphenyl-1-picrylhydrazyl (DPPH) scavenging assay as described in[Citation13,Citation30] with slight modifications. In this approach, exactly 0.1 g/mL honey solution was prepared from each honey sample. 0.08 mg/mL (0.2 mM) of DPPH standard reagent using methanol solvent was prepared. A prepared sample solution (0.5 mL), 2.5 mL of methanol, and 2.5 mL of the prepared DPPH solution were mixed. A control solution was prepared with the same chemicals but by replacing the honey sample with deionized water. After shaking and incubating for 15 minutes in the dark at room temperature, the sample, and control solution analysis was done using a UV-Vis spectrophotometer by scanning from 400 nm to 700 nm wavelength range against a reagent blank. Blank reagent solution was prepared with the same amount and type of ingredients used for the sample solution but by using deionized water in place of the DPPH reagent. Finally, the absorbance of the control and the sample solution, which is the absorbance of the unreacted DPPH at 517 nm wavelength, was selected and taken to determine the percentage of inhibition (% AA) as
where Ac is the absorbance of a control solution in methanol and As is the absorbance of sample solution (unreacted DPPH solution)
Ascorbic acid equivalent antioxidant capacity (AEAC)
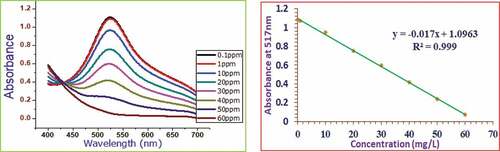
The ascorbic acid equivalent antioxidant assay of the honey sample was estimated as described in[Citation30,Citation31] with some modifications. Standard ascorbic acid solutions with concentrations of 0.1, 1, 10, 20, 30, 40, 50, and 60 (mg/L) were generated from a 100 mg/L stock ascorbic acid solution for this investigation. Then 0.5 mL ascorbic acid standards of various concentrations were mixed with 2.5 mL of methanol and 2.5 mL, 0.08 mg/mL of the prepared DPPH solution. Then after 15 minutes of incubation time at darkroom temperature, the solution was scanned using a UV-Vis spectrophotometer in the same way as for the % AA case. The specific absorbance of these solutions at 517 nm wavelength was selected to generate a calibration curve. It was also observed that the absorbance of the sample solution at 517 nm wavelength lies between the minimum and maximum absorbance of the solutions made by the ascorbic acid standard. The antioxidant content of the honey sample was calculated using the standard curves and reported as mg of ascorbic acid equivalent antioxidant content per 100 g of honey sample (mg AEAC/100 g honey sample).
Statistical data analysis
Triplicate measurements were employed for the experimental data gathering from each of the honey samples. The significant differences between the mean values of the obtained data for the antioxidant and the phenolic variables among the various administrative zones or provinces, the different colors of the sample, and the different climatic conditions of the sampling area were analyzed using one-way analysis of variance (ANOVA). Duncan’s multiple range test was also applied to see the significance in detail, and differences were considered significant at p < .05. In addition, the experimental data were analyzed employing multivariate analysis. Among these, principal component analyses (PCA) were applied to point out the dominant eigenvectors responsible for dimension reduction and degree of variations; see some pictures of sample trends that indicate groupings within the different origins.
Linear discriminant analysis (LDA) was also used to develop cluster models useful to assess the discriminatory features and predict the geographical origin of the region’s honey samples. Hierarchical cluster analysis (HCA) was used to observe natural groupings based on their dissimilarities or euclidian distance.[Citation16,Citation32,Citation33] The biplots were also applied to demonstrate the distribution of data and correlation between the variables. For these analyses, the software used were Stata SE-14, IBM SPSS statistics 21, Origin 8, and Microsoft Office Excel 2019. The different localities, the distinct ecological nature, and the honey sample’s various colors were independent variables, while the phenolic and antioxidant characters were taken as dependent variables.
Result and discussion
demonstrate the absorbance and calibration curves of the standard gallic acid, catechin, and quercetin polyphenols, respectively. Again, presents the calibration curve and the absorbance of unreacted DPPH after adding ascorbic acid standards at various concentrations. A good linear response over a concentration range of 1.00–70.00 mg/L for gallic acid, 0.05–30.00 mg/L for catechin, 0.10–30.00 mg/L for quercetin, and 0.10–60.00 mg/L for ascorbic acid standards were noted.
Figure 1. Absorbance and calibration curves of gallic acid standard.
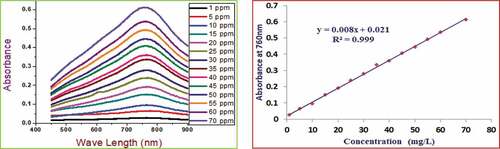
Figure 2. Absorbance and calibration curves of catechin standard.
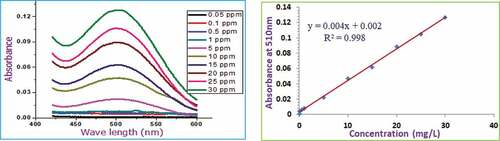
Figure 3. Absorbance and calibration curves of quercetin standard.
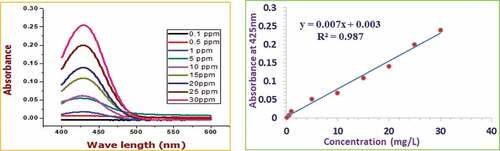
Figure 4. Absorbance of leftover DPPH and its calibration curve with the use of added ascorbic acid standard.
With these standard curves, total polyphenol content, total flavonoid content as catechin and quercetin equivalent, ascorbic acid equivalent antioxidant content, and the percentage of radical scavenging capacity for each honey sample was calculated. The obtained data were reported based on their geographic origin, ecological conditions of the sampling zone, and the visual colors of the samples. The percent inhibition or percent antioxidant activity (% AA) of the added ascorbic acid at various concentration levels used as a positive control for our sample absorbance was tabulated in .
Table 2. Percent inhibition of ascorbic acid standard at different concentrations on DPPH radical
Geographic origin of the sample
The ANOVA results and Duncan’s multiple range test of significance showed that significant variations were observed in the mean values of most of the variables among samples taken at various geographical areas at p < .05, as shown in . The analysis revealed that the highest total polyphenols were noted in a test from the West Gojjam Zone, 69.9 mg of GAE/100 g. The minimum concentration was obtained in a sample from Wag Himera Zone, 3.54 mg of GAE/100 g of a sample. The average value of the total polyphenol content also ranged from 17.03 ± 2.49 mg GAE/100 g to 42.04 ± 3.86 mg GAE/100 g honey (as mean ± SE). Most of the data in this research work agreed with the research data on honey obtained from Ethiopia, Burkina Faso, and India.[Citation25,Citation30,Citation34] However, the findings of total polyphenol content obtained in this study are greater than the results reported in studies from Poland, 7.2–20.3 mg GAE/100 g.[Citation35] It was also tremendously lower than the results reported in empirical studies done on honey samples taken from southern and western Ethiopia,[Citation21] between 330 and 604 mg GAE/100 g of the honey sample.
Table 3. Values of phenolic and antioxidant parameters at each administrative area
The amount of total flavonoid content expressed with catechin equivalent presented in showed us the total flavonoid that belongs to the catechin family ranging from 1.37 to 13.52 mg CE/100 g of the honey samples. The lower concentration was noted in the North Wollo Zone samples, and the higher levels were observed in the West Gojjam Zone samples. Taking the mean data of TFC-CE at each zone, 3.20 ± 0.18 mg CE/100 g of honey sample was obtained in the Wag Himera Zone samples and 7.40 ± 0.67 mg CE/100 g honey (as mean ± SE) in the samples from West Gojjam Zone. Similar findings were reported in research done on honey samples from Tunisian and Algerian.[Citation11,Citation31] However, significantly higher total flavonoid concentrations were reported in studies on honey samples obtained from southern and western Ethiopia, 18.0 to 42.2 mg C.E./100 g.[Citation21] Compared to the present study, the honey samples from Malaysia recorded slightly lower total flavonoid content; 1.15–2.53 mg CE/100 g were recorded.[Citation36]
The total flavonoid content as quercetin equivalent – ranged from 0.71 to 8.75 mg QE/100 g of the honey samples. The minimum was obtained from North Wollo Zone, and the maximum was from West Gojjam Zone. Again, the lower and the higher mean concentrations of quercetin equivalent total flavonoid were recorded in honey samples from Wag Himera 1.67 ± 0.24 mg QE/100 g and West Gojjam Zones (5.08 ± 0.57 mg QE/100 g) (as mean ± SE) respectively, as shown in . Comparable data were reported from honey samples collected in Burkina Faso and Iran,[Citation13,Citation30] whereas a higher concentration was reported from India (8.0–17.0 mg Q.E./100 g).[Citation34] On comparing these results with findings of a study on a honey sample from Turkey, we find that most of the total flavonoid content with quercetin standard is lower than the levels recorded in the present study (0.65 ± 0.42 to 1.65 ± 0.80 mg QE/100 g of honey samples). However, few values are comparable with the results of this study.[Citation3]
The percent antioxidant activity of the honey samples ranged from 19.57 to 52.78% in South Gondar and West Gojjam Zones. While the minimum mean value is noted in Wag Himera Zone, 23.74 ± 2.85%, and the maximum was 40.11 ± 3.39% in honey samples obtained from West Gojjam Zone, as presented in . Both equivalents, lower and higher values of the percent of antioxidant activity were observed in studies done on 60 various honey samples taken from Iran, from 11.7 ± 0.82% to 68.4 ± 14.7%.[Citation13] The results obtained from honey samples taken in southern and western Ethiopia were in the same range, from 23.0 ± 1.3 to 51.4 ± 2.6, except for a mean value that is slightly above this study’s results, which was 58.9 ± 2.5.[Citation21]
Regarding the ascorbic acid equivalent antioxidant content, the values ranged from 11.59 mgAEAC/100 g to 34.61 mgAEAC/100 g of the honey samples. In comparison, the minimum and maximum mean values were 16.23 ± 1.80 mg AEAC/100 g and 26.59 ± 2.15 mg/100 g of the honey samples in Wag Himera and West Gojjam Zones, respectively. The analysis on 27 honey samples taken from Burkina Faso resulted in both higher (28.7 ± 1.88–65.86 ± 0.1), comparable (16.34 ± 0.25 to 27.5 ± 0.65) and lower (10.2 ± 0.59 to 12.43 ± 0.16) mg AEAC/100 g honey values as compared to the findings of this study.[Citation30] In contrast, the results obtained from honey samples in other parts of Ethiopia were significantly higher than these research findings; it is from 72.7 ± 7.6 to 174.0 ± 9.0 mg AEAC/100 g honey.[Citation21]
In general, honey from West Gojjam Zone honey is prominent in its polyphenol, flavonoid, and antioxidant values. Honey from Awi Zone is the second-highest in both flavonoid and antioxidant parameters, but it ranks third in its TPC value. At the same time, honey samples from Wag Himera and North Wollo are the first and second least in their antioxidant properties, respectively. The honey samples from Wag Himera are mostly white, and the white-colored honey possesses less phenolic content and less antioxidant nature than the amber type.[Citation35] On the other hand, samples from East Gojjam, South Wollo, and South Gondar have almost comparable antioxidant properties.
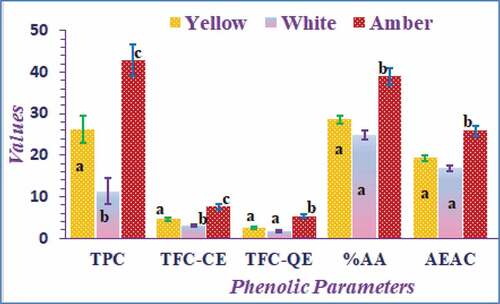
Color
The ANOVA result and Duncan’s multiple range test of significance showed that significant variations were observed in the mean values of most of the phenolic and antioxidant variables among the tests categorized in three distinct visual colors at p < .05, as shown in . From color points of view, amber-colored honey’s phenolic and antioxidant values were the highest, and the white-colored ones were the least. The discoveries of this research are in agreement with the reports on honey samples from Poland[Citation35] and India.[Citation34] We can also perceive that amber-colored honey has higher antioxidant activities than the other types of honey samples. The samples with higher polyphenol and flavonoid content show top antioxidant nature.
Figure 5. Average values (mean ± standard error) of the phenolic and antioxidant content based on the color of the honey sample. The means across a bar for the same parameter with different letters were signcificantly different (P < .05). Those indicated by the same letter are insignificant as determined by Duncan’s post hoc test.
Climate effects
The ANOVA result and Duncan’s multiple range test of significance revealed no significant variation in the average values for most of the antioxidant variables among the 47 honey samples categorized by the climate of the sample areas at p < .05. Significant variation was observed only for TPC and % AA values, as shown in .
Figure 6. Average values (mean ± standard error) of the phenolic and antioxidant content based on the climate of the sampling area. The means across a bar for the same parameter with different letters were significantly different (P < .05); while those indicated by the same letter are insignificant as determined by Duncan’s post hoc test.
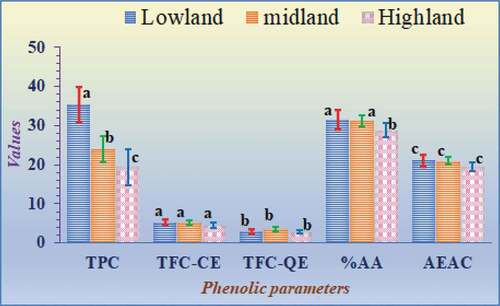
The investigation results revealed that honey samples from highland areas have lower total polyphenol content values than the honey samples taken from lowlands. The root cause for this might be related to the source of the honey. The reason is that the variety and availability of floral sources are highly accessible in lowlands during the honey production season than in highlands. On the other hand, in highlands, the accessible source that the bee family visits are essentially large trees with limited varieties or relatively similar species. The percent of antioxidant activity for the honey samples taken from the highland areas is lower than those of the honey samples taken from lowland and midland areas with similar differences in their antioxidant nature. However, we haven’t seen any significant variations in the mean values of other antioxidant and phenolic parameters (TFC and AEAC) among the different climatic zones of the research site.
Chemometric analysis
The suitability of the data for chemometric analysis such as principal component analysis (PCA) was checked using the Pearson correlation matrix and Kaiser–Meyer–Olkin (KMO) measure of sampling adequacy. Accordingly, the variables possess the highest positive correlation significant at the p-value of 0.01 levels, as shown in . The overall KMO measure of sampling adequacy value is 0.81, which is greater than the recommended value, i.e., 0.5, which confirms the sampling adequacy of the data set for PCA.
Table 4. Pearson correlation matrix on 47 honey samples × 5 variables
Principal component analysis (PCA)
The values of the five phenolic and antioxidant variables for the 47 honey samples laid open to an analysis of principal components to see the highest eigenvectors and the sample trends indicating groupings between different origins of honey samples. The PCA result showed that the first principal component (PC1) explained 81.27%, and the next principal component (PC2) explained 8.22%. In general, the first three principal components explained 96.63% of the total variation. Hence, the capability of PCA in dimension and complication reduction of a data matrix with only a few missing pieces of information was significant.
The score plot for the first two principal components () demonstrated that the PCA analysis visualizes certain sample trends that were indications of groupings within the different origins of the honey samples. Accordingly, most of the honey from Gojjam province is loaded in the positive direction of PC1 and the negative direction of PC2. On the other hand, most honey samples from Wollo province are associated with the negative direction of both PC1 and PC2. Though the pattern was not satisfactory, many of the Gondar honey samples were scattered around the origin of the two components.
Figure 7. Principal component analysis model constructed from the phenolic and antioxidant variables for the 47-honey sample. A. score plot B. loading plot.
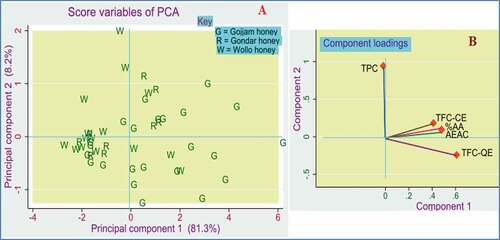
The discriminatory characteristics of the five phenolic parameters were also estimated from the PCA loading plot, as shown in obtained after orthogonal varimax rotation. From the plot, % AA, TFC-QE, TFC-CE, and AEAC dominate the positive direction of PC1, which was vastly connected to the Gojjam honey samples. At the same time, the variable TPC is positively correlated with PC2 related to a few honey samples from Wollo province.
Linear discriminant analysis (LDA)
We have seen fewer sample cluster trends in PCA, indicating the possibility of the sample’s geographical origin clustering. A more detailed clustering of samples was obtained using linear discriminant analysis (LDA). Thus, LDA was used to label the differences among the groups that we call discrimination and exploit those variations in assigning new observations to their proper clusters or groups, which is a prediction. For this purpose, group prior probabilities were contained in a matrix, and two discriminant function scores were computed to explain variations. The first discriminant score function, highly influenced by the Gojjam honey to its negative side and Wollo honey to its positive side, explained 89.2% of the total variation. The second discriminant function scores, which were mainly influenced by honey in Gondar province and partly by the Gojjam and Wollo honey, explained 10.8% of the variation. These two discriminant score functions explained the whole percent of the variation ().
Figure 8. Scatterplot for linear discriminant analysis model using phenolic and antioxidant parameters on forty-seven honey samples.
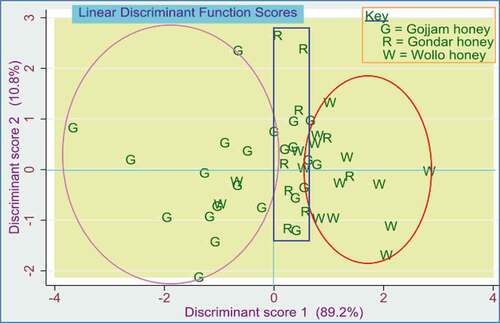
In this LDA model, most Gojjam honey distributed between −3.4 and 0.3 in discriminant function score one and −2.0 to 2.5 in discriminant function score two. Furthermore, most of the Wollo honey samples were placed between 0.8 and 3.0 in discriminant function score one and −1.6 to 1.5 in discriminant function score two. In contrast, the Gondar honey samples were between −1.4 to 2.8 in discriminant function score two and near the origin in discriminant function score one. Using discriminant numerical data, which linked honey samples from each province to discriminant function scores, new observations can be assigned to either cluster
If we see the discrimination potential of the LDA model, it was observed that 78.3% of the total group in Gojjam honey discriminates correctly. Four of the Gojjam province honey samples were miscategorized in Wollo and one in Gondar provinces wrongly. The discrimination of the honey samples from Wollo provinces was also good; 73.3% of the samples were properly discriminated, but four samples were misclassified- 3 to Gojjam and 1 to Gondar provinces. On the other hand, the discrimination power of the model for honey samples originating from Gondar provinces was not encouraging; only 33.33% was precisely discriminated, as can be seen in . In general, the overall average discrimination power of this LDA model was about 68.1%. The validation of the LDA model was checked by the leave-one-out cross-validation method, and it was found that 70.21% of cross-validated groups of samples were correctly classified.
Table 5. LDA classification result of the honey sample using 5 phenolic and antioxidant parameters under 3 geographic origins
Biplot analysis
In the biplots of , B, and C, the explained variance by dimension 1 is 81.3%, and dimension 2 is 8.2%. Hence these components together explained 89.5% of the entire variance. Furthermore, depending on the cosine value, the angles between projection arrows of the variables approximated the correlation among the variables. Therefore, as small angles operate larger cosine value and the larger the cosine value is, the higher the correlation between the variables, a relatively smaller correlation existed between TPC and TFC-QE. At the same time, % AA with AEAC possessed maximum correlation, and TFC-CE demonstrated a higher correlation with % AA and AEAC and even with TFC-QE. These relations can be confirmed in the Pearson correlation matrix numerical values listed in .
Figure 9. Biplots of the phenolic and antioxidant Variables with data observations based on; A = Geographic origins, B = color of the honey sample, C = climatic conditions of the sampling area.
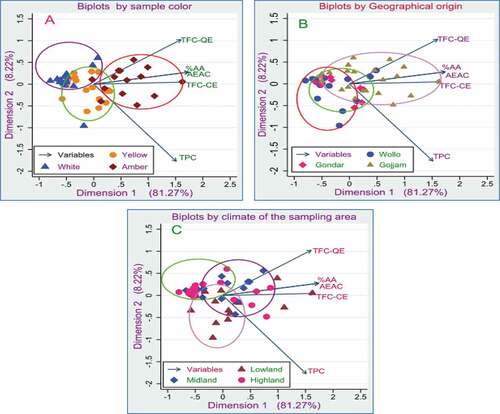
On the other hand, if we see the distribution of the observed data in the biplot, the honey samples seem to form a better cluster by their color than by the climate of the sample area and geographic origins. As shown in , most white-colored honeys set themselves almost at about −0.5 in dimension one and from 0.0–0.5 in dimension two. Amber honey type is distributed at the right of dimension one between 0 and 1.5 and left of dimension two between −0.5 and 0.5. The yellow color was once found in between the two, almost closer to the origins. Furthermore, in examining the samples by the climate of the sampling area, most lowland honey samples seem to form clusters at the bottom of dimension two and between −0.5 to 1.5 in dimension one. In contrast, most highland honey samples form an assembly almost at about −0.5 of dimension one and slightly above 0 of dimension two (). Nevertheless, the distribution of observations by the samples’ geographic origins seems mixed and to be uneven except for the Gojjam honey samples, which seem to be clustered beyond 0 in dimension one and around the origin in dimension two ().
Hierarchical cluster analysis (HCA)
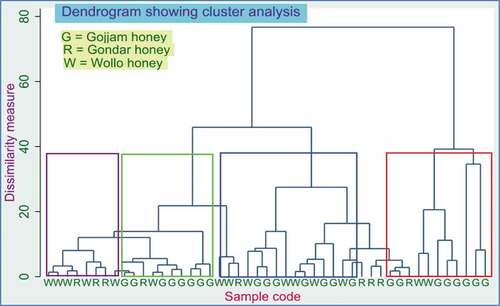
In this analysis method, the dendrogram was used as a tool to display natural clustering based on euclidean distances or similarity ratios. Even though the overall cluster formation at the dendrogram in is not charming, the first group enclosed by a violet rectangle holds samples of the largest member collected from Wollo provinces. The second category, bounded by a bright green rectangle, and the last category bounded by the red rectangle, embraces many samples originating from Gojjam provinces. The former was chiefly from the West and East Gojjam Zones, while the latter was mainly from Awi Zone. However, the inner cluster surrounded by a blue rectangle contained honey samples originating from all three provinces. The ultimate reason for such intermixed cluster formation may come from a similar environment (latitude, climate, and probably their soil composition and nature) as the sampling area borders several zones and provinces.
Figure 10. Hierarchical cluster analysis showed by dendrogram for the 47 honey samples using phenolic and antioxidant parameters.
Conclusion
The present research work assesses the total polyphenol and flavonoid content with antioxidant properties using internationally accepted standard colorimetric techniques. Forty-seven samples of honey were taken from seven local administrative zones found in three provinces of the Amhara national, regional state. Substantial phenolic and flavonoid content and promising antioxidant nature were observed, indicating that the region’s honey has excellent therapeutic nature and good nutritional value. Significant variations in their mean values of the phenolic content and antioxidant values were documented in categorizing the honey samples based on the sample color and geographical origin. However, the climatic effect of the sampling area did not produce satisfactory variations in the mean values of the samples. Hence among the honey samples taken from each administrative zone, those from West Gojjam Zone are the richest honey in both classes of phenolic molecules and their antioxidant nature. In contrast, honey samples from Wag Himera Zone have recorded the least values. Another important observation that we made in the present research work was that the total content of TPC, TFC-CE, TFC-QE, % AA, and AEAC values are in the order of amber-colored > yellow-colored > white-colored honey samples. Moreover, with these phenolic and antioxidant parameters, the PCA plays an interesting role in dimension reduction and indicates sample trends. At the same time, the LDA model mainly clusters the honey samples into three categories. In addition, the honey samples seem to form a better cluster in a biplot built by the color than by the climate of the sample area and geographic origins. The formation of the natural groupings using HCA is unsatisfactory, perhaps due to the similar agroecological environment of the sampling areas as these areas border several administrative zones.
Acknowledgments
The authors would like to thank Science College, Bahir Dar University, Ethiopia. Mr. Marie Yayinie is grateful to Debre Tabor University, Ethiopia, for sponsoring his Ph.D. study. The authors declare that they have no conflict of interest
Disclosure statement
No potential conflict of interest was reported by the author(s).
Additional information
Funding
References
- Cheung, Y.; Meenu, M.; Yu, X.; Xu, B. Phenolic Acids and Flavonoids Profiles of Commercial Honey from Different Floral Sources and Geographic Sources. Int. J. Food Prop. 2019, 22(1), 290–308. DOI: 10.1080/10942912.2019.1579835.
- Ghosh, S.; Playford, R. Bioactive Natural Compounds for the Treatment of Gastrointestinal Disorders. J Clin. sci. 2003, 104(6), 547–556. DOI: 10.1042/CS20030067.
- Can, Z.; Yildiz, O.; Sahin, H.; Turumtay, E. A.; Silici, S.; Kolayli, S. An Investigation of Turkish Honeys: Their Physico-chemical Properties, Antioxidant Capacities and Phenolic Profiles. Food Chem. 2015, 180, 133–141. DOI: 10.1016/j.foodchem.2015.02.024.
- Karasawa, K.; Haraya, S.; Okubo, S.; Arakawa, H. Novel Assay of Antibacterial Components in Manuka Honey Using lucigenin-chemiluminescence-HPLC. Anal. Chim. Acta. 2017, 954, 151–158. DOI: 10.1016/j.aca.2016.12.004.
- Meo, S. A.; Al-Asiri, S. A.; Mahesar, A. L.; Ansari, M. J. Role of Honey in Modern Medicine. Saudi J. Biol. Sci. 2017, 24(5), 975–978. DOI: 10.1016/j.sjbs.2016.12.010.
- Pasupuleti, V. R.; Arigela, C. S. Polyphenols and Flavonoids from Honey: A Special Focus on Diabetes, in Natural Materials and Products from Insects: Chemistry and Applications; Springer, 2020; pp 1–20. https://doi.org/10.1007/978-3-030-36610-0_1
- Cianciosi, D.; Forbes-Hernández, T. Y.; Afrin, S.; Gasparrini, M.; Reboredo-Rodriguez, P.; Manna, P. P.; Zhang, J.; Bravo Lamas, L.; Martínez Flórez, S.; Agudo Toyos, P. Phenolic Compounds in Honey and Their Associated Health Benefits: A Review. Molecules. 2018, 23(9), 2322. DOI: 10.3390/molecules23092322.
- Droge, W. Free Radicals in the Physiological Control of Cell Function. Physiol. Rev. 2002, 82(1), 47–95. DOI: 10.1152/physrev.00018.2001.
- Eteraf-Oskouei, T.; Najafi, M. Traditional and Modern Uses of Natural Honey in Human Diseases: A Review. Iran. J. Basic Med. Sci. 2013, 16(6), 731.
- Campone, L.; Piccinelli, A. L.; Pagano, I.; Carabetta, S.; Di Sanzo, R.; Russo, M.; Rastrelli, L. Determination of Phenolic Compounds in Honey Using Dispersive Liquid–liquid Microextraction. J. Chromatogr. A. 2014, 1334, 9–15. DOI: 10.1016/j.chroma.2014.01.081.
- Boussaid, A.; Chouaibi, M.; Rezig, L.; Hellal, R.; Donsì, F.; Ferrari, G.; Hamdi, S. Physicochemical and Bioactive Properties of Six Honey Samples from Various Floral Origins from Tunisia. Arabian J. Chem. 2018, 11(2), 265–274. DOI: 10.1016/j.arabjc.2014.08.011.
- Pyrzynska, K.; Biesaga, M. Analysis of Phenolic Acids and Flavonoids in Honey. TrAC Trends Anal. Chem. 2009, 28(7), 893–902. DOI: 10.1016/j.trac.2009.03.015.
- Akbari, E.; Baigbabaei, A.; Shahidi, M. Determination of the Floral Origin of Honey Based on Its Phenolic Profile and Physicochemical Properties Coupled with Chemometrics. Int. J. Food Prop. 2020, 23(1), 506–519. DOI: 10.1080/10942912.2020.1740249.
- Corbella, E.; Cozzolino, D., Technology. Classification of the Floral Origin of Uruguayan Honeys by Chemical and Physical Characteristics Combined with Chemometrics. LWT-Food ScI. 2006, 39(5), 534–539.
- In ; Eds., .Sogut E.; Seydim A.C. Classification of honeys collected from different regions of Anatolia by chemometric methods. Journal of Food Processing and Preservation, 44(12), e14960. DOI: 10.1111/jfpp.14960
- Mehari, B.; Redi-Abshiro, M.; Chandravanshi, B. S.; Combrinck, S.; Atlabachew, M.; McCrindle, R., Analysis. Profiling of Phenolic Compounds Using UPLC–MS for Determining the Geographical Origin of Green Coffee Beans from Ethiopia. J. Food Compos. 2016, 45, 16–25. DOI: 10.1016/j.jfca.2015.09.006.
- Ruoff, K.; Bogdanov, S. Authenticity of Honey and Other Bee Products. Apiacta. 2004, 38(38), 317–327.
- Soares, S.; Amaral, J. S.; Oliveira, M. B. P. A.; Mafra, I. A Comprehensive Review on the Main Honey Authentication Issues: Production and Origin. Compr. Rev. Food Sci. Food Saf. 2017, 16(5), 1072–1100. DOI: 10.1111/1541-4337.12278.
- Karabagias, I. K.; Vavoura, M. V.; Nikolaou, C.; Badeka, A. V.; Kontakos, S.; Kontominas, M. G. Floral Authentication of Greek Unifloral Honeys Based on the Combination of Phenolic Compounds, Physicochemical Parameters and Chemometrics. Food Res. Int. 2014, 62, 753–760. DOI: 10.1016/j.foodres.2014.04.015.
- Kuś, P. M.; Jerković, I. New Sample Preparation Method for Honey Volatiles Fingerprinting Based on Dehydration Homogeneous Liquid–Liquid Extraction (DHLLE). Molecules. 2018, 23(7), 1769. DOI: 10.3390/molecules23071769.
- Sime, D.; Atlabachew, M.; Abshiro, M.; Zewde, T. Total Phenols and Antioxidant Activities of Natural Honeys and Propolis Collected from Different Geographical Regions of Ethiopia. Bull. Chem. Soc. Ethiopia. 2015, 29(2), 163–172. DOI: 10.4314/bcse.v29i2.1.
- Teklit, G.; Frehiwot, M. Phytochemical and Biochemical Composition of Wild Honey: A Case Study in Eastern Zone Areas in Tigray Ethiopia. J. Nutri. Health Food Eng. 2016, 4(4), 141–146.
- Alemu, T.; Seifu, E.; Bezabih, A. Physicochemical Properties of Honey Produced in Sekota District, Northern Ethiopia. Int. Food Res. J. 2013, 20(6), 3061.
- Getachew, A.; Gizaw, H.; Assefa, D.; Tajebe, Z. Physico-chemical Properties of Honey Produced in Masha, Gesha, and Sheko Districts in Southwestern Ethiopia. Curr. Res. Agric. Sci. 2014, 1(4), 110–116.
- Liben, T.; Atlabachew, M.; Abebe, A. Total Phenolic, Flavonoids and Some Selected Metal Content in Honey and Propolis Samples from South Wolo Zone, Amhara Region, Ethiopia. Cogent Food Agric. 2018, 4(1), 1475925. DOI: 10.1080/23311932.2018.1475925.
- Pękal, A.; Pyrzynska, K. Evaluation of Aluminium Complexation Reaction for Flavonoid Content Assay. Food Anal. Methods. 2014, 7(9), 1776–1782. DOI: 10.1007/s12161-014-9814-x.
- MoA. Ministry of Agriculture (Moa), Agroecological Zones of Ethiopia. In Natural Resources Management & Regulatory Department MoA; AA Ministry of Agriculture (MoA) http://197.156.72.153:8080/xmlui/bitstream/handle/123456789/2517/AGRO-ECOLOGICALZONES%20OF%20ETHIOPIA.pdfABBYYY.pdf?sequence=1&isAllowed=y : Ethiopia, Editor, 1998,1-136
- Singleton, V. L.; Orthofer, R.; Lamuela-Raventós, R. M. 14 Analysis of Total Phenols and Other Oxidation Substrates and Antioxidants by Means of Folin-ciocalteu Reagent. Methods Enzymol. 1999, 299, 152–178.
- Kim, D. O.; Jeong, S. W.; Lee, C. Y. Antioxidant Capacity of Phenolic Phytochemicals from Various Cultivars of Plums. Food Chem. 2003, 81(3), 321–326. DOI: 10.1016/S0308-8146(02)00423-5.
- Meda, A.; Lamien, C. E.; Romito, M.; Millogo, J.; Nacoulma, O. G. Determination of the Total Phenolic, Flavonoid and Proline Contents in Burkina Fasan Honey, as Well as Their Radical Scavenging Activity. Food Chem. 2005, 91(3), 571–577. DOI: 10.1016/j.foodchem.2004.10.006.
- Khalil, M.; Moniruzzaman, M.; Boukraâ, L.; Benhanifia, M.; Islam, M.; Sulaiman, S. A.; Gan, S. H.; Gan, S. H. Physicochemical and Antioxidant Properties of Algerian Honey. Molecules. 2012, 17(9), 11199–11215. DOI: 10.3390/molecules170911199.
- Magdas, D. A.; Guyon, F.; Puscas, R.; Vigouroux, A.; Gaillard, L.; Dehelean, A.; Feher, I.; Cristea, G. Applications of Emerging Stable Isotopes and Elemental Markers for Geographical and Varietal Recognition of Romanian and French Honeys. J Food Chem. 2021, 334, 127599. Doi:10.1016/j.foodchem.2020.127599.
- Yayinie, M.; Atlabachew, M.; Tesfaye, A.; Hilluf, W.; Reta, C. Quality Authentication and Geographical Origin Classification of Honey of Amhara Region, Ethiopia Based on Physicochemical Parameters. Arabian J. Chem. 2021, 14(3), 102987. DOI: 10.1016/j.arabjc.2021.102987.
- Nayik, G. A.; Nanda, V. A Chemometric Approach to Evaluate the Phenolic Compounds, Antioxidant Activity and Mineral Content of Different Unifloral Honey Types from Kashmir, India. LWT - Food Sci. Technol. 2016, 74, 504–513. DOI: 10.1016/j.lwt.2016.08.016.
- Kaškonienė, V.; Maruska, A.; Kornysova, O.; Buszewski, B. Quantitative and Qualitative Determination of Phenolic Compounds in Honey. Cheminė Technologija. 2009, 52(3), 74–80.
- Khalil, M.; Alam, N.; Moniruzzaman, M.; Sulaiman, S.; Gan, S. Phenolic Acid Composition and Antioxidant Properties of Malaysian Honeys. J. Food Sci. 2011, 76(6), C921–C928. DOI: 10.1111/j.1750-3841.2011.02282.x.