
ABSTRACT
The cell wall is a non-starch polysaccharide and consists of various bioactive moieties. In addition, it has many functional and nutraceutical properties. The main purpose of this present research was to extract the cell wall from different cereal bran and to characterize it for nutritional and bioactive properties. In addition, the effects of the cereal bran cell wall (CBCW) on functional and rheological properties of wheat flour were elucidated. For this purpose, the cell wall was extracted from different cereal bran (maize, oat, and wheat) via an enzymatic method and characterized for its monosaccharides and phenolic acids contents. Additionally, the rheological properties of wheat flour with the addition of CBCW were determined using the farinograph and mixograph. The results showed that the cell wall contents in oat bran (43.31 ± 1.41%) were higher than those in wheat (41.53 ± 0.09%) and maize bran cell walls (37.31 ± 1.05%). The maize bran cell wall has higher arabinose, xylose, galactose, and glucuronic acid contents, followed by oat and wheat bran cell walls. Furthermore, the oat bran cell wall contained higher total phenolic acid contents as compared to maize and wheat bran. Nevertheless, the ferulic acid content was high in the maize bran cell wall. Moreover, incorporation (2%) of CBCW significantly improved the rheological properties of wheat flour. The water absorption (66.04 ± 0.23%), dough stability (4.54 ± 0.6 min), peak height (66.02 ± 0.03BU), and mixing tolerance index (70.02 ± 0.07%) were high in wheat flour with the addition of oat bran cell walls followed by wheat and maize bran cell walls. Furthermore, the dough development time (6.75 ± 0.25 min) was the highest in the control sample and the lowest mixing time was observed in C4 (5.41 ± 0.12 min), while the softness of dough (139.4 ± 0.02%) was decreased more significantly through the oat cell wall than wheat and maize. Conclusively, CBCW contained different bioactive moieties that have numerous positive effects on the rheological and functional properties of wheat flour.
INTRODUCTION
Cereal bran is a milling by-product of cereal, composed of the aleurone layer, testa, pericarp, and germ. The content of bran in a dried kernel depends on the source of cereals and varies from 5% to 30%.[1] Bran is a part of cereal kernel containing a high content of phenolics and cell wall material.[Citation2] The cereal’s cell wall consists of an innovative multifunctional structure with a high nutritional profile.[Citation3] Cell wall polysaccharides are non-starch polysaccharides that constitute a significant part of cereal bran.[Citation1]
The cereal bran cell wall (CBCW) has a high concentration of bioactive compounds such as dietary fiber, antioxidants, non-starch polysaccharides (arabinoxylans), and phenolic acids (ferulic and di-ferulic acids).[Citation1,Citation4] CBCW has various functional properties such as antimicrobial, antioxidant, anti-inflammatory, antiaging, anticancer, cholesterol-lowering, and cardioprotective properties.[Citation5] Polyphenols and cell wall non-starch polysaccharides are major functional nutrients responsible for disease prevention.[Citation6] The non-starch polysaccharides are unique moieties of pharmaceutical and herbal medicine.[Citation7] CBCW phenolic compounds also act as an antimicrobial agent and are used to increase the final product’s shelf life. They can avoid fatty acid peroxidation; therefore, they are used as biological preservatives in various food products.[Citation8] The phenolic acids in the CBCW structure form cross-linkages with polysaccharides which are responsible for the insolubility of dietary fibers, the gelling properties of heteroxylans, and their indigestibility. Non-starch polysaccharides also act as stabilizing and thickening agents due to their high viscous and water-holding capacity.[Citation9]
The addition of a high amount of cereal bran into flour generally caused negative effects on the qualitative characteristics of end-product quality.[Citation10] In addition, the cell wall non-starch polysaccharide consists of an innovative multifunctional structure. Furthermore, previous research studies showed that the cell wall improved the functional, rheological, and end-use properties of food products. Tufail et al.[Citation2] reported that the cereal bran cell wall improves the rheological characteristics of bread grade flour during processing. Hence, cereal bran cell walls should be extracted and characterized for their rheological, nutritional, and end-use perspectives. In the present research work, the cell wall was extracted from cereal bran (wheat, maize, and oat) and characterized for its bioactive moieties especially phenolic acids. Then CBCW was added into the flour to evaluate its rheological and functional properties.
Materials and methods
Procurement of raw material
Maize bran (Buffalo MB 135000) was purchased from Rafhan Maize Product Co Ltd. Wheat bran (Gold-16) and oat bran (Sargodha-81) were procured from Ayub Agriculture Research Institute Faisalabad, Pakistan. Thermostable α-amylase, protease, and amyloglucosidase were procured from Megazyme (K-TDFR-100A, Bray Business Park Bray, Co. Wicklow A98 YV29, Ireland). All the other chemicals were of analytical grade and purchased from commercial sources.
Extraction of cereal bran cell wall (CBCW)
Enzymatic method
The cell wall of different cereal bran was isolated by following the methods of Tufail et al.[Citation2] and Gartaula et al.[Citation11] with some modifications. Cereal bran samples (100 g) were defatted by using Soxhlet apparatus and mixed in 1-liter deionized water in a two-liter beaker on a stir hot plate at 40°C for 1 h at 600 rpm. The samples were centrifuged at 4000 g for 15 min and the supernatant was discarded. To remove the undesirable portions of bran, residues were wet-sieved through sieves of a 250 µm. Then, the residues were mixed thoroughly in 40 ml/g phosphate-buffered saline to ensure no clumps. The enzymatic treatments were performed by following the method of Gartaula et al.,[Citation11] and two different temperatures such as 70°C (to gelatinize the starch and maximize enzyme activity) and 37°C (human physiological temperature) were used.
Briefly, the slurry was heated to 70°C on a hot plate for 60 min to gelatinize the starch and denature the protein. Fifty microliter of thermostable α-amylase was added to the sample and incubated at 90°C. Then the samples were screened for the absence of starch using the iodine test. The next step was the addition of protease (60 U/g) and amyloglucosidase (100 U/g) enzymes to hydrolyze proteins and starch, respectively. The samples were incubated for 4 h at 60°C. Sodium azide (0.02%) was added to prevent microbial spoilage. Iodine solution was used to determine the degree of starch and protein digestion. Onemilliliter of the sample was centrifuged with both residues, and a few drops of iodine solution were added to the collected supernatant. The blue color indicates the presence of starch. Digestion was completed at higher extraction temperatures for 7 h followed by a second incubation at 37°C for 48 h. The mixture was cooled at room temperature under running water and wet sieved through a 20-micron screen to remove the smallest particles. The non-digestible cell wall remained on the screen and was centrifuged at 3200 g for 10 min. The residues were washed twice with 70% ethanol and acetone, followed by air drying at room temperature. Pure CBCW residues were freeze-dried and converted into powder form. The cell wall extraction process is explained in .
Figure 1. Cell wall extraction.
Natural sugars assay
Monosaccharides from CBCW were determined by a gas chromatographic-mass spectrophotometer (GC-MS). Briefly, the residue was acid hydrolyzed with 75% sulfuric acid and the resulting monosaccharides were converted to alditol acetates as described by Pettolino et al.[Citation12] A GC-MS equipped with a flame ionization detector (Agilent 6890) was used to analyze the monosaccharide content.
Total phenolics
The total phenolic contents were alkaline extracted from CBCW using the modified method of Waldron et al.[Citation13] Different phenolic acids such as ferulic acid, diferulic acid, and p-coumaric acid were analyzed with a Perkin Elmer 200 series HPLC equipped with a UV visible detector. The chromatographic separation was carried out on the reverse phase C18 column.
Addition of CBCW in wheat flour
The cereal bran (wheat, maize, and oat) cell wall was added with concentrations of 1% and 2% in wheat flour to develop cereal bran cell wall-enriched flour ().
Table 1. Treatment plan
Water-holding capacity of CBCW-enriched flour
The water-holding capacity (WHC) of samples was evaluated according to the procedure of Hussain et al.[Citation14] Approximately 1 g of sample was weighed and mixed with 10 ml of distilled water in a 30 ml centrifuge tube. Then the flour sample was stirred by using a vortex mixer, and after 40 min at room temperature, the sample was centrifuged (10,000 rpm for 10 min). The excess water was drained, and the sediment was weighed to calculate WHC as g water retained per g of dry matter.
Farinographic analysis of CBCW-enriched flour
The farinographic characteristics of wheat flour with CBCW treatments C0, C1, C2, C3, C4, C5, and C6 were investigated through farinograph by the AACC (2000) method.[Citation14]
Mixographic characteristics
The mixing properties of different blends of wheat flour with CBCW treatments C0, C1, C2, C3, C4, C5, and C6 were measured through mixograph by the AACC (2000) method.[Citation15]
Statistical analysis
Statistical analysis of data was carried out using SPSS statistics 21. The results were expressed as mean ± SD, and one-way analysis of variance (ANOVA) using Duncan’s multiple range test was performed for comparative analysis.
Results and discussion
CBCW content
The cell wall contents extracted from different cereal bran are summarized in . The highest cell wall content (43.31 ± 1.41) was present in oat, whereas both wheat and maize showed the lowest amount of cell wall contents. The cell wall contents in wheat and maize bran were 41.53 ± 0.09 and 37.31 ± 1.05 g/100 g, respectively.
Table 2. Cell wall content of different cereal bran
Tufail et al.[Citation16] explored that the cell wall contents in different wheat varieties ranged from 37.45 ± 0.23 to 39.30 ± 1.67 g/50 g. In the case of maize bran, the cell wall contents ranged from 33.76 ± 1.21 to 34.56 ± 0.39 g/50 g in different varieties of maize. Saulenier et al.[Citation17] declared that the cell wall material consists of 74% non-starch polysaccharides (especially arabinoxylans). Cereal bran is an excellent source of cell wall dietary fiber.[Citation18]
Total sugar content of CBCW
The total sugar contents of bran cell walls of wheat, maize, and oat are shown in . The highest content of xylose was found in dry material of the maize bran cell wall (32.12 ± 0.31%), followed by wheat (24.56 ± 0.12%) and oat (23.55 ± 0.10%). However, the lowest content was exhibited by glucose in each bran ranging from 1.11% to 2.26%. In the case of arabinose, wheat, maize, and oat bran cell walls showed 17.23 ± 0.54%, 25.83 ± 0.91%, and 20.19 ± 0.04%, respectively. Furthermore, the galactose content was 7.91 ± 0.14%, 9.68 ± 0.11%, and 4.10 ± 0.09% in wheat, maize, and oat cell walls, respectively. Moreover, the contents of glucuronic acid in wheat, maize, and oat were 4.54 ± 0.03%, 6.88 ± 0.01%, and 2.24 ± 0.03%, respectively. Glucose contents were 2.26 ± 0.04%, 1.11 ± 0.01%, and 1.15 ± 0.03% in wheat, maize and oat bran cell walls, respectively. In a previous study, Bader Ul Ain et al.[Citation11] explored that the sugar content of arabinose, xylose, mannose, and galactose in the wheat endosperm cell wall was 33.93 ± 0.06%, 49.62 ± 0.12%, 6.58 ± 0.01%, and 2.52 ± 0.03%, respectively. Gartaula et al.[Citation19] explored that the highest sugar contents in the endosperm cell wall extracted from different flour treatments were 24.8, 49.6, 2.2, and 28.3 mol% of arabinose, xylose, galactose, and glucose, respectively. The current results showed that natural sugars such as xylose and arabinose are the main constituents of cell wall non-starch polysaccharides.
Table 3. Total sugar content of (% dry weight) of CBCW
Total phenolic content of CBCW
The total phenolic content of the cereal cell wall extracted from oat bran was higher than those from wheat and maize bran cell walls. The phenolic content of the bran cell wall of different cereals is presented in . The oat bran cell wall contained the highest total phenolic content (6.61 ± 0.03 mg GAE/g), followed by wheat (4.98 ± 0.21 mg GAE/g) and maize bran cell walls (6.34 ± 0.15 mg GAE/g), respectively. In the oat bran cell wall, ferulic acid, diferulic acid, and p-coumaric acid were 2.98 ± 0.09, 0.65 ± 0.08, and 1.78 ± 0.09 mg/g, respectively. The wheat bran cell wall material contained 2.73 ± 0.1, 0.78 ± 0.2, and 0.16 ± 0.03 mg/g ferulic acid, diferulic acid, and p-coumaric acid contents, respectively.
Table 4. Phenolic acid content (mg/g) of CBCW
Furthermore, the ferulic acid content (3.89 ± 0.07 mg/g) was higher in the maize bran cell wall as compared to other cereal bran. Diferulic and p-coumaric acids were 0.79 ± 0.01 and 0.42 ± 0.003 mg/g, respectively, in maize bran cell wall material. Ferulic acid, diferulic acid, and p-coumaric acid are important polyphenols of the cereal cell wall.[Citation20] In CBCW, ferulic acid is in the dimer form, indicating cross-linking in the cell walls. Previous studies on cereal bran have shown that the presence of ferulic acid dehydrodimers has a significant impact on the functional properties of cell walls. The results of phenolic acids in the maize bran cell wall were in line with the results of previous research conducted by Saulnier et al.[Citation17], and they reported that ferulic acid was major phenolic acid in MBCW (approximately 4.1% dry matter). Gartaula et al.[Citation19] explored that the total phenolic contents in different treatments of wheat flour endosperm (i.e., extracted cell wall) ranged from 1825 to 7514 µg FAE/g. Another recent study by Hussain et al.[Citation21] explored different phenolic contents in maize bran, especially the ferulic acid content was 3.7 mg/g in maize bran. The previous literature showed that the phenolic acid contents in different anatomical parts of the wheat kernel and trace amounts are present in the starchy endosperm.[Citation19,Citation22]
Water-holding capacity of CBCW-enriched flour
The water-holding capacity (WHC) is directly associated with the flour and CBCW content of the sample. The WHC of wheat flour C0 and CBCW containing flour C1, C2, C3, C4, C5, and C6 are shown in . C0 (control) showed the WHC of 0.62 g H2O/g. After the addition of CBCW, the WHC of the flour increased up to 0.03 g H2O/g. The WHC values were 0.636, 0.643, 0.642, 0.651, 0.629, and 0.647 g H2O/g for C1, C2, C3, C4, C5, and C6, respectively. A higher WHC of CBCW-enriched flour treatments than wheat flour was expected since CBCW binds water due to higher water retention capacity and swelling power. Previous work showed that the addition of different blends in wheat flour increased the water-holding capacity. CBCW-enriched flour showed up to 0.9–2% WHC as compared to wheat flour. Two percent cell wall addition showed higher WHC than 1% cell wall addition. Maize bran cell wall-enriched flour treatment C4 (2% cell wall) showed a higher WHC.
Figure 2. Water-holding capacity of CBCW enriched flour.
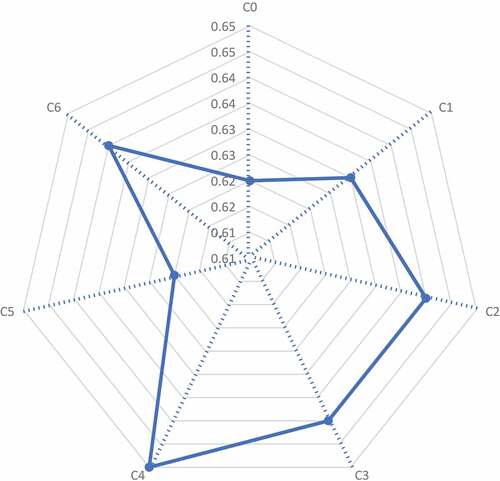
The current results showed that the water-holding capacity of cell wall-enriched flour treatments has been improved due to the non-starch dietary fiber content. In previous research, Hussain et al.[Citation14] reported that maize bran-enriched flour has a higher water-holding capacity as compared to wheat flour due to a higher fiber content. In other research, Hemdane et al.[Citation23] explored that the addition of 20% bran in the wheat flour sample showed 0.84 g H2O/g water-holding capacity. Traynham et al.[Citation24] indicated that the water-holding capacity of the wheat–soy flour blend (0.87 g water/g) was higher than that of wheat flour (0.63 g water/g).
Effect of CBCW on rheological properties of flour treatments
Farinographic analysis: The farinographic results of treatments (C0, C1, C2, C3, C4, C5, and C6) are shown in . Normally, water absorption increases with an increased protein content, but other factors like starch damage during milling also affect water absorption. The water absorption results show that C0 (control) flour absorbs the lower amount of water 62.38 ± 0.31%, and other CBCW-enriched flour treatments have a higher ability of water absorption (64.02 ± 0.09%, 65.61 ± 0.12%, 64.34 ± 0.11%, 65.83 ± 0.17%, 64.32 ± 0.21%, and 66.04 ± 0.23%) in C0, C1, C2, C3, C4, C5, and C6, respectively. Water absorption was gradually increased with the addition of CBCW. Moreover, 2% CBCW addition showed higher water absorption as compared to 1% CBCW.
Table 5. Effect of CBCW on farinographic and mixographic characteristics of wheat flour
In the current research, water absorption values are increased from 1.8% to 3.7%. The higher water absorption of the cereal bran cell wall is due to its higher arabinose and xylose contents. Arabinoxylans are made up of a mixture of arabinose and xylose linkages.[Citation25] Arabinoxylans absorb 9 to 11 times more water than their weight.[Citation26] In different studies, various fiber mixed wheat flour doughs showed an increase in water absorption.[Citation13] Fiber source, structure, extraction methods, porosity, and particle size are all factors that have an influence on water absorption of blends.[Citation27]
CBCW had a higher swelling strength and water-retaining potential than soft wheat flour. It is known that improved water absorption could minimize the negative impact of CBCW on the gluten network development and the quality of the final product. The hydration mechanism is accomplished by forming hydrogen bonds and hydrophilic interactions with the water molecules in protein and starch molecules. Dough mixing is a procedure in which flour and water are stirred until gluten is formed as a consequence of the increased interaction among dispersed and hydrated gluten-forming proteins. The dough development time was higher in C0 treatment (6.75 ± 0.25 min) followed by C1, C2, C3, C4, C5, and C6 (6.31 ± 0.18, 5.78 ± 0.11, 6.08 ± 0.09, 5.41 ± 0.12, 6.15 ± 0.06, and 5.51 ± 0.16 min, respectively). The dough development time for C4 (5.41 ± 0.12 min) was lower than that for the other CBCW-enriched flour dough; this could be due to increased maize bran cell wall content.
Cell wall-enriched flour showed a slightly increasing trend in the dough development time depending on its chemical nature and high water absorption capacity.[Citation28] During the dough development process, the objective was to introduce some physical changes in the dough properties to enhance its ability to retain the CO2 gas released during the fermentation process. Dough stability is the stage where the gluten breaks down and the dough over mixes. In all the dough systems, mixing is a critical step that is influenced by the speed of a mixer, dough temperature, water absorption of the flour, and shortening amount in the dough recipe. The dough stability time was 3.87 ± 0.08, 4.17 ± 0.11, 4.32 ± 0.12, 4.14 ± 0.02, 4.41 ± 0.09, 4.21 ± 0.11, and 4.54 ± 0.6 min for C0, C1, C2, C3, C4, C5, and C6 treatments, respectively. The results showed that the addition of CBCW caused a nonsignificant increase in the dough stability time. It suggests that CBCW has a high potential to absorb water, and this makes the dough less stable. The mean values for the effect of CBCW on the mixing tolerance index of wheat flour and increasing pattern for mixing time were observed by applying CBCW on treatments C0, C1, C2, C3, C4, C5, and C6. The mixing tolerance index (MTI) was 62.21 ± 0.07%, 65.07 ± 0.11%, 68.12 ± 0.06%, 65.32 ± 0.02%, 69.23 ± 0.15%, 65.49 ± 0.04%, and 70.02 ± 0.07% in C0, C1, C2, C3, C4, C5, and C6, respectively. MTI gradually increased by the addition of CBCW up to 2 g/100 g. It is evident from these results that the mixing tolerance index of wheat flour is increased with the addition of CBCW.
Furthermore, a decreasing trend was observed in the softness of wheat flour by the addition of CBCW with different ratios. The results revealed that the softness of dough was 139.4 ± 0.02%, 136.1 ± 0.05%, 131.7 ± 0.05%, 135.7 ± 0.06%, 129.3 ± 0.09%, 137.2 ± 0.04%, and 131.9 ± 0.08% for C0, C1, C2, C3, C4, C5, and C6, respectively.
Mixographic characteristics
The results regarding mean values of the peak height variation of wheat flour owing to CBCW addition showed a significant increase in the peak height. In the C6 treatment, the highest peak height (66.02 ± 0.03 BU) was observed in flour with a 2% oat bran cell wall. The peak height values of C0, C1, C2, C3, C4, and C5 treatments were 54.23 ± 0.21, 60.11 ± 0.13, 63.19 ± 0.17, 57.25 ± 0.07, 60.29 ± 0.05, and 61.19 ± 0.06, respectively. The peak height results were significantly increased with the addition of CBCW (). The addition of fibers in flour significantly improved the peak height, mixing tolerance index, and dough stability.[Citation13]
Mean values regarding the effect of CBCW on the mixing time of wheat flour showed a significant decrease in mixing time by applying treatments (1% and 2% CBCW) as shown in . In C0, C1, C2, C3, C4, C5, and C6 treatments, the mixing time was 6.31 ± 0.04, 6.02 ± 0.03, 5.83 ± 0.01, 5.99 ± 0.07, 5.22 ± 0.03, 5.98 ± 0.03, and 5.72 ± 0.05 min, respectively. In the results regarding the mixing time, the highest time was observed in the C0 control treatment (6.31 ± 0.04 min), whereas the lowest mixing time (5.22 ± 0.03 min) was exhibited by flour with 2% CBCW (maize bran cell wall). Bader Ul Ain et al.[Citation29] reported that the mixing time showed an increasing trend using cereal grain cell wall-enriched flour by applying it on different blends. Generally, the addition of different hydrocolloids caused to improve dough consistency and reduced mixing time of different blends.[Citation30] Courtin and Delcour[Citation31] also reported that arabinoxylan addition in wheat flour decreased the mixing time of different blends.
Conclusion
Among cereals, oat showed more cell wall content than maize and wheat bran. Cereal’s bran cell wall is a good source of different phenolic acids, i.e., ferulic acid, diferulic acid, and p-coumaric acid, and different monosaccharides such as arabinose, xylose, and galactose. However, the maize bran cell wall is an excellent source of ferulic acid and is also high in arabinose and xylose. The incorporation of CBCW in baking flour improved the farinographic and mixograph characteristics. A 2% CBCW treatment enhanced dough stability, water absorption capacity, MTI and peak height of baking flour, while the mixing time, softness of dough, and dough development time were lessened significantly.
Acknowledgments
The authors extend their appreciation to the Deputyship for Research & Innovation, “Ministry of Education” in Saudi Arabia for funding this research work through the project number: IFKSURG-1442-61. The authors also want to thank the Department of Food Sciences, Government College University Faisalabad, for providing labs for carrying out the research work.
Disclosure statement
No potential conflict of interest was reported by the author(s).
References
- Saeed, F.; Hussain, M.; Arshad, M. S.; Afzaal, M.; Munir, H.; Imran, M.; Tufail, T.; Anjum, F. M. Functional and Nutraceutical Properties of Maize Bran Cell Wall Non-starch Polysaccharides. Int. J. Food Prop. 2021, 24(1), 233–248. DOI: 10.1080/10942912.2020.1858864.
- Tufail, T.; Saeed, F.; Arshad, M. U.; Afzaal, M.; Rasheed, R.; Bader Ul Ain, H.; Imran, M.; Abrar, M.; Farooq, M. A.; Shahid, M. Z. Exploring the Effect of Cereal Bran Cell Wall on Rheological Properties of Wheat Flour. J. Food Process. Preserv. 2020, 44(3), e14345. DOI: 10.1111/jfpp.14345.
- Marcia, M. D. O. Feruloylation in Grasses: Current and Future Perspectives. Mol Plan. 2009, 2(5), 861–872. DOI: 10.1093/mp/ssp067.
- Andersson, R.; Åman, P. 27 Cereal Arabinoxylan: Occurrence, Structure and Properties. Adv Dietary Fibre Technol. 2008, 301.
- Bunzel, M. Chemistry and Occurrence of Hydroxycinnamate Oligomers. Phytochem. Rev. 2010, 9(1), 47–64. DOI: 10.1007/s11101-009-9139-3.
- Zhu, F. Interactions between Cell Wall Polysaccharides and Polyphenols Interactions between Cell Wall Polysaccharides and Polyphenols. 2018.
- Zhao, J.; Deng, Y.; Li, S. P. Advanced Analysis of Polysaccharides, Novel Functional Components in Food and Medicine Dual Purposes Chinese Herbs. TRAC-Trend Anal.Chem. 2017, 96, 138–150. DOI: 10.1016/j.trac.2017.06.006.
- Bento-Silva, A.; Patto, M. C. V.; Do Rosário Bronze, M. Relevance, Structure and Analysis of Ferulic Acid in Maize Cell Walls. Food Chem. 2018, 246, 360–378. DOI: 10.1016/j.foodchem.2017.11.012.
- Zhang, Z.; Smith, C.; Li, W. Extraction and Modification Technology of Arabinoxylans from Cereal By-products: A Critical Review. Food Res. Int. 2014, 65, 423–436. DOI: 10.1016/j.foodres.2014.05.068.
- Gül, H.; Özer, M. S.; Dizlek, H. Improvement of the Wheat and Corn Bran Bread Quality by Using Glucose Oxidase and Hexose Oxidase. J. Food Qual. 2009, 32(2), 209–223. DOI: 10.1111/j.1745-4557.2009.00246.x.
- Bader Ul Ain, H.; Saeed, F.; Asif Khan, M.; Niaz, B.; Tufail, T.; Anjum, F. M.; Hussain, S.; Rohi, M. Isolation and Characterization of Cereal Cell Walls. Int. J. Food Prop. 2019, 22(1), 130–137. DOI: 10.1080/10942912.2019.1573832.
- Pettolino, F. A.; Walsh, C.; Fincher, G. B.; Bacic, A. Determining the Polysaccharide Composition of Plant Cell Walls. Nat Protein. 2012, 7(9), 1590–1607. DOI: 10.1038/nprot.2012.081.
- Waldron, K.; Parr, A. J.; Ng, A.; Ralph, J. Cell Wall Esterified Phenolic Dimers: Identification & Quantification by Reverse Phase High Performance Liquid Chromatography & Diode Array Detection. Analytics. 1996, 7(6), 305–312.
- Hussain, M.; Saeed, F.; Niaz, B.; Afzaal, M.; Ikram, A.; Hussain, S.; Mohamed, A. A.; Alamri, M. S.; Anjum, F. M. Biochemical and Nutritional Profile of Maize Bran‐enriched Flour in Relation to Its End‐use Quality. Food Sci. Nutr. 2021, 9(6), 3336–3345. DOI: 10.1002/fsn3.2323.
- AACC. Approved Methods of American Association of Cereal Chemists. 10th. American Association Cereal Chemists. Inc., St. Paul:MN. 2000
- Tufail, T.; Saeed, F.; Pasha, I.; Umair Arshad, M.; Afzaal, M.; Bader Ul Ain, H.; Bashir, S.; Imran, M.; Zia Shahid, M.; Abdullah, M., et al. Extraction, Quantification, and Biochemical Characterization of Cereal Industry By‐product Cell Wall. J. Food Process. Preserv. 2021, 45(3), e15023. DOI: 10.1111/jfpp.15023.
- Saulnier, L.; Marot, C.; Chanliaud, E.; Thibault, J. F. Cell Wall Polysaccharide Interactions in Maize Bran. Carbohydr. Polym. 1995, 26(4), 279–287. DOI: 10.1016/0144-8617(95)00020-8.
- Robin, F., and Palzer, S. Texture of Breakfast Cereals and Extruded Products. In Modifying Food Texture, Edited by Jianshe Chen and Andrew RosenthaUnited Kingdom: Woodhead Publishing, 2015; pp 203–235.
- Gartaula, G.; Dhital, S.; Pleming, D.; Gidley, M. J. Isolation of Wheat Endosperm Cell Walls: Effects of Non-endosperm Flour Components on Structural Analyses. J. Cereal Sci. 2017, 74, 165–173. DOI: 10.1016/j.jcs.2017.02.004.
- Stuper-Szablewska, K.; Perkowski, J. Phenolic Acids in Cereal Grain: Occurrence, Biosynthesis, Metabolism and Role in Living Organisms. Crit. Rev. Food Sci. Nutr. 2019, 59(4), 664–675. DOI: 10.1080/10408398.2017.1387096.
- Hussain, M.; Qamar, A.; Saeed, F.; Rasheed, R.; Niaz, B.; Afzaal, M.; Mushtaq, Z.; Anjum, F. Biochemical Properties of Maize Bran with Special Reference to Different Phenolic Acids. Int. J. Food Prop. 2021, 24(1), 1468–1478. DOI: 10.1080/10942912.2021.1973026.
- Ndolo, V. U.; Beta, T.; Fulcher, R. G. Ferulic Acid Fluorescence Intensity Profiles and Concentration Measured by HPLC in Pigmented and Non-pigmented Cereals. Food Res. Int. 2013, 52(1), 109–118. DOI: 10.1016/j.foodres.2013.02.031.
- Hemdane, S.; Langenaeken, N. A.; Jacobs, P. J.; Verspreet, J.; Delcour, J. A.; Courtin, C. M. Study of the Role of Bran Water Binding and the Steric Hindrance by Bran in Straight Dough Bread Making. Food Chem. 2018, 253, 262–268. DOI: 10.1016/j.foodchem.2018.01.152.
- Traynham, T. L.; Myers, D. J.; Carriquiry, A. L.; Johnson, L. A. Evaluation of Water-holding Capacity for Wheat–soy Flour Blends. J. Am. Oil Chem.’ Soc. 2007, 84(2), 151. DOI: 10.1007/s11746-006-1018-0.
- Fox, G. P. Beer and Arabinoxylan. In Beer in Health and Disease Prevention, Edited by Victor R. Preedy, Department of Nutrition and Dietetics, King's College London, London, UK.; Academic Press, 2009; pp 309–316.
- Qiu, S.; Yadav, M. P.; Liu, Y.; Chen, H.; Tatsumi, E.; Yin, L. Effects of Corn Fiber Gum with Different Molecular Weights on the Gelatinization Behaviors of Corn and Wheat Starch. Food Hydrocolloids. 2016, 53, 180–186. DOI: 10.1016/j.foodhyd.2015.01.034.
- Ahmed, J.; Almusallam, A. S.; Al-Salman, F.; AbdulRahman, M. H.; Al-Salem, E. Rheological Properties of Water Insoluble Date Fiber Incorporated Wheat Flour Dough. LWT Food Sci. Technol. 2013, 51(2), 409–416. DOI: 10.1016/j.lwt.2012.11.018.
- Majeed, M.; Khan, M. U.; Owaid, M. N.; Khan, M. R.; Shariati, M. A.; Igor, P.; Ntsefong, G. N. Development of Oyster Mushroom Powder and Its Effects on Physicochemical and Rheological Properties of Bakery Products. J. Microbiol. Biotechnol. Food Sci. 2021, 2021, 1221–1227.
- Bader Ul Ain, H.; Saeed, F.; Kashif, M.; Mushtaq, Z.; Imran, A.; Ahmad, A.; Tufail, T. Effect of Cereal Endospermic Cell Wall on Farinographic and Mixographic Characteristics of Wheat Flour. J. Food Process. Preserv. 2020, 44(11), e14899. DOI: 10.1111/jfpp.14899.
- Lazaridou, A.; Duta, D.; Papageorgiou, M.; Belc, N.; Biliaderis, C. G. Effects of Hydrocolloids on Dough Rheology and Bread Quality Parameters in Gluten-free Formulations. J. Food Eng. 2007, 79(3), 1033–1047. DOI: 10.1016/j.jfoodeng.2006.03.032.
- Courtin, C. M.; Delcour, J. A. Physicochemical and Bread-making Properties of Low Molecular Weight Wheat-derived Arabinoxylans. J. Agric. Food Chem. 1998, 46(10), 4066–4073. DOI: 10.1021/jf980339t