
 ?Mathematical formulae have been encoded as MathML and are displayed in this HTML version using MathJax in order to improve their display. Uncheck the box to turn MathJax off. This feature requires Javascript. Click on a formula to zoom.
ABSTRACT
The fresh mackerel was frozen using four different quick-freezing methods, such as refrigerator freezing, quick freezer freezing, spiral tunnel freezing and plate freezing. Water retention, color, texture, electrical conductivity, total volatile base nitrogen (TVB-N), K value, malondialdehyde (MDA), sulfhydryl group and protein secondary structure were used as physicochemical indicators to evaluate the changes in fish quality, and water migration in the fish was observed by low field NMR. The results showed that the mackerel treated with spiral tunnel freezing method was the closest to the fresh samples, with the best water retention capacity during freezing, slow decrease in hardness and elasticity, low rate of increase in conductivity values, TVB-N content, MDA content and K value, slow decrease in total sulfhydryl content, and more stable protein secondary structure. This indicated that fat oxidation was the lowest and protein degradation was the least, which effectively maintained the moisture and freshness of the samples and was the most favorable treatment to maintain the quality of mackerel compared with other groups.
KEYWORDS:
Introduction
Mackerel is an inexpensive, tasty and nutritious pelagic migratory fish,[Citation1] which is widely distributed in the Pacific Ocean. Due to the high content of unsaturated fatty acids, mackerel caught from the sea is very easy to spoil.[Citation2] In the past, mackerel was processed into cans[Citation3] to prolong its shelf life. But for seafood, freezing is a better way to extend shelf life and maintain quality than that of can processing.[Citation4] With the advancement of freezing technology, frozen whole mackerel gradually enters the consumer’s table.
During frozen storage, a series of chemical changes such as fat oxidation, protein degradation and water loss will accelerate the deterioration of frozen samples.[Citation5] Wang[Citation6] evaluated the effects of including refrigerator, immersion, and plate freezing on conditioned steaks and showed that significant quality deterioration occurred in steaks treated with refrigerator freezing. The causes of quality deterioration during frozen storage are a combination of factors, mainly related to the freezing method, storage temperature, storage time and temperature fluctuations during storage.[Citation7] During the freezing process, the water in the sample is transformed into ice crystals, and the growth of ice crystals destroys the microstructure of the sample and concentrates the solution inside the cells, leading to a series of biochemical reactions, which in turn affect the physical properties of the meat.[Citation8,Citation9] Zhang[Citation10] evaluated the effect of different power ultrasound-assisted immersion freezing on porcine longissimus muscles and found that 180 W ultrasound power resulted in a more uniform distribution of ice crystals while reducing their size, increasing the freezing rate of muscles and improving their quality. After thawing of the frozen samples, their quality decreases due to the destruction of their microstructure. Different freezing methods have different effects on the growth rate and size of ice crystals and cause different damage to the sample. Yu et al.[Citation11] used liquid nitrogen flash freezing, −35°C air-blast freezing and −18°C refrigerator freezing to treat giant freshwater prawns and found that rapid freezing was effective in maintaining the quality of shrimp compared to slow freezing. Lv[Citation12] evaluated the quality analysis of six different freezing methods on cuttlefish frozen storage and found that liquid nitrogen freezing took the shortest time to pass the maximum ice crystal production zone, with the best water retention and the lowest TVB-N content after 90 days of frozen storage. However, it is not true that the lower the temperature, the better the quality of the frozen fish. Truonghuynh et al.[Citation13]found that low temperature freezing at −60°C was more suitable for large yellow croaker by evaluating fresh large yellow croaker frozen at −40°C, −60°C and −80°C in a cabinet liquid nitrogen freezer and at −40°C in an ultra-low temperature freezer. Due to these reasons, the freezing method of mackerel needs to be further explored.
This study investigated the effects of four freezing methods (plate freezing-PF, refrigerator freezing-RF, spiral tunnel freezing-SF, and quick freezer freezing-QF) on the quality of mackerel. To explore the most suitable freezing method for mackerel by evaluating the sensory evaluation, physicochemical properties, protein characteristics and freshness changes of mackerel during frozen storage, in order to provide a reference for freezing and preservation of mackerel.
Materials and methods
Sample preparation
Ocean-caught fresh mackerel weighing 215 ± 25 g were purchased from Luchao port, and one layer of ice and one layer of fish were alternately placed in a foam box and transported to the laboratory within half an hour.
Materials
Phosphate buffers (20 mmol/L Tris-maleate, 0.05 mol/L KCl, pH = 7.0, 20 mmol/L Tris-maleate, 0.6 mol/L KCl, pH = 7.0) were purchased from Sangon Biotech (Shanghai). The trace total sulfhydryl test kit was purchased from Soleibao Technology Co., Ltd. (Beijing). The modified Bradford method protein concentration determination kit was purchased from Sangon Biotech (Shanghai), and the malondialdehyde analysis kit was purchased from Nanjing Jiancheng Institute of Biological Engineering (Nanjing).
Freezing methods
First rinse the surface of the fish with ice water, then wipe off the water on the surface of the fish with paper, and finally divide the fish into four groups at random. Each group of mackerels were put into their own freezer, the temperature of each freezer is −30°C. Refrigerator freezing (RF) is to put mackerel in a refrigerator (BD-105DEW, Haier Electric, Qingdao, China), quick freezer freezing (QF) is to put fish into proton high efficiency fresh freezer (Qing’an JSC, Xi’an, China), spiral tunnel freezing (SF) is to put fish into spiral quick freezer (Yantai Moon Co., Ltd, Qingdao, China) and plate freezing (PF) is to put fish into flat freezer (Yantai Moon Co., Ltd, Qingdao, China). The proton high efficiency freezing capacity of the freezer was 15 kg/h. The spiral freezer had a fan frequency of 50 kHz and a wind speed of 6.67 m/s. The wire of a T-type thermocouple (KeySight Agilent 34970A data collector, USA) was inserted into the muscle near the spine of the mackerel, and the freezing terminal temperature was set to −18°C. Then, the frozen fish were stored in a − 20°C deep-freezer (BC/BD-429HCM, Haier Electric, Qingdao, China) and random samples were taken on days 5, 30, 60, and 90 to determine the indicators.
Measurement of water retention
Thaw loss: Mackerel was thawed by flowing water according to the procedure used by Wang et al.[Citation14]The mass m1 and m2 of the mackerel before and after thawing are respectively weighed, and the ratio of the weight lost to the mass of the mackerel before thawing is the thawing loss.
Centrifugal loss: A 1 cm × 1 cm piece of flesh was cut from the back of mackerel and the weight was recorded as m3. Samples were wrapped in two layers of filter paper, placed in a centrifuge tube and centrifuged at 3000 × g for 10 min at 4°C. After centrifugation, the fish is weighed and recorded as m4, and the centrifugal loss is calculated according to the following formula.[Citation15]
Cooking loss: A 2 g piece of the back of the fish was cut out and weighed as m5 and placed in a polyethylene self-sealing bag in a water bath at 85°C for 20 min. The fish pieces were removed and were cooled naturally to room temperature. The water on the surface of the fish body was wiped off with paper and the weight of the fish pieces was recorded as m6. The cooking loss is given by the following equation.[Citation16]
Color measurement
In accordance with the procedure used by Wang et al.,[Citation17] the color of the fish was measured using a colorimeter (CR-400, Konica Minolta, Tokyo, Japan) and the L* (lightness), a* (redness) and b* (yellowness) of the fish were recorded separately. Five parallel values were taken for the same fish.
Instrumental texture
According to the procedure used by Li et al.,[Citation18] five pieces of 2 cm × 2 cm × 1 cm were removed from the back of the mackerel and inspected with a texture analyzer (TMS-PRO Tissue Instrument, FTC Corporation, USA). The texture analyzer uses a P/6 flat-bottomed cylindrical probe with a prediction rate of 3 mm/s, a test rate of 1 mm/s, a shape variable of 50%, and a return distance of 20 mm.
Electro conductivity
According to the procedure used by Zhou et al.,[Citation15] 2 g of chopped fish was placed into a 50 mL centrifuge tube, 20 mL of distilled water was added to make it homogeneous, and centrifuged at 1000 × g for 10 min at 4°C. When the temperature of the solution reached room temperature, the conductivity of the supernatant was measured with a conductivity meter (METTLER TOLEDO FE30, Zurich, Switzerland) and recorded.
Total volatile base nitrogen
The TVB-N (Total volatile base nitrogen) content was measured by Kjeldahl nitrogen meter (Kjeltec 8400, Foss, Denmark), and 5 g of chopped fish were weighed precisely for measurement according to the method of Liu et al. .[Citation19]
Malondialdehyde
The supernatant was extracted by homogenizing 2 g of chopped fish and 18 mL of normal saline in a centrifuge tube, according to the method of Tan et al.,[Citation20] centrifuged at 5000 × g for 10 min at 4°C. According to the method of the kit (Malondialdehyde (MDA) assay kit (TBA method), Nanjing JianCheng Bioengineering Institute, China), the working solution was added to the supernatant and mixed and heated in a water bath at 95°C for 40 min. After cooling to room temperature, the solution was centrifuged at 2500 × g for 10 min and measured at 532 nm using an enzyme-labeled instrument (Shanghai Symer Technology Co., Ltd., China). The MDA was calculated using the formula given in the assay kit.
K-value determination
K-value was measured according to the procedure used by Chu et al.,[Citation21] 5 g of fish meat was homogenized with 10 mL of 10% perchloric acid solutions, centrifuged at 8000 × g for 15 min at 4°C, and the supernatant was collected. The precipitate was homogenized by adding 10 mL of 5% perchloric acid, centrifuged under the same conditions, and the supernatant collected, and this operation was performed twice. The supernatants collected after three centrifugations were combined, 15 mL of ultrapure water was added, the pH was adjusted to 6.5, and placed for 30 min. Finally, the sample was filtered with a 0.22 μm aqueous PES filter membrane. The analysis was performed by high performance liquid chromatography (Waters 2695, Milford, CT, USA). The COSMOSIL5C18 (4.6 mm×250 mm, 5 μm) column was connected to the HPLC. The mobile phase A was a phosphate buffer solution formulated with 0.05 mol/L KH2PO4 and 0.05 mol/L K2HPO4, and the mobile phase B was a methanol solution. The column temperature was 30°C, the injection volume was 10 μL, the flow rate was 1.0 mL/min, and the ratio of mobile phase A to B was 95% to 5%. The running time of the sample was 25 min, and the detection was performed at a wavelength of 254 nm.
Protein properties
Sulfhydryl-content determination: The myofibrillar protein from fish was extracted with reference to Wang’s method,[Citation22] and the protein concentration was determined using the Bradford method kit, and then the total sulfhydryl test kit was used to determine the sulfhydryl content of the myofibrillar protein solution.
Fourier-transform infrared spectroscopy: According to the procedure used by Fan et al.,[Citation23] the lyophilized protein powder samples were thoroughly ground, and then the whole bands were scanned by a Thermo FT-IR spectrometer (Thermo Scientific, USA) at 25°C with 32 scans at a resolution of 4 cm−1, and three parallel experiments were performed for each sample.
Low-field nuclear magnetic resonance (LF-NMR) and magnetic resonance image (MRI)
A LF-NMR analyzer (MesoMR23-060 H.I, Niumag Corporation, Shanghai, China) was used to analyze the proton lateral relaxation of mackerel samples. According to the procedure used in Li et al.,[Citation24] the fish fillets were taken from the back of the fish with the size of 1.5 cm × 1.5 cm × 0.5 cm, a total of 5 pieces of fish were taken, and the fillets were placed inside the magnet for analysis. After iterative inversion, the T2 spectrum of the relaxation time was obtained. Perform imaging by pulsed nuclear magnetic resonance analyzer, and then perform unified mapping and false color on the proton density map.
Data analysis except
There were 3 replicates for each index except for the above cases. IBM SPSS Statistics 22.0 software was used for one-way ANOVA, and Origin 2021 software was used for plotting.
Results and discussion
Freezing procedure for mackerel
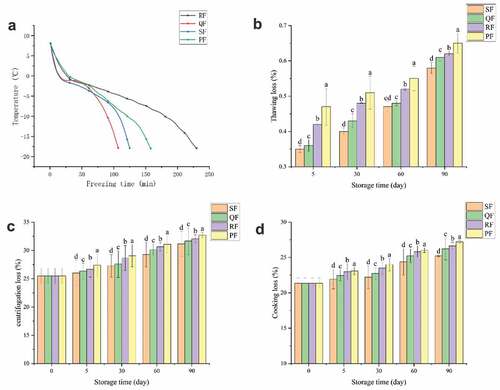
During the freezing process, the size and distribution of ice crystals, which have a direct impact on the quality of seafood, are affected by the freezing rate,[Citation25] and the rapid passage through the maximum ice crystal generation zone can reduce the impact of freezing on seafood .[Citation26] The temperature variation curves of mackerel from 8°C to −18°C by four different freezing methods are shown in the . The time spent in the four freezing methods was RF (230 min)> PF (158 min)> SF (125 min)> QF (107 min). The time to pass the maximum ice formation zone (−1 to −5°C) was 79, 50, 57 and 42 min for RF, QF, SF and PF, respectively. The temperature of QF rose slightly when it dropped to −1°C. The reason for this phenomenon was the occurrence of subcooling .[Citation27] In general, the faster the freezing rate, the smaller the ice crystals that affect the quality of food .[Citation9] Compared to SF, which sent a low-temperature gas stream to a mesh conveyor belt in a spiral tunnel, QF had less freezing space, the gas created more impact from vortices, and the mackerel was cooled more quickly. Compared to RF, PF was able to provide enough cooling capacity at the beginning of freezing to reduce the rise in temperature brought about by putting in mackerel. Both QF and SF had forced convection air to assist in freezing and therefore spent less time in the freezing process than those of RF and PF.
Figure 1. Change of central temperature (A), thawing loss (B), centrifugation loss (C) and cooking loss (D) of spiral tunnel freezing (SF), quick freezer freezing (QF), refrigerator freezing (RF) and plate freezing (PF) groups during frozen storage. The different letters in the figure mean significant difference (p < .05).
Water retention
The size, distribution and quantity of ice crystals formed in the process of food freezing cause damage to the muscle of samples .[Citation13] After thawing these damages lead to the reduction in the weight of the sample and a decrease in the water retention capacity of the sample .[Citation28] Thawing loss, centrifugation loss and cooking loss can reflect the water holding capacity of mackerel, and their changes during storage are shown in to 1D respectively. It can be seen from that the thawing loss gradually increased with the increase of storage time. In the same storage time, the thawing loss of PF was significantly higher than that of other groups (P < .05). The thawing loss of PF stored for 5 days was even the same as that of SF stored for 60 days. The thawing loss of PF increased from 0.47% on the 5th day to 0.65% on the 90th day, and SF increased from 0.35% to 0.58%.
shows the centrifugal losses from SF, QF, RF and PF in descending order for the same storage time. The centrifugation loss of fresh samples was 25.47%, and that of SF was 26.01% at 5d, increased by 2.13%. At the late frozen storage, the centrifugal loss of SF was 31.17% increased by 22.36%. And PF was 27.41% increased by 28.39%.The centrifugal loss increased with the increase of storage time. As can be seen in , the cooking loss of mackerel followed the same trend as the centrifugal loss, both of which increased due to the increase in storage time.
In this study, different freezing methods caused different effects on the water retention of the samples, with PF having the worst water retention, followed by RF, and SF having the best water retention. The quicker the freezing, the better the water holding capacity of mackerel. The water retention was also related to the storage time, with a decreasing trend in the water retention of frozen mackerel over time. The reason for the significantly inferior water retention of PF compared to the other groups was the mechanical damage to the fish caused by the pressure applied during the freezing process, and the increased stress in the fish leading to more water spillage.
Color measurement
For consumers, color is the most intuitive indicator to reflect the freshness of fish, which has a guiding role for consumers to judge the freshness of fish.[Citation29] After storage for a period of time, the changes of L* and b* measured by thawing of samples treated with different freezing methods are shown in –b. There were no significant differences observed in a* for mackerel during frozen storage, indicating that the freezing method did not have a significant effect on the redness of the mackerel. The average L* value for fresh fish at the beginning was 35.054 and b* was 2.01. L* values increased significantly during storage, rising to 47.423, 50.784, 49.261 and 45.484 for SF, QF, RF and PF, respectively, at 90d. The b* values also increased with storage time, which represents an increase in the yellowness value of the samples.
Figure 2. Change of L* (A), b* (B) of sample color, hardness (C) and elasticity (D) of SF, QF, RF and PF groups during frozen storage. The different letters in the figure mean significant difference (p < .05).
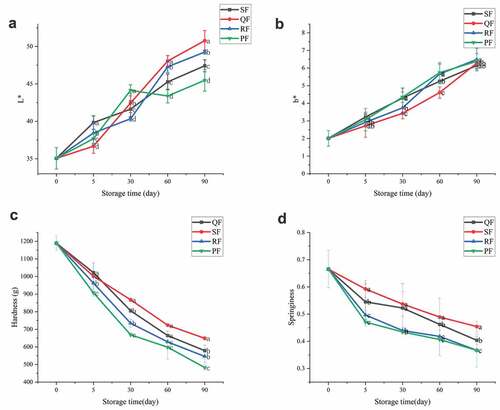
The variation of L* is related to the moisture state in the muscle, which is influenced by the freezing method and the freezing rate .[Citation30] Samples with large thawing losses which has greater light reflection results in larger L* values. The increase of b* values indicates that oxidation of fat in the fish, which has occurred to produce yellow pigments, the same as found by Tironi[Citation31] in frozen sea bass.
Instrumental texture
Texture is an important parameter of mackerel, and the parameters measured for texture include hardness, springiness, gumminess, resilience and chewiness.[Citation17] In this study, the hardness and springiness of the samples were measured to reflect the textural changes of mackerel during the storage period by different freezing methods. –d demonstrate that the hardness and elasticity of the samples showed a decreasing trend regardless of the freezing method used. Overall, after different freezing methods, SF and QF possessed better hardness and springiness than RF and PF. In the early stage of freezing, the hardness of each group showed a significant decrease, while the decreasing trend tended to level off in the later stage of storage. The greatest decrease was observed in PF, where the hardness decreased by 23.73% and 43.74% at 5 d and 30 d, respectively, compared to the fresh samples, and at 60 d and 90 d, it decreased by 49.68% and 59.42%, respectively. The main reason is that after thawing the frozen samples, the myofibrillar cells of the samples were damaged and deformed, and the water between the cells was lost, resulting in certain voids.[Citation32] The trend of decreasing hardness and elasticity of mackerel was similar to the trend of decreasing water retention. With the increase of storage time, this irreversible damage gradually increased, and the original hardness and elasticity of the samples gradually decreased.[Citation33,Citation34]
Conductivity
Electrical conductivity is a novel method for rapid detection of food spoilage with rapid, relatively accurate and economical characteristics.[Citation35] As the freezing time increases, products such as ions with electrical conductivity in fish increased, and the electrical conductivity of diluted muscle fluid extracts rose.[Citation36]
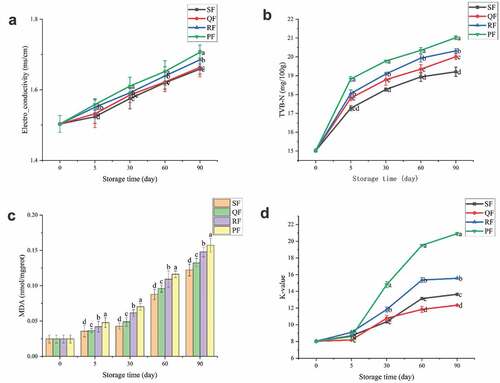
In this study, it can be seen from the variation curve of conductivity in that the conductivity increases with increasing freezing time, and among the four different freezing methods, PF had the highest conductivity and SF had the lowest conductivity. PF’s mackerel release more conductive ions during the freezing process due to the applied pressure causing partial cell breakage. In addition, slow freezing generated larger ice crystals that also punctured the cells, resulting in increased electrical conductivity of the sample.[Citation37] The increase in conductivity was small throughout the freezing period, with values of 10.33%, 10.66%, 12.08% and 13.50% for SF, QF, RF and PF at 90 d, respectively. The higher values of conductivity, the more the muscle is destroyed and the poorer the quality of the samples.
Figure 3. Change of electrical conductivity (A), TVB-N (B), MDA (C) and K-value (D) of SF, QF, RF and PF groups during frozen storage. The different letters in the figure mean significant difference (p < .05).
Total volatile base nitrogen
During spoilage of aquatic products, proteins are broken down by endogenous enzymes and microorganisms to produce alkaline nitrogenous substances, such as amines.[Citation38] Freezing can reduce the effect of microorganisms on fish, but with the increase of storage time, the TVB-N of aquatic products gradually increases under the action of endogenous proteases.[Citation39] Pelagic-caught mackerel belong to the mackerel family and are more susceptible to spoilage than other aquatic products, with high initial values of TVB-N.[Citation40] The TVB-N of the sample at the beginning of the storage reached 15.02 mg/100 g, and this value increased with the increase of the storage time. As can be seen from , there was a substantial increase in TVB-N for all four freezing methods at the 5th day, while this increasing trend slowed down after 30 d. Among the four different freezing methods, TVB-N values were highest for PF and lowest for SF. The TVB-N value of PF reached 20.34 mg/100 g at 60 d, while QF and RF reached this value only at 90 d, and the TVB-N value of SF reached 19.21 mg/100 g at 90 d. This trend of increasing TVB-N during storage was close to the trend of thawing losses, attributed to protein breakdown.[Citation28]
Malondialdehyde
During freezing of mackerel, the unsaturated fatty acids are oxidized to produce malondialdehyde (MDA), which reacts with thiobarbituric acid reactive substances (TBARS) to produce a pink compound.[Citation20] The degree of fat oxidation in mackerel can be reflected by comparing the absorbance values of the pink compounds. shows the changes in MDA of mackerel treated with different freezing methods during storage. In the early stage of storage, the content of MDA was low, but its rate of increase was high. After one month of storage, the MDA content still increased, but its rate of increase decreased and the increment stabilized, which was the same as found by Suh et al.[Citation41] The MDA content of SF was the lowest among the four different freezing methods, which can be explained by quick-freezing. The MDA value of PF was the highest because the pressure exerted during freezing caused the cells to be broken and released more substances that promoted oxidation.[Citation42]
K-value determination
ATP degradation starts after the death of fish, which has an important influence on the flavor and freshness of the samples. K-value is an important index for fish freshness, which represents the ratio of the sum of Ino and Hx to ATP and its total decomposition.[Citation43] The K-value change curves of the four freezing methods during storage are shown in . Usually, K-values below 20% are considered as first grade freshness, and 20%-40% are considered as second grade freshness.[Citation11] From , it can be seen that during the whole freezing period, all samples were at the first freshness level, except for PF, where the K-value increased to 20.89 ± 0.16 at 90 d to reach the second freshness level. The K-value increased rapidly during the first 60 days of storage and slowed down after 60 d. The variation of K values indicated that the freezing methods of SF and QF had relatively excellent results, and the rising trend of PF was significantly higher than the other groups indicating that PF was not suitable for the freezing of mackerel.
Protein properties
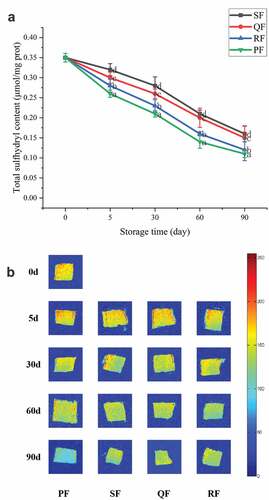
Sulfhydryl-content determination: Sulfhydryl groups are important functional groups in proteins. During freezing, as the spatial structure of the protein changes, sulfhydryl groups are oxidized and decomposed to form disulfide bonds,[Citation44] so the degree of gradual decrease in sulfhydryl group content can reflect the degree of protein oxidation .[Citation45] It can be seen from that the sulfhydryl content of PF group decreased the fastest, probably due to the long freezing time and the formation of large ice crystals in the muscle interstices of the samples, which compressed the myogenic fibers and caused mechanical damage to some cells and intensified the protein denaturation.[Citation46] The sulfhydryl content of the SF group decreased the slowest, indicating that spiral freezing could effectively inhibit the protein denaturation of the samples.
Figure 4. Change of sulfhydryl content (A) and magnetic resonance imaging (MRI) (B) of SF, QF, RF and PF groups during frozen storage. The different letters in the figure mean significant difference (p < .05).
Fourier-transform infrared spectroscopy: FTIR spectroscopy is applied in protein secondary structure analysis, and the main region of interest is the amide I band (wave number range of 1600 ~ 1700 cm-1), where the stretching and stretching vibrations of the C = O bonds of the peptide backbone of protein molecules cause changes in the spectrum .[Citation47] The main basic units of protein secondary structure were β-Sheet, Random, α-Helix and β-Turn,[Citation48] corresponding to the wave number ranges of 1600 ~ 1640, 1640 ~ 1650, 1650 ~ 1660 and 1660 ~ 1700 cm-1, respectively. shows the protein secondary structure content of mackerel during freezing and storage. α-Helix content of fresh samples was 23.78 ± 0.26%. The α-Helix content tended to decrease with increasing freezing time, accompanied by a gradual increase in β-Sheet and Random curl content. Between the different treatment groups, the α-Helix of the PF group decreased by 34% at the end of 90 d freezing, and the SF group decreased the least, by only 28%. α-Helix gradually transformed to β-Sheet and Random, which was produced by the breakage of hydrogen bonds between and within the secondary structures. The destabilization of the secondary structure leads to denaturation of the protein, causing a decrease in its water retention .[Citation49] Therefore, the SF group can better maintain the stability of the secondary structure of proteins and have better water retention.
Table 1. Effects of different freezing methods on secondary structure contents from amide I band region of different components in mackerel during frozen storage
LF-NMR and MRI
The transverse relaxation of protons was measured by LF-NMR technique and the exponential fit of the data indicated the existence of 3 proton groups, T21 (0.1–10 ms) representing bound water, T22 (10–100 ms) representing immobilized water and T23 (100–10000 ms) representing free water. gives the peak areas of the representative water contents of the three moisture states, as well as the peak emergence times of T22. From the table, it can be seen that the content of immobilized water gradually decreases and free flowing water gradually increases with the increase of storage time, which is due to the increase of storage time, the scale of protein denaturation increases, the spatial structure changes, the binding ability with water molecules decreases, and the immobilized water transforms to free water. Between different freezes, PF had the highest percentage of conversion of immobilized water to free water and relatively severe water loss, which may be due to the additional mechanical damage caused during freezing, allowing cell-to-cell spillage of immobilized water. There was little difference in the rate of decreasing trend among the groups during storage, therefore, different freezing methods had a significant effect on water migration. The time of T22 peak emergence gradually shifted to the left with the increase of storage time, which indicated that the binding strength of immobilized water in the samples gradually weakened and mobility increased .[Citation50] It was clear that SF was better than the other groups, while PF had the greatest mobility of water, which was consistent with the results of water holding capacity.
Table 2. Effects of different freezing methods on water ratio of different components in mackerel during frozen storage
MRI has the ability to directly characterize the water pattern inside the sample, with red color representing high proton density and blue color representing low proton density. In general, the stronger the water molecule coat-signal is, the redder the pattern presents, the higher the moisture content is. shows the distribution of moisture content of mackerel treated with different freezing methods during the storage period. The fresh samples had a higher percentage of red fraction and the red area in the figure started to decrease as the storage time increased. The SF group had more red fractions present and maintained for a long time, so less moisture migration occurred.
Conclusion
In this study, four freezing methods (PF, RF, QF, SF) were used to evaluate the quality changes of mackerel during freezing and storage. According to the analysis of quality indicators (water retention, Texture, TVB-N, MDA, K-value, Sulfhydryl-content, protein secondary structure, etc.), the quality of mackerel significantly decreased after 3 months of frozen storage (p < .05). During frozen storage, SF showed the least increase in thawing loss, cooking loss and centrifugal loss, low decrease in hardness and elasticity, and increase in conductivity, MDA, K value and TVB-N by 0.15 ms/cm, 0.1 nmol/mgprot, 5.6 and 4.19 mg/100 g, respectively, which were much lower than other groups, indicating that SF is more suitable for frozen mackerel. All quality indicators of QF are very close to SF freezing, are better than RF and PF. Although plate freezing (PF) is faster than RF, PF has poor water retention and high fat and protein oxidation, so RF freezing is better than PF. PF is not suitable for mackerel thawing. In conclusion, SF is the best freezing method to maintain the quality of mackerel.
Acknowledgments
This research was financially supported by the National Key R&D Program of China (2019YFD0901603), the Key Project of Science and Technology Commission of Shanghai Municipality (19DZ1207503), and the Shanghai Professional Technology Service Platform on Cold Chain Equipment Performance and Energy Saving Evaluation (20DZ2292200). All authors have read and agreed to the published version of the manuscript.
Disclosure statement
The authors declare no conflict of interest.
Additional information
Funding
References
- Wang, X. Q.; Xing, R. E.; Chen, Z. Y.; Yu, H. H.; Li, R. F.; Li, P. C . Effect and Mechanism of Mackerel (Pneumatophorus Japonicus) Peptides for Anti-fatigue. Food Funct. 2014, 5(9), 2113–2119.
- Sone, I.; Sveinsdóttir, H. I.; Stefánsson, G.; Larsson, K.; Undeland, I.; Skåra, T.; Romotowska, P. E. Karlsdóttir, M. G. Investigating Commercially Relevant Packaging Solutions to Improve Storage Stability of Mechanically Filleted Atlantic Mackerel (Scomber Scombrus) Produced under Industrial Conditions. Eur. Food Res. Technol. 2020, 246(4), 693–701.
- Tan, B. B., Sun, N.; Li, C.; Zhang, J. J.; Yang, W. G. Structure, Functional Properties and Iron Bioavailability of Pneumatophorus Japonicus Myoglobin and Its Glycosylation Products. Int. J. Biol. Macromol. 2021, 173, 524–531. DOI: 10.1016/j.ijbiomac.2021.01.138.
- Moriwaki, T.; Kimizuka, N., and Omata, S. Microscopic Elastic Structure Mapping of Frozen Tuna (Thunnus Orientalis) via Scanning Haptic Microscopy. Journal of Food Engineering. 2021, 293 , 110383.
- Sun, Q. X.; Sun, F.; Xia, X.; Xu, H.; Kong, B. The Comparison of Ultrasound-assisted Immersion Freezing, Air Freezing and Immersion Freezing on the Muscle Quality and Physicochemical Properties of Common Carp (Cyprinus Carpio) during Freezing Storage. Ultrason. Sonochem. 2019, 51, 281–291. DOI: 10.1016/j.ultsonch.2018.10.006.
- Wang, Y.; Wang, X.; Wang, Z.; Li, X.; Li, C.; Xu, B. Effects of Different Freezing Methods on the Quality of Conditioned Beef Steaks during Storage. J. Food Process. Preserv. 2020, 44(7). doi:10.1111/jfpp.14496
- LeBail, A.; Chevalier, D.; Mussa, D. M.; Ghoul, M. High Pressure Freezing and Thawing of Foods: A Review. Int. J. Refrig.-Revue Int. Du Froid. 2002, 25(5), 504–513. DOI: 10.1016/S0140-7007(01)00030-5
- Tan, M. T.; Mei, J.; Xie, J. The Formation and Control of Ice Crystal and Its Impact on the Quality of Frozen Aquatic Products: A Review. Crystals. 2021, 11(1), 68. DOI: 10.3390/cryst11010068.
- Leygonie, C.; Britz, T. J.; Hoffman, L. C. Impact of Freezing and Thawing on the Quality of Meat: Review. Meat Sci. 2012, 91(2), 93–98. DOI: 10.1016/j.meatsci.2012.01.013.
- Zhang, M. C.; Haili, N.; Chen, Q.; Xia, X.; Kong, B. Influence of Ultrasound-assisted Immersion Freezing on the Freezing Rate and Quality of Porcine Longissimus Muscles. Meat Sci. 2018, 136, 1–8. DOI: 10.1016/j.meatsci.2017.10.005.
- Yu, L. X.; Jiang, Q.; Yu, D.; Xu, Y.; Gao, P.; Xia, W. Quality of Giant Freshwater Prawn (Macrobrachium Rosenbergii) during the Storage at −18°C as Affected by Different Methods of Freezing. Int. J. Food Prop. 2018, 21(1), 2100–2109.
- Lv, Y.; Chu, Y. M.; Zhou, P. C.; Mei, J.; Xie, J. Effects of Different Freezing Methods on Water Distribution, Microstructure and Protein Properties of Cuttlefish during the Frozen Storage. Appl Sci-Basel.2021, 11(15, 6866).
- Truonghuynh, H. T.; LI, B.; ZHU, H.; Guo, Q.; LI, S. Freezing Methods Affect the Characteristics of Large Yellow Croaker (Pseudosciaena Crocea): Use of Cryogenic Freezing for Long-term Storage. Food Sci. Technol. 2020, 40(suppl 2), 429–435.
- Wang, Y. Y; Rashid, M. T.; Yan, J. K.; Ma, H. L. Effect of Multi-frequency Ultrasound Thawing on the Structure and Rheological Properties of Myofibrillar Proteins from Small Yellow Croaker. Ultrason. Sonochem. 2021, 70 , 1053252.
- Zhou, P. C.; Xie, J. Effect of Different Thawing Methods on the Quality of Mackerel (Pneumatophorus Japonicus). Food Sci. Biotechnol. 2021, 30(9), 1213–1223. DOI: 10.1007/s10068-021-00966-0.
- Choi, E. J.; Park, H. W.; Chung, Y. B.; Park, S. H.; Kim, J. S.; Chun, H. H. Effect of Tempering Methods on Quality Changes of Pork Loin Frozen by Cryogenic Immersion. Meat Sci. 2017, 124, 69–76. DOI: 10.1016/j.meatsci.2016.11.003.
- Wang, J. F.; Yu, W. H., and Xie, J. Effect of Glazing with Different Materials on the Quality of Tuna during Frozen Storage. Foods. 2020, 9(2, 231).
- Li, P. Y.; Chen, Z.; Tan, M.; Mei, J.; Xie, J. Evaluation of Weakly Acidic Electrolyzed Water and Modified Atmosphere Packaging on the Shelf Life and Quality of Farmed Puffer Fish (Takifugu Obscurus) during Cold Storage. J. Food Saf. 2020, 40(3). doi:10.1111/jfs.12773
- Liu, W. R.; Mei, J.; Xie, J. Effect of Locust Bean Gum-sodium Alginate Coatings Incorporated with Daphnetin Emulsions on the Quality of Scophthalmus Maximus at Refrigerated Condition. Int. J. Biol. Macromol. 2021, 170, 129–139. DOI: 10.1016/j.ijbiomac.2020.12.089.
- Tan, M. T; Li, P. Y.; Yu, W. H.; Wang, J. F.; Xie, J. Effects of Glazing with Preservatives on the Quality Changes of Squid during Frozen Storage. Appl Sci-Basel.2019, 9(18, 3847).
- Chu, Y. M.; Tan, M.; Yi, Z.; Ding, Z.; Yang, D.; Xie, J. Shelf-Life Prediction of Glazed Large Yellow Croaker (Pseudosciaena Crocea) during Frozen Storage Based on Arrhenius Model and Long-Short-Term Memory Neural Networks Model. Fishes. 2021, 6(3), 39.
- Wang, X. S.; Xie, J. Quality Attributes of Horse Mackerel (Trachurus Japonicus) during Frozen Storage as Affected by Double-glazing Combined with Theaflavins. Int. J. Food Prop. 2021, 24(1), 713–725. DOI: 10.1080/10942912.2021.1919702.
- Fan, M. C.; Hu, T.; Zhao, S.; Xiong, S.; Xie, J.; Huang, Q. Gel Characteristics and Microstructure of Fish Myofibrillar Protein/cassava Starch Composites. Food Chem. 2017, 218, 221–230. DOI: 10.1016/j.foodchem.2016.09.068.
- Li, N.; Shen, Y.; Liu, W. R.; M, J.; Xie, j. Low-Field NMR and MRI to Analyze the Effect of Edible Coating Incorporated with MAP on Qualities of Half-Smooth Tongue Sole (Cynoglossus Semilaevis Gunther) Fillets during Refrigerated Storage. Appl Sci-Basel.2018, 8(8, 1391).
- Petzold, G.; Aguilera, J. M. Ice Morphology: Fundamentals and Technological Applications in Foods. Food Biophys. 2009, 4(4), 378–396. DOI: 10.1007/s11483-009-9136-5.
- Ying, Y.; Xiang, Y.; Liu, J.; Chen, X.; Hu, L.; Li, Y.; Hu, Y. Optimization of Ultrasonic-assisted Freezing of Penaeus Chinensis by Response Surface Methodology. Food Qual. Saf. 2021, 5, 1–9. DOI: 10.1093/fqsafe/fyaa034.
- Charoenrein, S.; Preechathammawong, N. Undercooling Associated with Slow Freezing and Its Influence on the Microstructure and Properties of Rice Starch Gels. J. Food Eng. 2010, 100(2), 310–314. DOI: 10.1016/j.jfoodeng.2010.04.014.
- Park, D. H.; Lee, S.; Kim, E. J.; Ji, Y. R.; Wi, G.; Choi, M.-J. Freshness of Deep Frozen Mackerel and Croaker during Long-term Storage. Int. J. Food Prop. 2021, 24(1), 89–104.
- Hughes, J. M.; Oiseth, S. K.; Purslow, P. P.; Warner, R. D. A Structural Approach to Understanding the Interactions between Colour, Water-holding Capacity and Tenderness. Meat Sci. 2014, 98(3), 520–532.
- Zhang, M.; Xia, X.; Liu, Q.; Chen, Q.; Kong, B. Changes in Microstructure, Quality and Water Distribution of Porcine Longissimus Muscles Subjected to Ultrasound-assisted Immersion Freezing during Frozen Storage. Meat Sci. 2019, 151, 24–32. DOI: 10.1016/j.meatsci.2019.01.002.
- Tironi, V.; de Lamballerie, M.; Le-Bail, A. Quality Changes during the Frozen Storage of Sea Bass (Dicentrarchus Labrax) Muscle after Pressure Shift Freezing and Pressure Assisted Thawing. Innovative Food Sci. Emerg. Technol. 2010, 11(4), 565–573. DOI: 10.1016/j.ifset.2010.05.001.
- Chan, S. S.; Roth, B.; Jessen, F.; Løvdal, T.; Jakobsen, A. N.; Lerfall, J. A Comparative Study of Atlantic Salmon Chilled in Refrigerated Seawater versus on Ice: From Whole Fish to Cold-smoked Fillets. Sci. Rep. 2020, 10(1). doi:10.1038/s41598-020-73302-x
- Hu, Y. M.; Zhang, N.-H.; Wang, H.; Yang, Y.-F.; Tu, Z.-C. Effects of Pre-freezing Methods and Storage Temperatures on the Qualities of Crucian Carp (Carassius Auratus Var. Pengze) during Frozen Storage. J. Food Process. Preserv. 2021, 45(2). doi:10.1111/jfpp.15139
- Cheng, J. H.; Qu, J.-H.; Sun, D.-W.; Zeng, X.-A. Visible/near-infrared Hyperspectral Imaging Prediction of Textural Firmness of Grass Carp (Ctenopharyngodon Idella) as Affected by Frozen Storage. Food Res. Int. 2014, 56, 190–198. DOI: 10.1016/j.foodres.2013.12.009.
- Xia, Z.; Liu, B.; Xia, Z.; Zhai, X. Determination of Electrical Conductivity of Cadaver Skeletal Muscle: A Promising Method for the Estimation of Late Postmortem Interval. J. Forensic Sci. Med. 2015, 1(1), 16. DOI: 10.4103/2349-5014.155554
- Fan, H. B.; Luo, Y.; Yin, X.; Bao, Y.; Feng, L. Biogenic Amine and Quality Changes in Lightly Salt- and Sugar-salted Black Carp (Mylopharyngodon Piceus) Fillets Stored at 4 Degrees C. Food Chem. 2014, 159, 20–28. DOI: 10.1016/j.foodchem.2014.02.158.
- Shirsat, N.; Lyng, J. G.; Brunton, N. P.; McKenna, B. Ohmic Processing: Electrical Conductivities of Pork Cuts. Meat Sci. 2004, 67(3), 507–514.
- Silbande, A.; Adenet, S.; Chopin, C.; Cornet, J.; Smith-Ravin, J.; Rochefort, K.; Leroi, F. Effect of Vacuum and Modified Atmosphere Packaging on the Microbiological, Chemical and Sensory Properties of Tropical Red Drum (Sciaenops Ocellatus) Fillets Stored at 4 Degrees C. Int. J. Food Microbiol. 2018, 266, 31–41. DOI: 10.1016/j.ijfoodmicro.2017.10.015.
- Li, Z. Y.; Li, L. Q.; Zhang, Y. C.; He, Q. Frozen Kinetics Models for Sensory, Chemical, and Microbial Spoilage of Preserved Razor Clam (Sinonovacula Constricta) at Different Temperatures. Int. J. Food Eng. 2020, 16(11, 20190288).
- Sone, I.; Skara, T.; Olsen, S. H. Factors Influencing Post-mortem Quality, Safety and Storage Stability of Mackerel Species: A Review. Eur. Food Res. Technol. 2019, 245(4), 775–791. DOI: 10.1007/s00217-018-3222-1.
- Suh, S.; Kim, Y. E.; Shin, D.; Ko, S. Effect of Frozen-storage Period on Quality of American Sirloin and Mackerel (Scomber Japonicus). Food Sci. Biotechnol. 2017, 26(4), 1077–1084.
- Benjakul, S.; Bauer, F. Biochemical and Physicochemical Changes in Catfish (Silurus Glanis Linne) Muscle as Influenced by Different Freeze-thaw Cycles. Food Chem. 2001, 72(2), 207–217. DOI: 10.1016/S0308-8146(00)00222-3.
- Hong, H.; Regenstein, J. M.; Luo, Y. K. The Importance of ATP-related Compounds for the Freshness and Flavor of Post-mortem Fish and Shellfish Muscle: A Review. Crit. Rev. Food Sci. Nutr. 2017, 57(9), 1787–1798. DOI: 10.1080/10408398.2014.1001489.
- Shi, J.; Lei, Y.; Shen, H.; Hong, H.; Yu, X.; Zhu, B.; Luo, Y. Effect of Glazing and Rosemary (Rosmarinus Officinalis) Extract on Preservation of Mud Shrimp (Solenocera Melantho) during Frozen Storage. Food Chem. 2019, 272, 604–612. DOI: 10.1016/j.foodchem.2018.08.056.
- Fourati, M.; Smaoui, S.; Ben Hlima, H.; Ennouri, K.; Mtibaa, A. C.; Sellem, I., Elhadef, K.; Mellouli, L. Synchronised Interrelationship between Lipid/protein Oxidation Analysis and Sensory Attributes in Refrigerated Minced Beef Meat Formulated with Punica Granatum Peel Extract. Int. J. Food Sci. Technol. 2020, 55(3), 1080–1087.
- Tan, M. T.; Ye, J.; Chu, Y.; Xie, J. The Effects of Ice Crystal on Water Properties and Protein Stability of Large Yellow Croaker (Pseudosciaena Crocea). Int. J. Refrig. 2021, 130, 242–252. DOI: 10.1016/j.ijrefrig.2021.05.040.
- Sharifian, A.; Soltanizadeh, N.; Abbaszadeh, R. Effects of Dielectric Barrier Discharge Plasma on the Physicochemical and Functional Properties of Myofibrillar Proteins. Innovative Food Sci. Emerg. Technol. 2019, 54, 1–8. DOI: 10.1016/j.ifset.2019.03.006.
- Carbonaro, M.; Nucara, A. Secondary Structure of Food Proteins by Fourier Transform Spectroscopy in the Mid-infrared Region. Amino Acids. 2010, 38(3), 679–690. DOI: 10.1007/s00726-009-0274-3.
- Liu, Y.; Hu, W.; Guo, X. X.; Wang, X. C.; Sun, S. Q.; Xu, C. H. Rapid Discrimination of Three Marine Fish Surimi by Tri-step Infrared Spectroscopy Combined with Principle Component Regression. Spectrochim. Acta Part a-Mol. And Biomol Spectrosc 2015,149, 516–522. DOI: 10.1016/j.saa.2015.04.116.
- Lan, W. Q.; Zhang, W.-J.; Liu, J.-L.; Xie, J. Effects of Precooling with Slurry Ice on the Freshness of Farmed Perch (Lateolabrax Japonicus) during Logistics Process. J. Aquat. Food Prod. Technol. 2021, 30(2), 162–175.