
 ?Mathematical formulae have been encoded as MathML and are displayed in this HTML version using MathJax in order to improve their display. Uncheck the box to turn MathJax off. This feature requires Javascript. Click on a formula to zoom.
ABSTRACT
Among physical attributes, dimensions and weight of agricultural products are important parameters that are useful for designing grading/packaging systems. Size and weight measurements usually require extensive time and labor. Moreover, it is often difficult to accurately do the measurements for the products having irregular shapes, such as sweet potatoes. Even though there are many previous works on the topic, they either lack accuracy or require multiple captures and computing power to reconstruct the three-dimensional representation of the products. This paper proposes the measurement of sweet potato features, including the body length, width, and thickness, by using a simple vision system that requires only a single camera to capture a top-view image of the products. After the background segmentation step, the product is virtually sliced into many equal slices along the longitudinal axis. The volume of the product is calculated as the summation of the volumes of these individual slices. Since there is a high correlation between the products’ weight and volume, the weight of the product can be calculated. The experimental results obtained show that the proposed approach is accomplished with highly competitive results, which have an accuracy of up to 96% (with an R2 of 0.98) for the volume estimation task and an accuracy of up to 95% (with an R2 of 0.96) for the weight estimation task. Due to its simplicity, this model can be used to design and develop the sizing/weighing/packaging systems.
Introduction
According to the Observatory of Economic Complexity (OEC), the productions of sweet potato had a total trade of $604 million over the world in 2018.[Citation1] Statistically, the United States was the top exporter of sweet potatoes with $207 million, while the Netherlands led the importers ranking with $105 million. This kind of tuberous roots is one of the main crops in providing food not only for humans but also for animal husbandry. In addition, it is also considered as a raw material for the factories to create many highly economic value products.[Citation2] Based on research results on food and nutrition in the study by Bovell-Benjamin,[Citation3] sweet potato has many key compounds that help the human diet. Nevertheless, its true value has not been recognized widely in the food system and food market.
With the rapid escalation of food consumption in recent years that causes food insecurity, improving productivity and reducing manufacturing costs are possible solutions. In a typical fruit/vegetable sorting/packaging production line, size and weight monitoring and measurement are important steps to ensure the quality of the products. For small-scale production lines, a digital scale can be used to weigh the products. However, for a large-scale production line, one of the most popular devices that can efficiently measure the mass of the product on the conveyor belt is the strain gauge load cell.[Citation4,Citation5] For instance, Mettler Toledo company releases a load cell-integrated conveyor belt that can measure 250 packets per minute, and A&D Inspection reveals a Checkweigher with the latest technology that has a throughput of up to 320 packets per minute.[Citation6,Citation7] The strain gauge load cells convert the expansion or contraction of a material or the strain (resistance) to generate an electrical signal, and the signal is filtered and converted to weight value using an analog-to-digital converter (ADC) and related circuits. However, these load cells need to be maintained as well as re-calibrated after a period of usage time to ensure accuracy. The added hardware complexity significantly increases the cost of the conveyor belt; therefore, it becomes harder to be applied widely in many developing countries due to high investment costs.
Various research studies are focusing on different agricultural products such as carrot, cucumber, and citrus fruit.[Citation8–31] Some work has yielded good results in estimating volume as well as weight such as 3D reconstruction[Citation15–20] and disk method .[Citation22–26] However, there is not much work for the products having irregular shapes, such as sweet potatoes. Malcolm et al. estimated volume and surface area of sweet potato by using 3D vision-based method.[Citation32] In this result, only two group grade 1 sweet tubers are collected in 1983 and 1984. They placed each tuber on the rotating wheel. Then, they captured 18 images per potato with a rotation of 10 degrees per image. Each grade 1 tuber’s volume is assumed as a prolate spheroid volume by using Eq. (1). In addition, the authors also applied Eq. (2) to calculate its surface area.
where V is the volume (m3), A is the surface area (m2), a is the semi-major axis (m), b is the semi-minor axis (m), and e is equal to , the eccentricity. Another research from Oyefeso’s team also used computer vision to estimate the volume of the Nigerian tuber.[Citation33] They proposed linear regression models using external dimensions and projected areas as inputs. Even though the accuracy for the mass model based on the projected area along the longitudinal plane is high (R2 = 0.98 for mass and R2 = 0.97 for volume), this method is applicable for a specific type of feature and product.
The objectives of this research are to derive a volume/mass model for sweet potatoes based on their physical attributes obtained using a top-view image captured by a camera. The information obtained using the top-view image together with known cross-sectional shapes is used to estimate the product’s volume. The proposed model achieves an accuracy of up to 96% (with an R2 of 0.98) for the volume estimation task. Based on the obtained relationship between mass and volume of sweet potatoes, the mass/weight of the product can be derived. For the task of weight estimation, the model achieves an accuracy of up to 95% (with an R2 of 0.96).
Materials and methods
Measurement tools
There are three main steps: data acquisition, vision-based processing, and size and volume estimation. For the data acquisition step, manually taking the reference size, volume, and mass of a sweet potato is carried out. The vision-based processing step is to process the intake images and return pixel/millimeter, which is then fed into the last step to obtain the results of size and volume estimation. An overview of all of the steps is shown in .
Figure 1. The general flow chart of the proposed method.
Data acquisition and vision-based processing
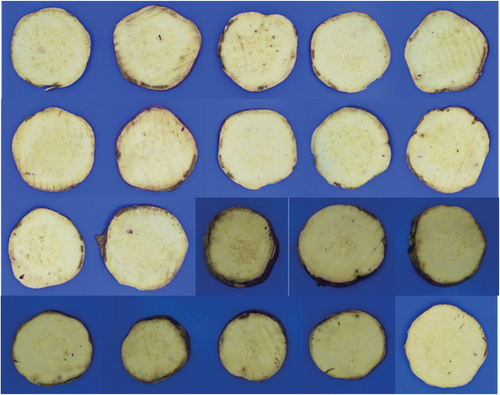
Two hundred and thirty-three sweet potato samples were randomly taken from a supermarket and flea market on the same day. Depending on the pressure from underground as well as gene, the shape of each sample is not consistent, which is shown in . However, after investigating 400 slices from 20 different samples, as shown in , it can be concluded that each cross-section is nearly axisymmetric and considered to be an elliptical shape. Then, each cross-section is fit with the elliptical equation. The width/height ratio is measured and obtained with an average value of 0.93.
Figure 2. Some examples of shapes of Japanese sweet potato grown in Vietnam.
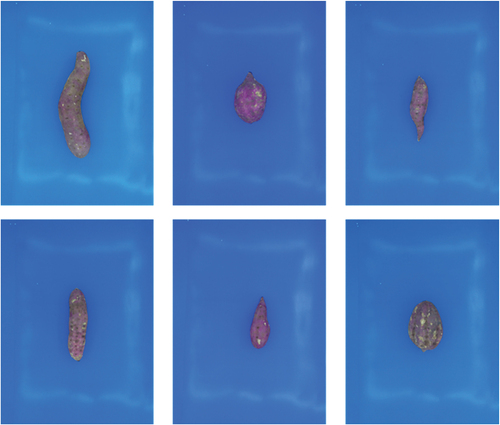
Figure 3. Some samples of sweet potato’s cross-section.
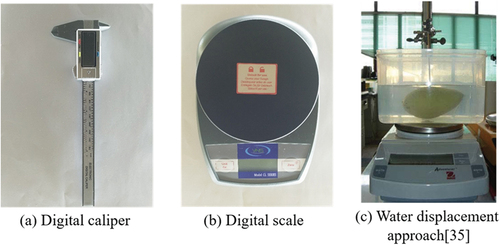
The size and volume of sweet potato are measured by standard laboratory methods. A digital caliper with accuracy ±0.1 mm, as shown in (a), is used to measure the linear dimensions of the collected sample. Then, the electronic scale, as shown in (b), with the division of 0.1 g and the ability to measure up to 2 kg is used to find the mass of sweet tuber. Afterward, the volume is measured manually by using the water displacement method (WDM), which is currently one of the most accurate and fastest methods ( (c)). This step is similar to that in the study by Chalidabhongse et al.[Citation34]
Figure 4. Measurement tools.
With these properties, there are many available methods to calculate fruit/vegetable’s volume, such as linear regression,[Citation8] ANN,[Citation8,Citation19,Citation30] 3D reconstruction,[Citation15–20] and disk method.[Citation22–26] However, Huynh et al.[Citation35] proposed the chopped pyramid method that can measure axisymmetric agricultural products and achieved a very promising result against other methods. This method is summarized in the next section.
Size and volume measurement
Chopped pyramid methodology
A sweet potato is firstly virtually sliced into many parallel parts. For each part, it is assumed as the chopped pyramid, as illustrated in . Its volume is calculated by Eq.Equation(3)(3)
(3) .
Figure 5. Chopped pyramid method.
where B and (
constant) are the areas of the top and bottom surfaces of each chopped pyramid, respectively.
Areas of and
are calculated by EquationEqs. (4)
(4)
(4) and (Equation5
(5)
(5) ).
where are the minor and major diameters of the surface
, respectively, and
are the minor and major diameters of the surface
, respectively. These parameters are described in ). As the cross-sections of Japanese sweet tuber grown in Vietnam are nearly elliptical, each chopped pyramid is illustrated in . In more detail, the elliptical cone shape on the top and bottom of the sweet tuber is illustrated in and , respectively. For these parts, EquationEq. (6)
(6)
(6) is applied to estimate its volume.
Figure 6. Sweet potato illustration.
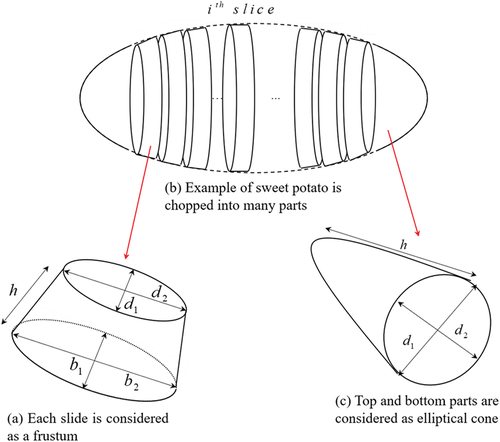
where are the minor and major axes, which are shown in , of the elliptical cone, respectively. Once all the estimated volumes of each chopped pyramid are collected, EquationEq. (7)
(7)
(7) is used to estimate the whole volume of the sweet potato by summing all of the volumes of the cross-section.
Hardware setup
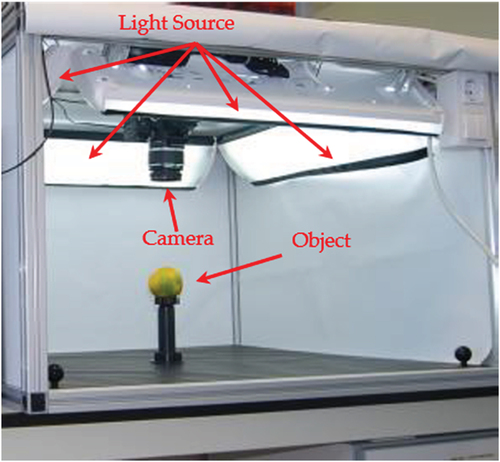
A chamber with an aluminum frame is built, where a digital camera (CANON 60D with lens Tamron 17–50 mm, f2.8 embedded) is placed on top of the frame such that it can capture the top view of the object. This is shown in . Four surrounding LED light tubes are embedded inside the chamber to avoid shadow and noise. In addition, the background color of the object can be modified by changing the color at the bottom of the frame. All the samples are firstly captured by the digital camera in this chamber, and the system automatically calibrates the pixel/millimeter square to estimate size, volume, and mass.
Figure 7. Schematic of the experimental setup.
An estimation of volume using chopped pyramid is carried out first by using Python programming language. An open-source OpenCV library is also imported to perform the bounding box segmentation, as shown in . The bounding box is the smallest rectangle that fully encloses the product. The experimental result has shown that the bounding box obtained is accurate and insensitive to the product rotation angle as shown in the study by Huynh et al.[Citation35]
Figure 8. An example of image-processing steps: (a) Original image; (b) background subtraction; and (c) bounding box and slices used to calculate volume.
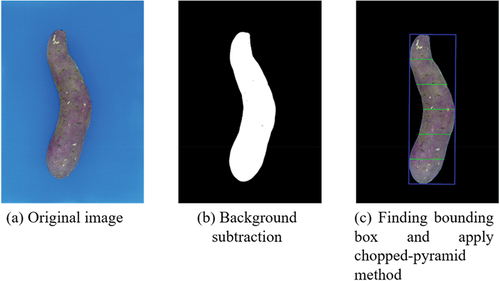
One of the most popular methods to extract the background of an object in the image is based on the thresholding value. In this research, RGB thresholding is applied. The blue color is chosen as the background so the bottom of the chamber is set up as blue, which is depicted in . Once the original image has been collected, the background color is extracted for the further step, as illustrated in . In this case, a threshold of 100 is chosen for the blue channel. If a different background colour is applied or lighting condition, this threshold value must be recalibrated.
In machine vision, the processing step is reduced if the rotation angle of an object is known. Once the four corners’ coordinates of the bounding box are collected, the length of the sweet potato will be estimated by the pixel per centimeter as calculated in the previous section. Then, the chopped pyramid method is applied. The sweet potato is chopped into many parallel slices with the two areas B and B’ of each slice. This combines with the average width/height ratio of the cross-section to get all the parameters required for EquationEq. (3)(3)
(3) to have the volume of each slice. Next, by using EquationEq. (5
(5)
(5) ), the whole volume of the sweet potato is estimated.
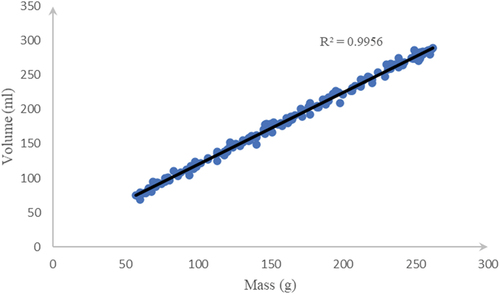
Next, an estimation of mass is carried out. The correlation between volume and mass of Japanese sweet tuber grown in Vietnam is shown in . From the observation on data samples in this figure, the correlation is very high (R2 = 0.99). Therefore, 70% (163 samples) of the dataset are taken to find the correlation as well as the volume–mass linear equation (Equationequation (8)(8)
(8) ).
Figure 9. Correlation between volume and mass of our samples of Japanese sweet potato grown in Vietnam.
Result and discussion
Volume estimation of sweet potato using chopped pyramid method
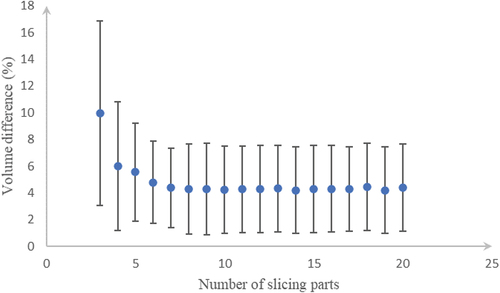
The mean, standard deviation, and maximum and minimum values of reference volume and reference mass as well as the estimated volume and mass of sweet tuber are shown in . Firstly, the suitable number of slices that have the most accurate estimated volume is taken into account. A number of 3–20 slices are tested, and our system returns the lowest error at 10 slices (4.14%) for the Japanese sweet potato grown in Vietnam. This is shown in .
Table 1. Statistical properties of 233 samples of Japanese sweet potato grown in Vietnam
Figure 10. Error in volume estimation versus the number of slices.
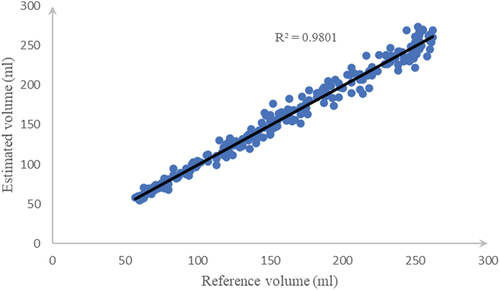
In linear regression, the R-squared (R2) value indicates how the model fits with the actual data. R2 is always between 0 and 1 or 0% and 100%. Referred to , the correlation between estimated volume and reference volume is very high (R2 = 0.98), which is very close to 1, and the accuracy yields around 98% in calculating the tuber’s volume.
Figure 11. Correlation between estimated volume and reference volume measured by water displacement method.
The next comparison is presented by paired t-test to determine whether two groups of our data are different from the results obtained in the study by Ross and Willson.[Citation36] The obtained results are given in . The p-value (p = 0.59) proved that the estimated volume and the reference volume are not statistically significant at the 5% level due to p > 0.05. In addition, the mean and deviation for the volume difference are 0.3 (ml) and 8.76 (ml), respectively.
Table 2. Paired-sample t-test between estimated and reference volume
Moreover, the Bland–Altman plots are presented in .[Citation37] It is straightforward to conclude that the differences between the estimated volumes and the reference volumes are normally distributed because almost all of the estimated samples are lying inside the outer boundary lines (95% limit of agreement).
Figure 12. Bland–Altman plots (95% of agreement) for the volume difference (ml) between estimated and reference volume.
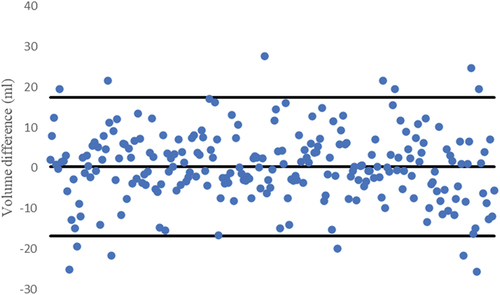
Figure 13. An example of white pixel area representing the projected areas along with the longitudinal axis (PAL) of the sweet potato.
Volume and mass estimation of sweet potato using linear model based on longitudinal projected area
As introduced by Oyefeso et al.,[Citation33] the volume and mass of Nigerian grown sweet tuber had been researched. The authors applied several linear models and obtained some significant results. The highest R2 values belong to the models formulated on the projected areas along with the longitudinal axis (PAL), which are listed in .
Table 3. Mass and volume model for Nigerian sweet potato[Citation33].
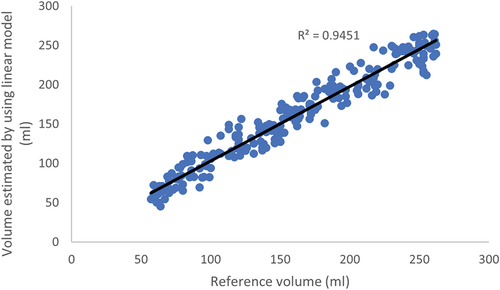
In this section, a method by Oyefeso et al.,[Citation33] linear regression model, is applied to estimate the mass and volume of 233 samples of Japanese sweet potato grown in Vietnam. The longitudinal projected area as the white pixels is depicted in . The input variable is the projected areas along the longitudinal axis, and the results of each model are shown in and the correlation plots are also depicted in and .
Table 4. Mass and volume model for Japanese sweet potato grown in Vietnam
Figure 14. Correlation between estimated and reference value when applying mass model.
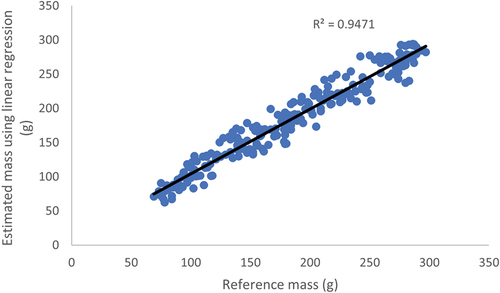
Figure 15. Correlation between estimated and reference value when applying volume model.
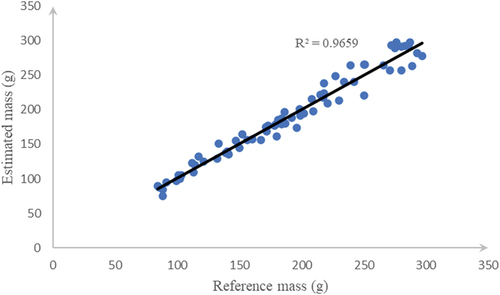
Mass estimation
The mass of the remaining 70 samples is estimated by using EquationEq. (8)(8)
(8) . The obtained results show an accuracy of up to 96% for the mass estimation. In addition, the coefficient of determination (R2) is 0.96. It is shown in .
Figure 16. Correlation between estimated and reference mass of Japanese sweet potato grown in Vietnam.
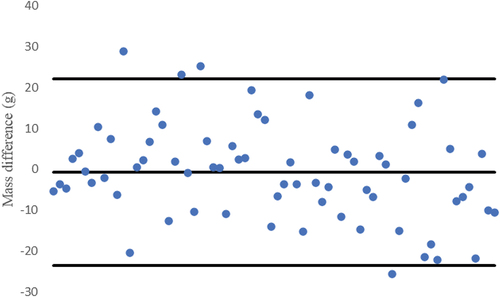
The paired mean t-test is also applied. As shown in , between the estimated and reference masses, the mean is −0.72 ml and the standard deviation is 11.77. The p value is obtained as 0.61, which is greater than 0.05 so there is no statistical significance at the 5% level between the estimated and reference masses.
Table 5. Paired t-test analyses between the two volume measurement methods
The deviation of mass difference is also depicted in . From that figure, there are only three samples that lie outside the range of a 95% limit of agreement. Furthermore, the execution time for each image through different resolutions is summarized in . With the resolution of 3120 × 4160, the proposed approach has achieved 0.13 s/image combining with the high correlation (R2 = 0.99) between mass and volume of Japanese sweet potato grown in Vietnam. In addition, three other common resolutions such as 1536 × 2048, 1080 × 1440, and 768 × 1024 are tested. The execution time obtained is reduced gradually to around 0.1 s. They are 0.039, 0.022, and 0.013 s, respectively. Furthermore, the accuracy only reduces from 0.5% to 1.7% for the lowest resolution of the test list (768 × 1024 pixels).
Table 6. Execution time through resolution
Figure 17. Bland–Altman plot for the mass difference between the proposed method and water displacement method.
Volume and mass estimation using 3D reconstruction
In order to validate the proposed method, the obtained results are compared with the performance of another method, the 3D reconstruction method.[Citation35] The same approach of 3D reconstruction method in the study by Huynh et al.[Citation35] is applied by placing four cameras surrounding the fruit. One example of 3D reconstruction image of the potato is shown in . This reconstruction method has yielded a highly accurate result of up to 97%. However, the setting up, capturing step, and computational process are very time-consuming. In addition, the costs are high due to the complicated hardware system consisting of a high-performance computer, multiple cameras, and a rotating platform used for image capturing.
Figure 18. An example of 3D point cloud of sweet potato.
Conclusion
In this paper, a model for the quality control inspection of sweet potatoes using machine vision application has been successfully developed. The proposed hardware configuration uses only one camera mounted on top of the product to capture a single top-view image and does not need any alignment step. After undergoing a background segmentation, the product image was virtually sliced into many equal slices along the longitudinal axis. The volume of the product is the summation of the volumes of these individual slices. The mass/weight can be calculated using a known correlation between the products’ weight and volume. Experimental results with lots of samples show that the approach achieves highly competitive results as follows. For the volume estimation, an accuracy of up to 96% (with an R2 of 0.98) is achieved, while an accuracy of up to 95% (with an R2 of 0.96) is obtained for weight estimation. Due to its simplicity and efficiency, our model can be used to design and develop the sizing/weighing/packaging systems. Our model currently achieved a throughput of up to 45 samples/second (without performing code optimization and parallelism using multi-threaded processors), while the proposed method of Chopin et al. can only process up to 5 samples/second.[Citation17] The camera calibration and background subtraction are two of the most important parts in estimating the volume of the product. The accuracy of our approach depends on the accuracy in volume estimation (the higher the variation of the bending shape of an object, the higher the errors). Thus, for possible future work, the improvement of light condition and a camera system with larger size of sensor may be considered. Furthermore, we may apply machine learning models, such as the artificial neural network, together with virtual slicing method to improve the accuracy. Lastly, we may incorporate models to classify potatoes’ defects using a deep learning model, such as RESNET, or using a hybrid framework of combining feature extraction and machine learning as in the study by Pham et al.[Citation38]
Disclosure statement
No potential conflict of interest was reported by the authors.
References
- “Sweet Potatoes, Fresh or Dried (HS: 071420) Product Trade, Exporters and Importers.” https://oec.world/en/profile/hs92/sweet-potatoes-fresh-or-dried?redirect=true (accessed Mar. 03, 2021).
- N, E. H. 20182 min Read, “Eight Innovative New Sweet Potato Products coming to Supermarkets,” The Grocer. https://www.thegrocer.co.uk/new-product-development/eight-innovative-new-sweet-potato-products-coming-to-supermarkets/573060.article (accessed Mar. 03, 2021).
- Bovell-Benjamin, A. C. Sweet Potato: A Review of Its Past, Present, and Future Role in Human Nutrition. Adv. Food Nutr. Res. 2007, 52, 1–59. DOI: 10.1016/S1043-4526(06)52001-7.
- Karaus, A.; Paul, H. Load Cells with Small Nominal Load Based on Strain Gauges Using Thin-film Techniques. Measurement. 1992 Jul, 10(3), 133–139. doi:10.1016/0263-2241(92)90009-S.
- “Types of Load Cells Overview | Transducers & Sensors,” Tacuna Systems. https://tacunasystems.com/knowledge-base/an-overview-of-load-cells/ (accessed Feb. 27, 2021).
- M.-T. I. I. all rights reserved. “C35 AdvancedLine WD Checkweigher.” https://www.mt.com/vn/en/home/products/Product-Inspection_1/checkweighing/C35-Washdown.html (accessed Feb. 27, 2021).
- “2,000g Checkweigher | A&D Inspection.” https://inspection.andonline.com/product/2000g-checkweigher/ad-4961-2kd-2035?commerce_product=13 (accessed Feb. 27, 2021).
- Forbes, K. A., and Tattersfield, G. M. Estimating Fruit Volume from Digital Images. in 1999 IEEE Africon. 5th Africon Conference in Africa (Cat. No. 99CH36342) Cape Town, South Africa, Sep. 1999, vol. 1, pp. 107–112, doi: 10.1109/AFRCON.1999.820775.
- Ibrahim, M. F.; Ahmad Sa’ad, F. S.; Zakaria, A.; Md Shakaff, A. Y. In-Line Sorting of Harumanis Mango Based on External Quality Using Visible Imaging. Sensors. 2016 Nov, 16(11, Art. no. 11), 1753. doi:10.3390/s16111753.
- Rush, S. A.; Maddox, T.; Fisk, A. T.; Woodrey, M. S., and Cooper, R. J. A Precise Water Displacement Method for Estimating Egg Volume. Journal of Field Ornithology. 2009, 80(2), 193–197. DOI:10.1111/j.1557-9263.2009.00222.x.
- Jarimopas, B.; Nunak, T.; Nunak, N. Electronic Device for Measuring Volume of Selected Fruit and Vegetables. Postharvest. Biol. Technol. 2005 Jan, 35(1), 25–31. doi:10.1016/j.postharvbio.2004.06.005.
- Venkatesh, G. V.; Iqbal, S. M.; Gopal, A.; Ganesan, D. Estimation of Volume and Mass of Axi-Symmetric Fruits Using Image Processing Technique. Int. J. Food Prop. 2015 Mar, 18(3), 608–626. doi:10.1080/10942912.2013.831444.
- Sapkal, D. D.; Upasani, A.; Amberkar, D.; Singh, P., and Nijampurkar, P. Volume Estimation of an Object Using 2D Images. International Journal of Pure and Applied Mathematics 2017, 114(12), 333–341.
- Lee, D.-J.; Eifert, J. D.; Zhan, P.; Westover, B. P. Fast Surface Approximation for Volume and Surface Area Measurements Using Distance Transform. OE. 2003 Oct, 42(10), 2947–2955. doi:10.1117/1.1605737.
- Artaso, P.; López-Nicolás, G. Volume Estimation of Merchandise Using Multiple Range Cameras. Measurement. Jul 2016, 89, 223–238. DOI: 10.1016/j.measurement.2016.04.005.
- Siswantoro, J.; Prabuwono, A. S.; Abdulah, A. Volume Measurement of Food Product with Irregular Shape Using Computer Vision and Monte Carlo Method: A Framework. Procedia Technol. Jan 2013, 11, 764–770. DOI: 10.1016/j.protcy.2013.12.256.
- Chopin, J.; Laga, H.; Miklavcic, S. J. A New Method for Accurate, High-throughput Volume Estimation from Three 2D Projective Images. Int. J. Food Prop. 2017 Oct, 20(10), 2344–2357. doi:10.1080/10942912.2016.1236814.
- Lo, F. P.-W.; Sun, Y.; Qiu, J.; Lo, B. Food Volume Estimation Based on Deep Learning View Synthesis from a Single Depth Map. Nutrients. 2018 Dec, 10(12, Art. no. 12), 2005. doi:10.3390/nu10122005.
- Ziaratban, A.; Azadbakht, M.; Ghasemnezhad, A. Modeling of Volume and Surface Area of Apple from Their Geometric Characteristics and Artificial Neural Network. Int. J. Food Prop. 2017 Apr, 20(4), 762–768. doi:10.1080/10942912.2016.1180533.
- Hahn, F.; Sanchez, S. Carrot Volume Evaluation Using Imaging Algorithms. J. Agri. Eng. Res. 2000 Mar, 75(3), 243–249. doi:10.1006/jaer.1999.0466.
- Omid, M.; Khojastehnazhand, M.; Tabatabaeefar, A. Estimating Volume and Mass of Citrus Fruits by Image Processing Technique. J. Food Eng. 2010 Sep, 100(2), 315–321. doi:10.1016/j.jfoodeng.2010.04.015.
- Khojastehnazhand, M.; Omid, M.; Tabatabaeefar, A. Determination of Tangerine Volume Using Image Processing Methods. Int. J. Food Prop. 2010 Jun, 13(4), 760–770. doi:10.1080/10942910902894062.
- Rashidi, M.; Gholami, M.; Abbassi, S. Cantaloupe Volume Determination through Image Processing. J. Agric. Sci. Technol. 2009, 11(5), 623–631.
- Koc, A. B. Determination of Watermelon Volume Using Ellipsoid Approximation and Image Processing. Postharvest. Biol. Technol. 2007 Sep, 45(3), 366–371. doi:10.1016/j.postharvbio.2007.03.010.
- “Full Article: Image Processing Method to Determine Surface Area and Volume of Axi-symmetric Agricultural Products.” https://www.tandfonline.com/doi/full/10.1081/JFP-120015498 (accessed Feb. 27, 2021).
- Wang, T. Y.; Nguang, S. K. Low Cost Sensor for Volume and Surface Area Computation of Axi-symmetric Agricultural Products. J. Food Eng. 2007 Apr, 79(3), 870–877. doi:10.1016/j.jfoodeng.2006.01.084.
- Fellegari, R.; Navid, H. Determining the Orange Volume Using Image Processing. 2011, vol. 9, pp. 180–184, Accessed: Feb. 27, 2021. [Online]. Available: https://scholar.google.com/scholar_lookup?title=Determining+the+orange+volume+using+image+processing&conference=Proceedings+of+the+2011+International+Conference+on+Food+Engineering+and+Biotechnology+(ICFEB+2011)&author=Fellegari,+R.&author=Navid,+H.&publication_year=2011&pages=180%E2%80%93184.
- Chaithanya, C.; Priya, S. Chaithanya: Object Weight Estimation from 2D Images - Google Scholar. ARPN J. Eng. Appl. Sci. Sep 2015, 10(17): 7574–7578.
- Huynh, T.; Dao, S. Highly Efficient Fruit Mass and Size Estimation Using Only Top View Images. Proceedings. 2019, 42(1, Art. no. 1). DOI: 10.3390/ecsa-6-06588.
- Örnek, M. N., and Kahramanli, H. Determining the Carrot Volume via Radius and Length Using ANN. International Journal of Intelligent Systems and Applications in Engineering. 62, Art. no. 2,Jun 2018 10.18201/ijisae.2018642081
- Lee, D.; Kim, S.; Park, M., and Yang, Y. Weight Estimation of the Sea Cucumber (Stichopus Japonicus) Using Vision-based Volume Measurement. Journal of Electrical Engineering and Technology. 2014, 96, 2154–2161. DOI:10.5370/JEET.2014.9.6.2154.
- Malcolm, W.; John, T. The Size and Shape of Typical Sweet Potatoes. Accessed: Feb. 27, 2021. [Online]. Available: https://doi.org/10.13031/2013.30212.
- Oyefeso, B., and Raji, A. O. Estimating Mass and Volume of Nigerian Grown Sweet and Irish Potato Tubers Using Their Geometrical Attributes Adeleke University Journal of Engineering and Technology . 2018 May;1:123–130.
- Chalidabhongse, T.; Yimyam, P., and Sirisomboon, P. 2D/3D Vision-Based Mango’s Feature Extraction and Sorting. in Robotics and Vision 2006 9th International Conference on Control, Automation Singapore, Dec. 2006, pp. 1–6, doi: 10.1109/ICARCV.2006.345248.
- Huynh, T.; Tran, L.; Dao, S. Real-Time Size and Mass Estimation of Slender Axi-Symmetric Fruit/Vegetable Using a Single Top View Image. Sensors. 2020 Jan, 20(18, Art. no. 18), 5406. doi:10.3390/s20185406.
- Ross, A.; Willson, V. L. “Paired Samples T-Test,” in Basic and Advanced Statistical Tests: Writing Results Sections and Creating Tables and Figures; Eds., Ross, A., Willson, V. L. SensePublishers: Rotterdam, 2017 17–19.
- Bland, J. M.; Altman, D. G. Measuring Agreement in Method Comparison Studies. Statistical Methods in Medical Research. 1999 Jun, 8(2), 135–160. doi:10.1177/096228029900800204.
- Pham, T. N.; Tran, L. V.; Dao, S. V. T. Early Disease Classification of Mango Leaves Using Feed-Forward Neural Network and Hybrid Metaheuristic Feature Selection. IEEE Access. 2020, 8, 189960–189973. DOI: 10.1109/ACCESS.2020.3031914.