
ABSTRACT
Osmanthus fragrans (Thunb.) Lour. flowers are important natural resource of phenolic compounds, which have antioxidant activities and have been consumed as functional food and dietary supplements for thousand years. Ultra-performance liquid chromatography coupled with electrochemical detection (UPLC-ECD) was developed to simultaneously analyze the eight phenolic compounds in Osmanthus fragrans flowers collected from different regions across China. The UPLC-ECD fingerprint was established for identification and comprehensive quality control. The antioxidant capacities of Osmanthus fragrans flowers were evaluated, and results were compared with those spectrophotometric antioxidant methods. A highly positive relationship was confirmed between the total peak area of characteristic components in chromatogram and the antioxidant potential determined by spectrophotometry with correlation coefficient greater than 0.80 (p < .01). Grey relational analysis showed that acteoside had the highest degree of correlation with antioxidant capacity. These results provided evidence to support the use of UPLC-ECD as a simple, rapid, and reliable method for electroactive phenolic component determination and antioxidant capacity quantification in vitro system.
Introduction
Oxidative stress is characterized as a dysregulation between the reactive oxygen species (ROS) production and elimination.[Citation1] ROS mainly include free radicals such as superoxide (O2·−), hydroxyl (·OH) radicals, and neutral molecules like hydrogen peroxide (H2O2), hypochlorous acid (HClO) and ozone (O3).[Citation2] They are generated as natural by-products of living organisms by endogenous or from exogenous causes.[Citation3] ROS at low levels are crucial in maintaining body homeostasis and health.[Citation4] However, excessive ROS could disturb the homeostasis and result in many diseases, such as cancer,[Citation5] aging,[Citation6] artherosclerosis,[Citation7] inflammatory injury,[Citation8] neurodegenerative,[Citation9] and cardiovascular diseases.[Citation10]
Research proved that natural antioxidants from edible and medicinal plants and spices, such as phenolic compounds, are capable of counteracting the negative effects of ROS, while also lowering risk of diseases associated with oxidative stress.[Citation11] Osmanthus fragrans (Thunb.) Lour. (O. fragrans) belongs to the Oleaceae family,[Citation12] which widely grows in Asian countries, particularly in the south and middle of China.[Citation13] O. fragrans flowers, valued for its high nutrition and pleasing aromas, are used in the food industry to produce tea, wine, spice, and foods,[Citation14] such as osmanthus pastry, vinegar, scented jam and liqueurs.[Citation15] Recent studies documented that the extract of O. fragrans flowers exhibited high antioxidant properties,[Citation16] which significantly prevent diseases associated with oxidative stress such as nerve injury,[Citation17] cancer,[Citation18] inflammation,[Citation19] Parkinson’s disease[Citation13] and so on. Therefore, more detailed studies of O. fragrans flowers may lead to the development of functional food ingredients and supplements to improve human health through dietary interventions.
Phenolic compounds are confirmed to be the predominant bioactive constituents in O. fragrans flowers.[Citation20] These substances generally possess a low redox potential, which can reduce peroxides, block free radicals and act as singlet oxygen quenchers.[Citation21] To investigate their vitro antioxidant activities, different spectrophotometric methods have been developed, including 2,2-diphenyl-1-picrylhydrazyl (DPPH)[Citation22] and 2,2’-azinobis(3-ethylbenzothiazoline-6-sulfonic acid) (ABTS) radical scavenging capacity assay,[Citation23] ferric reducing antioxidant power (FRAP) assay,[Citation24] and so on. The spectrophotometric methods may have some drawbacks since they are time-consuming[Citation25] and the sensitivity may be affected by multiple factors, such as the background color,[Citation26] and freshness of reagent.[Citation27] Electrochemical methods, due to their higher sensitivity than ultraviolet detection (UV) and diode array detection (DAD) and comparable selectivity to mass spectrometry (MS), could be used to measure the antioxidant activities of electrochemically active compounds, even at extremely low levels.[Citation28] Given these advantages, electrochemical detection has been successfully applied to analyze the antioxidant capacities of many complex matrix samples, such as fruit juice,[Citation29] plant extracts,[Citation30] coffee,[Citation31] wine,[Citation32] and milks.[Citation33]
In this study, Ultra Performance Liquid Chromatography coupled with electrochemical detector (UPLC-ECD) was employed for online assessment of the radical scavenging ability of O. fragrans flowers for their use in the food and pharmacological industries. UPLC-ECD fingerprint of O. fragrans flowers was established for quality control and authenticity. The chromatograms of nineteen batches of O. fragrans flower samples collected from different province of China were compared manually and accessed via similarity evaluation. In addition, eight phenolic compounds of O. fragrans flowers were simultaneously determined by UPLC-ECD method. The total areas of characteristic peaks in chromatogram could be applied for quantifying their antioxidant activity. Pearson correlation analysis among total phenolic contents, total areas of characteristic peaks, and values obtained from the spectrophotometric assays were investigated to verify the approach feasibility.
Materials and methods
Samples and reagents
Nineteen batches of O. fragrans flowers were collected from Guangxi, Anhui, Jiangsu, Zhejiang, Fujian, Hubei, and Yunnan provinces of China. After collection, all the samples were air dried locally in a dark room at room temperature for 1 week and were oven-dried (50 ℃) to acquire constant weight in short time. They were transported and stored in refrigerator at −20 ℃ until analysis at the laboratory (Room NO. B201) in the Institute of Life Science, Zunyi Medical University, Guizhou Province, China. Relative information of these samples was shown in Supplementary Material Table 1SM.
The HPLC grade methanol used for mobile phase was purchased from Merk (Darmstadt, Germany). Gallic acid, potassium citrate, citric acid, Folin-Ciocalteu reagent, DPPH, ABTS, and 2,4,6-Tris(2-pyridyl)-s-triazine (TPTZ) were purchase from Aladdin Bio-Chem Technology Co., Ltd. (Shanghai, China). Reference standards of tyrosol, chlorogenic acid, salidroside, caffeic acid, and p-coumaric acid were from Adamas Reagent Co., Ltd. (Shanghai, China). Reference standards of acteoside, echinacoside, and specnuezhenide were from Pufei De Biotech Co., Ltd. (Chengdu, China). The purities of all standards were greater than 98%, and chemical structures are shown in . Deionized water was obtained using the Purelab Chorus II system (ELGA, UK).
Figure 1. Chemical structures of the compounds.
Sample and standard preparations
The dried O. fragrans flowers were powdered and screened through 50 meshes. Accurately weighted 100.00 mg (± 0.10 mg) of sample power was sonicated with 4.00 ml 50% (v/v) aqueous methanol for 15 min. After centrifugation (10,000 rpm, 5 min), the supernatant was gathered in a clean vial. All sample solutions were diluted 10 times with methanol and filtered by 0.22 μm microporous membranes prior to analysis. Reference standards precisely weighed were dissolved in methanol to prepare the stock solution, with each compound concentration of 1.00 mg/ml. Working standard solutions used for further studies were produced by appropriately diluting stock solution with methanol. All solutions were kept at 4 ℃ for further study.
Spectrophotometric determination of total phenolic content (TPC)
Spectrophotometric methods in this research were performed on a SPECTROstar® Nano microplate reader (BMG LABTECH Co., Offenburg, Germany). TPC of O. fragrans flowers was measured by using the method of Folin-Ciocalteu (FC) and Gallic acid (GA) was employed as a standard.[Citation34] A volume of 0.1 ml of sample extract was mixed with 2.5 ml of 1:10 (v/v) diluted FC reagent and 2.0 ml of 75.0 g/ml sodium carbonate solution. Then the mixture was kept in darkness for 2 h. The absorbances were measured at 760 nm. TPC was calculated as mg of GA equivalents (GAE) per g of sample (mg GAE/g).
Apparatus and chromatographic conditions
Ultimate 3000RS system (Thermo Fisher, Waltham, MA, USA) was equipped with a binary solvent manager, a vacuum degasser, an automatic sampler, and a thermostatic column oven, connected to an electrochemical detector. System control and data processing were carried out on a Chromeleon 7.2 workstation. UPLC-ECD separation was achieved at 45 ℃ on an Acquity BEH Shield RP18 column (2.1 mm×100 mm, 1.7 µm). The injection volume of the test sample was 1.0 μl. The mobile phase consisted of 50 mM citrate-aqueous buffer (pH 2.76) (A) and methanol (B) with constant flow rate of 0.4 ml/min. The gradient program was performed as the following profile: 5.0% B at 0–5 min; 5.0%–6.5% B at 5–8 min; 6.5%–24.0% B at 8–20 min, and re-equilibration at 5% B to 24 min. Electrochemical detection was conducted on a high sensitivity coulometric analytical cell (6011), the potential was set at 700 mV.
Method validation
The calibration curves were established by fitting the data between peak area and the concentration of each phenolic compound. The limits of detection (LOD) and quantification (LOQ) for each compound were defined based on the signal-to-noise ratios reached for 3 and 10, respectively. The precision was measured by analyzing mixed standard solution six times during a single day. The method stability was tested by analyzing the same sample solution every 2 h within 12 h stored at 8 ℃. The repeatability was accessed by six independently replicates prepared from the same O. fragrans flower sample. The results were depicted as the percent relative standard deviation (RSD, %) of measurements. The recovery test was performed to evaluate the accuracy of this assay. Eight standards at known amounts were spiked with accurately weighted preparations of O. fragrans flowers, which were then extracted and analyzed. The recovery was calculated and result was expressed in RSD.
Assays of different antioxidant activities
DPPH radical (DPPH·) scavenging capacity
DPPH radical scavenging ability was assessed using Trolox as a calibration according to the method of Zhang et al.[Citation35] In brief, 0.50 ml of appropriately diluted samples was added into 2.00 ml 0.10 mM DPPH radical solution. After shaken vigorously, the mixture was left in darkness at room temperature for 30 min. The DPPH radical scavenging capacity was evaluated via measuring the absorbance acquired at 517 nm, and DPPH values were expressed as mg of Trolox equivalents (TE) per g of sample (mg TE/g).
ABTS radical cation (ABTS·+) scavenging capacity
ABTS radical scavenging capacity was measured based on the method described by Qiu et al.[Citation36] The ABTSˑ+ solution was prepared by the reaction of ABTS salt (7.00 mM) with an equal volume of potassium persulfate (2.45 mM) and incubated at room temperature for 12–16 h in darkness. Then, the ABTSˑ+ solution was diluted with phosphate-buffered saline until it reached an absorbance of 0.70 ± 0.02 at 734 nm. An aliquot of 1.00 ml of properly diluted sample was added into 2.00 ml of ABTSˑ+ solution and then stored in the dark for 30 min. The absorbance of the resulting solution was read at 734 nm. Trolox was employed as calibration, and ABTS values were reported as mg TE/g.
FRAP assay
The FRAP assay was carried out as reported by Liao et al.[Citation37] The working FRAP reagent was daily prepared by mixing the FeCl3 · 6H2O solution (20 mM in water), 10 mM TPTZ solution (40 mM HCl as solvent), and sodium acetate buffer (300 mM pH 3.6) at a ratio of 1:1:10 (v/v/v). Then, 0.50 ml of different concentrations of sample was mixed with 1.00 ml of freshly prepared FRAP solution thoroughly. After reaction in darkness for 10 min at 37 ℃, the absorbance was recorded at 593 nm. Trolox was employed as calibration, and FRAP values were presented as mg TE/g.
Oxygen radical absorbance capacity (ORAC)
ORAC assay using fluorescein (FL) was performed according to the method adapted from Gallego et al.[Citation38] 20 µl of samples at different concentrations diluted in 75 mM phosphate buffer solution (pH 7.4) were pipetted into the 96-well black microplate and 200 µL of 0.96 µM fluorescein were added. The plate was incubated at 37 ℃ in dark for 15 min. Then, 20 µL of 119 mM AAPH was mixed to initiate the action. The fluorescence intensity was measured exactly every 5 min for 3 h with excitation and emission wavelengths of 485 and 538 nm, respectively. Trolox was used as positive control. The ORAC-FL values of samples were calculated according to the method of Wu et al[Citation39] and expressed as Trolox equivalents (mg TE/g).
Statistical analysis
Following normalization of the data, gray relational analysis[Citation40] between the peak area of characteristic compounds and the DPPH, ABTS, FRAP, and ORAC values of O. fragrans flowers from different regions were conducted. One-way ANOVA analysis of variance followed by Duncan’s test was performed in multi-group comparison. Data analysis was carried out using SPSS 17.0 (SPSS, Inc., Chicago, IL). Correlation was performed using Pearson correlation analysis and p values<.05 was considered to indicate a statistically significant difference.
Results and discussion
Optimization of detection condition
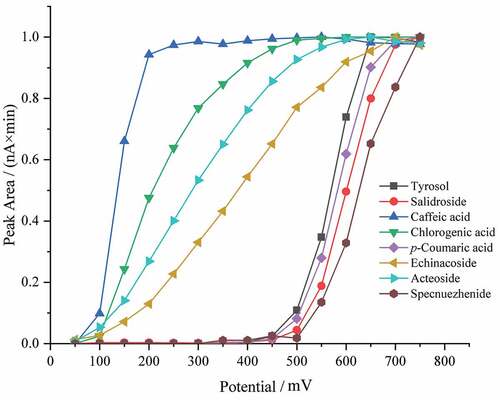
Optimization of ECD condition is crucial for accurate detection of each phenolic compound. To investigate the optimal potential, hydrodynamic voltammetry was used with a mixed standards solution in a range of applied potential from 50 mV to 750 mV. The hydrodynamic voltammogram was established by plotting the peak area against the applied potential. As shown in , it is clear that echinacoside, caffeic acid, chlorogenic acid, and acteoside were oxidized at potential of 50 mV and the peak currents increased along with the increase of applied potential. The signals of tyrosol, salidroside, p-coumatic acid, and specnuezhenide showed sustained increased between 450 mV and 700 mV. When the potential was more than 700 mV, the signals stayed at a plateau. Thus, 700 mV was selected as the optimum potential for subsequent experiments.
Figure 2. Electrochemical responses (peak area) of eight phenolic compounds at various potential settings.
Method validation
As summarized in , the standards curves showed excellent linear relationship with correlation coefficients (r2) exceeded 0.999 within the investigated ranges. The LODs and LOQs for all analytes were ranged from 0.48 to 28.05 ng/ml and 1.60 to 21.08 ng/ml, respectively. The RSDs of precision, stability, and repeatability were less than 1.99%, 4.88%, and 2.87%, respectively. The mean recoveries of the eight phenolic compounds yielded good values ranging from 97.05% to 101.17%, with RSDs lower than 2.59%. Therefore, the UPLC-ECD method can be regarded as sensitive and precise to analyze the O. fragrans flower samples.
Table 1. Calibration curves, r2, linear range, LODs, LOQs, precision, stability, repeatability, and recovery rate of the proposed method (n = 6)
Chromatographic fingerprint and similarity evaluation
To obtain the representative fingerprint, the chromatogram data of the 19 batches of O. fragrans flower samples from different cultivating regions were evaluated by the software called Similarity Evaluation System for Chromatographic Fingerprint of traditional Chinese medicine (Version 2012A).[Citation41] Sixteen characteristic peaks were selected to monitor the quality of O. fragrans flowers (see UPLC-ECD chromatograms in and the reference UPLC-ECD fingerprint in ). Moreover, the similarity value of chromatographic profile of each test sample relative to the reference fingerprint was calculated by using the cosine value of the angle.[Citation42,Citation43]
Figure 3. UPLC-ECD fingerprints of (A) nineteen batches of O. fragrans flowers (S1-S19) and (B) the reference chromatogram. The peaks marked with 1–16 represent the 16 characteristic peaks.
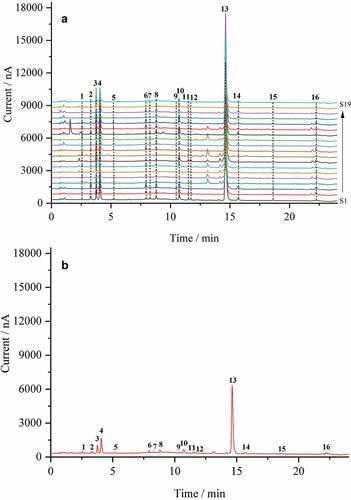
From the data in , it is clear that the similarity value of each O. fragrans flower sample was very close to 1, indicating the quality of different batches of O. fragrans flower samples were consistent. Though the chromatograms were generally similar, the concentration and distribution of the characteristic peaks or some small peaks differ distinctly. The difference in UPLC-ECD fingerprint chromatograms displayed diversity of O. fragrans flowers among different batches. Therefore, the common mode of the 19 batches samples could be used as a reference UPLC-ECD fingerprint for the quality identification and assessment of O. fragrans flowers.
Table 2. Similarity evaluation results of nineteen batches of the O. fragrans flower samples
Quantitative determination of phenolic compounds analysis in O. fragrans flowers
As shown in , based on the proposed UPLC-ECD method, contents of eight phenolic compounds in 19 batches of O. fragrans flowers collected from different regions were simultaneously determined and results are given in . The eight phenolic compounds, which together covered more than 83.13% of the total area, could be detected in all analyzed samples, whereas the levels varied significantly. Their concentrations were in the order of acteoside > specnuezhenide > salidroside > chlorogenic acid > p-coumaric acid > tyrosol > echinacoside > caffeic acid in O. fragrans flowers. Acteoside accounted for about 76.27% of the eight phenolic compounds, which made it the major phenolic substance in O. fragrans flowers. The minor ones were specnuezhenide, salidroside, and chlorogenic acid, representing about 9.32%, 9.29%, and 1.59% respectively. The total amounts of the other four phenolic substances, including tyrosol, echinacoside, caffeic acid, and p-coumaric acid occupied only 3.62% of the total content of eight phenolic compounds.
Table 3. The contents (mg/g) of eight phenolic compounds in nineteen O. fragrans flower samples
Figure 4. UPLC-ECD chromatograms of the mixed standards.
Correlation between the total peak area and the antioxidant activity
To evaluate the correlation between the antioxidant activity and the common peak area of O. fragrans flowers, the total phenolic contents, DPPH, ABTS, FRAP, and ORAC values were determined. As shown in , it is clear that the antioxidant capacities of O. fragrans flower extracts collected from different regions differed notably. In addition, significant and high linear relationships were found among the total peak area of characteristic compounds (A), TPC, DPPH, ABTS, FRAP, and ORAC values, with correlation coefficient greater than 0.80 (). The greater the oxidant peak area, the better the antioxidant capability, indicating the most of the antioxidant potential of O. fragrans flower extracts were ascribed to phenolic compounds.
Table 4. Total characteristic peak area (A), total phenolic content (TPC), and the antioxidant potential of nineteen batches of O. fragrans flowers
Table 5. Correlation coefficients among total characteristic peak area (A), total phenolic content (TPC), and antioxidant capacity of O. fragrans flowers
Gray relational analysis (GRA) is a spectral analysis appropriate to determine the degree of approximation of the factors and variables in large the data sets when there is insufficient information, and according to the analysis result estimate the complex interrelationships between multiple factors and variables.[Citation44] In this work, GRA was applied to further investigate the spectrum–effect relationships between each common peak area and the antioxidant capacity of the nineteen samples. Then the degree of GRA between these two sets of variations were determined, as presented in , the higher the gray grade, the closer the peak-active relationship. Peaks with gray grade over 0.6 were considered to contribute the antioxidant activity. With the average value of the gray grade, peak 13 (acteoside) contributed the most to total antioxidant capability, followed by peaks 7 (chlorogenic acid), 14 (specnuezhenide), and 4 (salidroside). Therefore, UPLC-ECD can be considered practical for the screening of antioxidants. Using A values combined with GRA, the antioxidant activity and the contribution of individual compound to the total antioxidant activity could be evaluated.
Table 6. Correlation coefficients determined by gray relational analysis between the sixteen common peaks and their antioxidant activities of O. fragrans flowers
Conclusion
The study revealed the phenolic profile and antioxidant characteristics of O. fragrans flowers. Nineteen batches of O. fragrans flower samples collected from various regions were determined by UPLC-ECD. Eight phenolic compounds were separated and determined. Moreover, the chromatographic fingerprints of the O. fragrans flower samples were established. The results indicated that UPLC-ECD fingerprint method combined with quantification analysis can be used for the identification and quality assessment of O. fragrans flowers. In addition, UPLC-ECD provides a direct and reliable way to estimate the antioxidant capability online. A significant correlation was demonstrated between the total area of characteristic compounds and antioxidant potential of O. fragrans flowers. GRA showed that acteoside had the strongest correlation with antioxidant capacity. Therefore, UPLC-ECD is a promising technique to determine the electroactive phenolic compounds and to quantify total antioxidant activity of natural products and foods. Moreover, O. fragrans flowers were rich in antioxidant substances and could be useful in the development of novel functional foods, considering the expanding market demand for green and safe food products.
Author contributions
All authors have accepted responsibility for the entire content of this manuscript and approved its submission.
Supplemental Material
Download ()Disclosure statement
No potential conflict of interest was reported by the author(s).
Supplemental data
Supplemental data for this article can be accessed on the publisher’s website.
Additional information
Funding
References
- Ahmad, K. A.; Yuan, Y.; Nawaz, D.; Ze, W.; Zhuo, H.; X, C.; Talal, B.; Taleb, A.; Mais, E.; Qilong, D. Antioxidant Therapy for Management of Oxidative Stress Induced Hypertension. Free Radical Res. 2017, 51, 1–18. DOI: 10.1080/10715762.2017.1322205.
- Wagner, H.; Cheng, J. W.; Ko, E. Y. Role of Reactive Oxygen Species in Male Infertility: An Updated Review of Literature. Arab J. Urol. 2018, 16, 35–43. DOI: 10.1016/j.aju.2017.11.001.
- Jara-Palacios, M. J.; Escudero-Gilete, M. L.; Hernández-Hierro, J. M.; Heredia, F. J.; Hernanz, D. Cyclic Voltammetry to Evaluate the antioxidant Potential in Winemaking By-products. Talanta. 2017, 165, 211–215. DOI: 10.1016/j.talanta.2016.12.058.
- López-Alarcón, C.; Denicola, A. Evaluating the Antioxidant Capacity of Natural Products: A Review on Chemical and Cellular-based Assays. Anal. Chim. Acta. 2013, 763, 1–10. DOI: 10.1016/j.aca.2012.11.051.
- Dasgupta, J.; Kar, S.; Liu, R.; Joseph, J.; Kalyanaraman, B.; Remington, S. J.; Chen, C.; Melendez, J. A. Reactive Oxygen Species Control Senescence-associated Matrix Metalloproteinase-1 through c-Jun-N-terminal Kinase. J. Cell Physiol. 2010, 225, 52–62. DOI: 10.1002/jcp.22193.
- Marín, C.; Yubero-Serrano, E. M.; López-Miranda, J.; Pérez-Jiménez, F. Endothelial Aging Associated with Oxidative Stress Can Be Modulated by a Healthy Mediterranean Diet. Int. J. Mol. Sci. 2013, 14, 8869–8889. DOI: 10.3390/ijms14058869.
- Pohanka, M. Role of Oxidative Stress in Infectious Diseases. A Review. Folia Microbiol. (Praha). 2013, 58, 503–513. DOI: 10.1007/s12223-013-0239-5.
- Xie, H.; Hou, S.; Jiang, J.; Sekutowicz, M.; Kelly, J.; Bacskai, B. J. Rapid Cell Death Is Preceded by Amyloid Plaque-mediated Oxidative Stress. Proc. Natl. Acad. Sci. 2013, 110, 7904–7909. DOI: 10.1073/pnas.1217938110.
- Apak, R.; Özyürek, M.; Güçlü, K.; Çapanoʇlu, E. Antioxidant Activity/capacity Measurement. 3. Reactive Oxygen and Nitrogen Species (ROS/RNS) Scavenging Assays, Oxidative Stress Biomarkers, and Chromatographic/chemometric Assays. J. Agric. Food Chem. 2016, 64, 1046–1070. DOI: 10.1021/acs.jafc.5b04744.
- Aruoma, O. I.; Grootveld, M.; Bahorun, T. Free Radicals in Biology and Medicine: From Inflammation to Biotechnology. BioFactors. 2006, 27(1–4), 1–3. DOI: 10.1002/biof.5520270101.
- Lo, H. Y.; Li, C. C.; Chen, F. Y.; Chen, J. C.; Hsiang, C. Y.; Ho, T. Y. Gastroresistant Insulin Receptor-binding Peptide from Momordica Charantia Improved the Glucose Tolerance in Streptozotocin-induced Diabetic Mice via Insulin Receptor Signaling Pathway. J. Agric. Food Chem. 2017, 65(42), 9266–9274. DOI: 10.1021/acs.jafc.7b03583.
- Ding, W.; Ouyang, Q.; Li, Y.; Shi, T.; Li, L.; Yang, X.; Ji, K.; Wang, L.; Yue, Y. Genome-wide Investigation of WRKY Transcription Factors in Sweet Osmanthus and Their Potential Regulation of Aroma Synthesis. Tree. Physiol. 2020, 40, 557–572. DOI: 10.1093/treephys/tpz129.
- Zhou, F.; Peng, J.; Zhao, Y.; Huang, W.; Jiang, Y.; Li, M.; Wu, X.; Lu, B. Varietal Classification and Antioxidant Activity Prediction of Osmanthus Fragrans Lour. Flowers Using UPLC–PDA/QTOF–MS and Multivariable Analysis. Food. Chem. 2017, 217, 490–497. DOI: 10.1016/j.foodchem.2016.08.125.
- Li, H. Y.; Yue, Y. Z.; Ding, W. J.; Chen, G. W.; Li, L.; Li, Y. L.; Shi, T. T.; Wang, L. G.; Wang, L.-G. Genome-Wide Identification, Classification, and Expression Profiling Reveals R2R3-MYB Transcription Factors Related to Monoterpenoid Biosynthesis in Osmanthus Fragrans. Genes (Basel). 2020, 11(4), undefined. DOI: 10.3390/genes11040353.
- Wang, L. M.; Li, M. T.; Jin, W. W.; Li, S.; Zhang, S. Q.; Yu, L. J. Variations in the Components of Osmanthus Fragrans Lour. Essential Oil at Different Stages of Flowering. Food Chem. 2009, 114(1), 233–236. DOI: 10.1016/j.foodchem.2008.09.044.
- Li, A. N.; Li, S.; Li, Y.; Xu, D. P.; Li, H. B. Optimization of Ultrasound-assisted Extraction of Natural Antioxidants from the Osmanthus Fragrans Flower. Molecules. 2016, 21, 218. DOI: 10.3390/molecules21020218.
- Mao, S. Q.; Wang, K. D.; Lei, Y. K.; Yao, S. T.; Huang, B. Y.; Huang, W. Antioxidant Synergistic Effects of Osmanthus Fragrans Flowers with Green Tea and Their Major Contributed Antioxidant Compounds. Sci. Rep. 2017, 7, 46501. DOI: 10.1038/srep46501.
- Moon, J. K.; Shibamoto, T. Antioxidant Assays for Plant and Food Components[J]. J. Agric. Food Chem. 2009, 57(5), 1655–1666. DOI: 10.1021/jf803537k.
- Jeong, D. E.; Shim, S. Y.; Lee, M. Anti-inflammatory Activity of Phenylpropyl Triterpenoids from Osmanthus Fragrans Var. Aurantiacus Leaves. Int. Immunopharmacol. 2020, 86, 106576. DOI: 10.1016/j.intimp.2020.106576.
- Hung, C. Y.; Huang, F. L.; Shi, L. S.; Ka, S. M.; Wang, J. Y.; Tsai, Y. C.; Hung, T. J.; Ye, Y. L. The Ethanol Extract of Osmanthus Fragrans Flowers Reduces Oxidative Stress and Allergic Airway Inflammation in an Animal Model. Evidence-based Complement Altern. Med. 2013, 2013, 304290. DOI: 10.1155/2013/304290.
- Chiorcea-Paquim, A. M.; Enache, T. A.; Souza Gil De, E.; Oliveira-Brett, A. M. Natural Phenolic Antioxidants Electrochemistry: Towards a New Food Science Methodology. Oliveira-Brett. Compr. Rev. Food Sci. Food Saf. 2020, 19, 1680–1726. DOI: 10.1111/1541-4337.12566.
- Suriano, S.; Iannucci, A.; Codianni, P.; Fares, C.; Russo, M.; Pecchioni, N.; Marciello, U.; Savino, M. Phenolic Acids Profile, Nutritional and Phytochemical Compounds, Antioxidant Properties in Colored Barley Grown in Southern Italy. Food Res. Int. 2019, 113, 221–233. DOI: 10.1016/j.foodres.2018.06.072.
- Du, L. J.; Gao, Q. H.; Ji, X. L.; Ma, Y. J.; Xu, F. Y.; Wang, M. Comparison of Flavonoids, Phenolic Acids, and Antioxidant Activity of Explosion-puffed and Sun-dried Jujubes (Ziziphus Jujuba Mill.). J. Agric. Food Chem. 2013, 2013, 11840–11847. DOI: 10.1021/jf401744c.
- Spiegel, M.; Kapusta, K.; Kołodziejczyk, W.; Saloni, J.; Zbikowska, B.; Hill, G. A.; Sroka, Z. Antioxidant Activity of Selected Phenolic Acids–Ferric Reducing Antioxidant Power Assay and QSAR Analysis of the Structural Features. Molecules. 2020, 25, 3088. DOI: 10.3390/molecules25133088.
- Plaza, M.; Kariuki, J.; Turner, C. Quantification of Individual Phenolic Compounds’ Contribution to Antioxidant Capacity in Apple: A Novel Analytical Tool Based on Liquid Chromatography with Diode Array, Electrochemical, and Charged Aerosol Detection. J. Agric. Food Chem. 2014, 62, 409–413. DOI: 10.1021/jf404263k.
- Munteanu, I. G.; Apetrei, C. Analytical Methods Used in Determining Antioxidant Activity: A Review. Int. J. Mol. Sci. 2021, 22, 3380. DOI: 10.3390/ijms22073380.
- Shahidi, F.; Zhong, Y. Measurement of Antioxidant Activity. J. Funct. Foods. 2015, 18, 757–781. DOI: 10.1016/j.jff.2015.01.047.
- Bayram, B.; Esatbeyoglu, T.; Schulze, N.; Ozcelik, B.; Frank, J.; Rimbach, G. Comprehensive Analysis of Polyphenols in 55 Extra Virgin Olive Oils by HPLC-ECD and Their Correlation with Antioxidant Activities. Plant. Foods Hum. Nutr. 2012, 67, 326–336. DOI: 10.1007/s11130-012-0315-z.
- Yang, Y.; Zhou, J.; Zhang, H.; Gai, P.; Zhang, X.; Chen, J. Electrochemical Evaluation of Total Antioxidant Capacities in Fruit Juice Based on the Guanine/graphene Nanoribbon/glassy Carbon Electrode. Talanta. 2013, 106, 206–211. DOI: 10.1016/j.talanta.2012.12.030.
- Pretti, L.; Bazzu, G.; Serra, P. A.; Nieddu, G. A Novel Method for the Determination of Ascorbic Acid and Antioxidant Capacity in Opuntia Ficus Indica Using in Vivo Microdialysis. Food Chem. 2014, 147, 131–137. DOI: 10.1016/j.foodchem.2013.09.120.
- Tomac, I.; Šeruga, M.; Labuda, J. Evaluation of Antioxidant Activity of Chlorogenic Acids and Coffee Extracts by an Electrochemical DNA-based Biosensor. Food Chem. 2020, 325, 126787. DOI: 10.1016/j.foodchem.2020.126787.
- Tortolini, C.; Bollella, P.; Zumpano, R.; Favero, G.; Mazzei, F.; Antiochia, R. Metal Oxide Nanoparticle Based Electrochemical Sensor for Total Antioxidant Capacity (TAC) Detection in Wine Samples. Biosensors. 2018, 8, 108. DOI: 10.3390/bios8040108.
- Lugonja, N. M.; Stanković, D. M.; Miličić, B.; Spasić, S. D.; Marinković, V.; Vrvić, M. M. Electrochemical Monitoring of the Breast Milk Quality. Food Chem. 2018, 240, 567–572. DOI: 10.1016/j.foodchem.2017.07.164.
- Olechno, E.; Puścion-Jakubik, A.; Markiewicz-Żukowska, R.; Socha, K. Impact of Brewing Methods on Total Phenolic Content (TPC) in Various Types of Coffee. Molecules. 2020, 25, 5274. DOI: 10.3390/molecules25225274.
- Zhang, D.; Chu, L.; Liu, Y.; Wang, A.; Ji, B.; Wu, W.; Zhou, F.; Wei, Y.; Cheng, Q.; Cai, S., et al. Analysis of the Antioxidant Capacities of Flavonoids under Different Spectrophotometric Assays Using Cyclic Voltammetry and Density Functional Theory. J. Agric. Food Chem. 2011, 59, 10277–10285. DOI: 10.1021/jf201773q.
- Qiu, X.; Wang, S.; Miao, S.; Suo, H.; Xu, H.; Hu, Y. Co-immobilization of Laccase and ABTS onto Amino-functionalized Ionic Liquid-modified Magnetic Chitosan Nanoparticles for Pollutants Removal. J. Hazard Mater. 2021, 401, 123353. DOI: 10.1016/j.jhazmat.2020.123353.
- Liao, X.; Brock, A. A.; Jackson, B. T.; Greenspan, P.; Pegg, R. B. The Cellular Antioxidant and Anti-glycation Capacities of Phenolics from Georgia Peaches. Food Chem. 2020, 316, 126234. DOI: 10.1016/j.foodchem.2020.126234.
- Gallego, M.; Mora, L.; Reig, M.; Toldra, F. Stability of the Potent Antioxidant Peptide SNAAC Identified from Spanish Dry-cured Ham. Food Res. Int. 2018, 105, 873–879. DOI: 10.1016/j.foodres.2017.12.006.
- Wu, R.; Wu, C.; Liu, D.; Yang, X.; Huang, J.; Zhang, J.; Liao, B.; He, H. Antioxidant and Anti-freezing Peptides from Salmon Collagen Hydrolysate Prepared by Bacterial Extracellular Protease. Food Chem. 2018, 248, 346–352. DOI: 10.1016/j.foodchem.2017.12.035.
- Ren, Y.; Ai, J.; Liu, X.; Liang, S.; Zheng, Y.; Deng, X.; Li, Y.; Wang, J.; Deng, X.; Chen, L. L. Anticoagulant Active Ingredients Identification of Total Saponin Extraction of Different Panax Medicinal Plants Based on Grey Relational Analysis Combined with UPLC-MS and Molecular Docking. J. Ethnopharmacol. 2020, 260, 112955. DOI: 10.1016/j.jep.2020.112955.
- Duan, H.; Dong, Z.; Li, H.; Li, W. R.; Zhai, K. F.; Wang, Q.; Cao, W.-G.; Fang, X.-M.; Fang, A.-D.; Zhai, K.-F. Quality Evaluation of Bee Pollens by Chromatographic Fingerprint and Simultaneous Determination of Its Major Bioactive Components. Food Chem. Toxicol. 2019, 134, 110831. DOI: 10.1016/j.fct.2019.110831.
- Zhou, W.; Xie, M. F.; Zhang, X. Y.; Liu, T. T.; Yu, Y. J.; Duan, G. L. Improved Liquid Chromatography Fingerprint of Fat-soluble Radix Isatidis Extract Using Multi-wavelength Combination Technique. J. Sep. Sci. 2011, 34, 1123–1132. DOI: 10.1002/jssc.201000834.
- Xu, S.; Liu, Y.; Tian, R.; Wang, Z.; Liu, Z.; Xie, P.; Feng, Q. Species Differentiation and Quality Assessment of Radix Paeoniae Rubra (Chi-shao) by Means of High-performance Liquid Chromatographic Fingerprint. J. Chromatogr. A. 2009, 1216, 2163–2168. DOI: 10.1016/j.chroma.2008.04.064.
- Wang, S.; Hua, Y.; Lin, Y.; Zou, L.; Liu, X.; Yan, Y.; Zhao, H.; Luo, Y.; Liu, J. Dynamic Changes of Metabolite Accumulation in Scrophulariae Radix Based on Liquid Chromatography-tandem Mass Spectrometry Combined with Multivariate Statistical Analysis. J. Sep. Sci. 2017, 40(14), 2883–2894. DOI: 10.1002/jssc.201700129.