
 ?Mathematical formulae have been encoded as MathML and are displayed in this HTML version using MathJax in order to improve their display. Uncheck the box to turn MathJax off. This feature requires Javascript. Click on a formula to zoom.
ABSTRACT
Thermal properties of lentil (Lens culinaris) and chickpea (Cicer arietinum L.) were determined experimentally and with predictive mechanistic models as functions of temperature and moisture content (four levels). Thermal conductivity (k), specific heat (Cp), and density (ρ) of the samples were evaluated using a line heat source probe, differential scanning calorimeter (DSC), and pycnometer, respectively. Except for Cp which was measured at a temperature range of 30 to 90°C, other properties were measured at room temperature. Specific heat of the samples increased linearly with moisture content (MC) and temperature, ranging from 0.824 to 2.433 kJ/kg K and 0.444 to 2.067 kJ/kg K for lentil and chickpea, respectively. Thermal conductivity increased with MC in all samples with its values ranging from 0.161 to 0.191 W/m K for lentil and 0.160 to 0.227 W/m K for chickpea. However, thermal conductivity values of flours were higher at lower MC levels when compared to seeds at higher MC levels. Thermal diffusivity, (0.159 × 10⁻⁶ to 0.221 × 10⁻⁶ m2/s and 0.163 × 10⁻⁶ to 1.175 × 10⁻⁶ m2/s for lentil and chickpea flours, respectively) was calculated from known values of k, Cp, and density (ρ), with its values decreasing as the MC levels increased. Thermal properties data from our experiments did not fit into the components-based mechanistic models. Models generated in this study have good significance (p< .05 and R2 ≈ 1), meaning they can be used for prediction of these properties, as well as modeling and simulation of thermal behavior of pulses during conventional or radio frequency (RF) heating.
Introduction
Pulses have been identified as the plant protein for sustainable future, serving as alternatives to animal proteins.[Citation1] The need for alternative protein sources propelled by food security, environmental sustainability, and health risk is a phenomenon that has been echoed by Food and Agriculture Organization of the United Nations (FAO).[Citation2–4] Lentil and chickpea are two of the pulses with high protein content, between 20 and 24% ().[Citation5,Citation6] Lentil possesses great potential as an alternative source of protein for food processing because of its ability to provide dietary amino acids and bioactive peptides.[Citation7] According to García-Mora et al.[Citation8] lentil protein contains peptides which provide great health benefits, including antihypertensive function.
Table 1. Proximate composition of lentil and chickpea
Table 2. Particle density, bulk density, and porosity of lentil, chickpea, and split chickpea seeds at four moisture contents
Table 3. Particle density of lentil and chickpea seeds from mechanistic model at room temperature
Table 4. Measured particle density of lentil and chickpea flours versus predicted particle density from mechanistic model at room temperature
To maximize the nutritional benefits of these pulses, it is often necessary to subject them to heat transfer related process, such as drying, cooking, freezing, electromagnetic heat treatment, etc.[Citation9] Thermal properties of materials should be evaluated to determine their behavior when subjected to thermal processing such as radio frequency heating. Thermal properties of interest have always been thermal conductivity (k), thermal diffusivity (α), and specific heat (Cp). Gharibzahedi et al.[Citation10] studied the thermal properties of red lentil at MC range of 9.5–21.1% wet basis (w.b.). The specific heat determined by methods of mixture was found to be between 1.08 and 2.03 kJ/kgK. Thermal conductivity increased with MC from 0.191 to 0.241 W/mK, while thermal diffusivity decreased from 2.15 × 10⁻⁷ to 1.65 × 10⁻⁷ m2/s over the MC range considered.
Kara et al.[Citation11] also determined the same set of properties of red lentil within MC levels ranging from 7.13 to 17.46% (d.b.). Specific heat was determined by methods of mixture and its values increased from 1506.81 to 2457.15 J/kg °C, k increased from 0.121 to 0.162 W/m K, while α decreased from 9.45 × 10⁻⁸ to 8.35 × 10⁻⁸ m2/s as the MC increased. Similarly, Alagusundaram et al.[Citation12] and Tang et al.[Citation13] worked on thermal conductivity and specific heat, respectively. Thermal conductivity of lentil increased from 0.187 to 0.249 W/m K as MC increased from 9 to 23%, and temperature from −28 to 29°C. Specific heat of lentil increased quadratically from 0.81 to 2.2 kJ/kg K as MC increased from 2.1 to 25.8% (w.b.), and linearly as temperature increased from 10 to 80°C.
Sabapathy and Tabil[Citation14] determined thermal conductivity, thermal diffusivity, and specific heat of kabuli-type chickpea. Thermal conductivity was measured at MC levels from 7 to 25% (w.b.) and temperature of 25–98°C. Its values ranged from 0.1535 to 0.3257 W/m K. Specific heat was measured using both differential scanning calorimeter (DSC) and assembled calorimeter at 9.86 to 65.24% MC levels and temperature range of 30–90°C. Specific heat increased from 1.154 to 2.568 kJ/kg K and 1.3749 to 2.4802 kJ/kg K for DSC and assembled calorimeter, respectively as the MC and temperature increased. In their study, they reported that α increased with increase MC and decrease with increase in temperature. Its values were from 9.11 × 10⁻⁸ to 25.05 × 10⁻⁸ m2/s.
Although thermal properties of some pulses, including lentil and chickpea have been reported, more work is needed in this area. Particularly since these properties depend on moisture content, temperature, structural configuration, proximate composition, and phytochemicals present in the seeds, some of which defer between varieties. Proximate composition also defers in seeds of the same variety due to environmental factors, planting year, location, etc.[Citation15] Comparison of experimental data with data from component-based mechanistic models could be one way of establishing the difference in thermal properties of materials based on the aforementioned reasons. Therefore, it becomes imperative that thermal properties in this work be measured before subjecting lentil and chickpea samples to radio frequency heating to understand their behavior and to ensure that the nutritional components of the pulses will be preserved.
Therefore, the objectives of this study were: (i) to examine the effect of temperature and moisture content on the specific heat of lentil and chickpea; (ii) to determine the thermal conductivity of lentil and chickpea at different moisture content levels; (iii) to determine the thermal diffusivity of lentil and chickpea using the specific heat, thermal conductivity, and density from experiments; (iv) to compare thermal properties data from our experiments to data from component-based predictive mechanistic models; and (v) to develop predictive models for Cp, k, and ρ.
Materials and methods
Materials and sample preparation
Our industry partners, Viterra Inc., Regina SK, Canada, supplied seeds of red lentil (Lens culinaris). The red lentil seeds were from CDC maxim variety harvested in 2018 farming season. Scoular Canada Ltd, Saskatoon SK, Canada, supplied Kabuli chickpea (Cicer arietinum) seeds of CDC Frontier variety also from 2018 season. The initial moisture contents of the seeds were 11% wet basis (w.b.), and they were stored in a controlled environment at 4°C. Red lentil received contained dirt and foreign materials which were removed with Forsberg Vacuum Gravity Separator (Forsbergs Inc., Thief River Falls, MN, USA) before use.
Sample conditioning and moisture content determination
Lentil samples were conditioned to four moisture levels (12, 14, 16, and 18% wet basis (w.b.)), covering the harvesting and storage MCs for lentil grain. ASABE procedure was used for moisture determination of whole grain (ASAE standard, 1990).[Citation16] Sixteen grams of grain sample was dried in a conventional oven at 130°C for 20 h. To achieve the required MCs, samples were weighed at the initial MC of 11% (w.b.) and were transferred into airtight glass jars. Precalculated amounts of distilled water required to achieve the MC levels were sprayed into the airtight glass jars. The jars were hand-shaken intermittently for even distribution of sprayed water. The airtight jars were kept in the laboratory at room temperature (23°C) for 72 h and were shaken at intervals to achieve equilibrium moisture content (EMC).
Furthermore, the approved method ASAE S352.2 air oven method for measurement of moisture content of unground grain and seeds (ASAE Standard[Citation17]) was used to adjust the MC of chickpea samples (whole seed and split). Whole seed chickpea and Fifteen grams of chickpea sample was dried in an oven for 72 h at 103°C. Each of lentil and chickpea samples were prepared in triplicates in aluminum moisture dishes and were dried in a hot air oven (Despatch Industries, Minneapolis, MN, USA) according to the aforementioned procedures. The samples were cooled in a desiccator for 1 h before reweighing with a digital scale with an accuracy of ±0.01 g (Symmetry, PR4200, Cole-Parmer Instrument Co., IL, USA). Moisture content levels were calculated by comparing the initial weights and final weights of the samples. The MC of whole chickpea seed was adjusted to 12, 14, 16, and 18% (w.b.), while split chickpea seed was adjusted 12.2, 14.6, 17, and 18.7% (w.b.).
To obtain the four required MC levels of both lentil and chickpea flour (6, 8.2, 9.4, and 10.7% (w.b.) and 6.3, 8.3, 9.6, and 10.8% (w.b.)), the MC levels of lentil and chickpea seeds were increased to pre-calculated percentages before milling. Lentil was milled with LM 3100 precision mill (Type 120, Perten Instruments AB, Huddinge, Sweden) and chickpea with a knife mill. The MCs of the flours were determined using AOAC 2002 method. Three grams of flour samples were prepared in triplicates using aluminum moisture dishes. The samples were dried in a hot air oven at 130°C for 1 h; this was followed by cooling in a desiccator. The final weights of the samples were determined and were compared with the initial weights for the MC calculation.
Particle density, bulk density, and porosity
Particle densities of grains and flours of lentil and chickpea at different MC levels were determined using a gas pycnometer (AccuPyc II 1340, Micromeritics Instrument Corp., Norcross, GA, USA). The equipment calculates the density based on the helium gas displacement method that is very accurate and reproducible. Prior to measuring the particle densities of the samples, the pycnometer was calibrated with a 35 cm3 cylindrical measuring cell as recommended by the equipment manufacturer. A known amount of each sample placed in the measuring cell was loaded to the sample chamber compartment. Upon completion of the required analysis programmed into the software, the software displayed the particle density, volume, and other related parameters. The measurements were repeated ten times with the average of the ten replications reported.
Bulk densities were determined by filling a standard measuring cylindrical cup with samples and gently leveling the surface with a wooden pencil to avoid compression. The weights of the samples were measured with a precision scale; bulk density was then calculated by dividing the weight with the known volume of the measuring cup (500 ± 0.5 mL). Bulk densities were determined in triplicates and the average values reported, while the particle densities were average of ten repetitions. With the values of the particle and bulk densities for the samples already known, porosity was calculated using EquationEq. (1)(1)
(1) .
where ɸ is porosity, ρb is bulk density, and ρp is particle density.
Specific heat
The specific heat of lentil and chickpea flour at moisture content ranging from 6.0 to 10.7% (w.b.) and 6.3 to 10.8% (w.b.) respectively were measured with a differential scanning calorimeter – DSC (Q2000, TA Instruments Inc., New Castle, DE, USA) over a temperature range from 30 to 90°C at interval of 10°C. Prior to commencing the experiments, the equipment was calibrated using Indium and Sapphire as recommended by the manufacturer. DSC measurement technique reported by Tang et al.[Citation13] was followed. Samples were prepared in triplicates with known weights, ˂ 10 mg (± 0.01 mg), placed in a sealed hermetic aluminum pan. The pans were loaded into the DSC along with an identical pan that served as the reference. For accuracy and precision, the heating rate was set at 20°C/min, resulting in negligible thermal gradient in the sample and the pan.
Thermal conductivity and diffusivity
Thermal conductivity was measured using Tempos Thermal Properties Analyzer (Meter Group Inc., Pullman, WA, USA) with the KS-3 single needle (1.3 mm diameter × 60 mm length) (). The needle had a valid thermal conductivity range of 0.02–2.00 W/m K with an accuracy of ±0.01 W/m K, and a temperature range of −50 to 150°C. The equipment employs the line heat source probe method which is used for measuring thermal conductivity of many materials, including agricultural and food materials. This method has been thoroughly reviewed.[Citation18–21] EquationEq. 2(2)
(2) is the general equation used for determining thermal conductivity based on the line heat source probe method. However, to eliminate errors which may result from long measurement time and thermally induced moisture loss, the analyzer was built with an algorithm using EquationEq. 3
(3)
(3) and Equation4
(4)
(4) developed by Knight et al.[Citation22] which worked perfectly for dual probes. EquationEq. 5
(5)
(5) was derived from further expansion of EquationEq. 3
(3)
(3) to account for accurate measurement of thermal conductivity in 30s using a single probe.
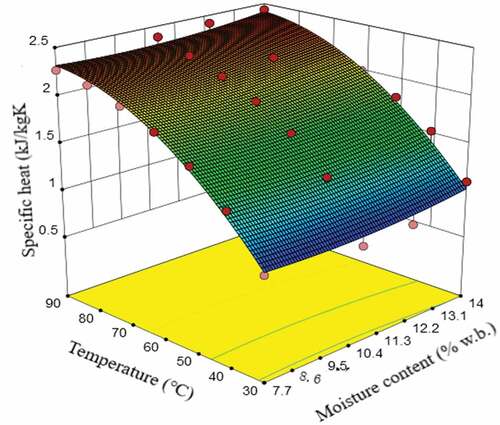
Figure 1. 3-D surface plot of response of specific heat of lentil to temperature and moisture content.
Where t1 is time when probe heater was energized (s); t2 is the time since probe heater was energized (s); T1 is the temperature of probe thermocouple at time t1; T2 is the temperature of probe thermocouple at time t2; and Q is the heat flux generated by probe heater.; ∆T is the temperature rise at the measuring needle; q is the heat input at the heated needle (W/m); k is the thermal conductivity (W/mK); r is the distance from the heated needle to the measuring needle; D is the thermal diffusivity (m2/s); t is time (s); th is the heating time (s); to is the time offset; and Ei is the exponential integral approximated using polynomials.
Sensor verification of the needle was done prior to each measurement according to the manufacturers instruction by measuring the thermal conductivity of glycerin provided in the equipment kit. The manufacturer reported the thermal conductivity of glycerin as 0.285 W/mK at 20°C in the Certificate of Quality Assurance (CQA), hence for the sensor to be reading accurately, it is expected that the thermal conductivity of glycerin during verification must be within ±10% of the value reported in the CQA. Upon completion of each verification, samples were placed in a cylindrical sample holder (32 mm diameter × 5 mm thickness × 100 mm length) and were slightly compressed with compression pressure of 5 × 10⁶ Pa using Instron (Curtis Hoover Ltd, Edmonton, Alberta Canada) to remove void fractions. For the sample to be considered as an infinite cylinder, the suggested limit by Vos (1956) given in EquationEq. 6(6)
(6) was evaluated. After calculating the inequality, rs was ≈ 7 mm for lentil flour and between 6 and 15 mm for chickpea flour. These were all less than the radius of the cylindrical sample holder (16 mm).
Where rs is the sample radius, α is the thermal diffusivity of the samples (m2/s), and t is the time (measuring cycle) in s. Thereafter, the sensor was inserted into the sample for measurement of thermal conductivity. The sensor equilibrated for 30 s prior to entering active heating mode for another 30 s. Thermal conductivity values were displayed on the equipment screen after completing each measuring cycle. All samples were measured in triplicates. The resulting data were transferred to a computer using TEMPOS Utility software with the average of the three readings reported in and .
Table 5. Specific heat of lentil and chickpea at various temperatures and MCs from experiment
Table 6. Specific heat of lentil and chickpea at various temperatures and MCs from mechanistic model
Table 7. Thermal conductivity of lentil and chickpea from experiment and predictive mechanistic model at room temperature
Table 8. Thermal conductivity of lentil and chickpea flours from experiment and predictive mechanistic model at room temperature
Thermal diffusivity (α) was calculated from experimental results of thermal conductivity, density, and specific heat using EquationEq. 7(7)
(7) .
Where α is thermal diffusivity (m2/s); k is thermal conductivity (W/mK); ρ is density (kg/m3); and Cp is specific heat (J/kgK).
Statistical analysis
User-defined experimental design was used for all samples in this work and statistical analysis were performed using Design Expert software Version 10 (Stat-Ease, Inc., Minneapolis MN, USA).
Comparison with mechanistic models
Thermal properties obtained from this current study were compared with the component-based mechanistic models by Choi and Okos.[Citation23] Major food components used for their models were protein, carbohydrate, fat, fiber, ash, and water. The proximate composition of these components shown in were extracted from the works of Boye et al.[Citation5] and Sánchez-Chino et al.[Citation6] The models provide faster means of estimating the thermal properties of food materials such as specific heat, density, thermal conductivity, and thermal diffusivity of major food materials as functions of temperature, with the model temperature ranging from −40 to 150°C. These properties were measured with experimental procedures similar to ours. For instance, their experimental procedure involved measuring density with volumetric pycnometer and specific heat with differential scanning calorimeter. Models were developed for individual component, while general models were developed with the volume and weight fractions of each component. In our study, we calculated the specific heat using the component-based model shown in EquationEq. (8)(8)
(8) :
Where Cp is the effective specific heat, cpi is the specific heat of ith component and wi is the mass fraction of ith component. The model used for density is given in EquationEq. (9)(9)
(9) :
Where ρ is the density, ρi is the density of ith component. Thermal conductivity models were developed with consideration for the different structural characteristics of food materials. The use of parallel and series thermal conductivity models (EquationEq. 10(10)
(10) and Equation11
(11)
(11) respectively) were proposed for multi-component system based on the direction of heat flow or electrical resistance. Both parallel and series models were used for calculating k in our study.
Where k is the effective thermal conductivity, ki is the thermal conductivity of ith component and vi is the volume fraction of ith component.
The model for Cp was used for predicting the specific heat at four MC levels and seven temperature points, while others were applied at four MC levels and room temperature for ease of comparison with our experimental data.
Results and discussion
Particle density, bulk density, and porosity
The measured density and porosity of lentil seeds, chickpea seeds, and split-chickpea samples are given in . It was observed from the results that as MC increased from 12 to 18% (w.b.), particle density of lentil seeds decreased from 1416 to 1372 kg/m3; while that of chickpea seeds decreased from 1352 to 1328 kg/m3. For split chickpea, as the MC increased from 12 to 18.7% (w.b.), particle density decreased from 1402 to 1367 kg/m3. Amin et al.[Citation24] and Guo et al.[Citation25] reported the same trend for lentil and chickpea grains. In a research by Tang and Sokhansanj,[Citation26] it was observed that the particle densities of both whole and milled lentils increased as MC decreased from 24.1 to 11.7% dry basis (d.b.) at temperature of 30°C and relative humidity of 30%. Guo et al.[Citation27] reported a decrease in kernel density of chickpea from 1.73 to 1.28 g/cm3 when the MC was increased from 7.9% to 20.9% (w.b.). shows the predicted particle density of lentil and chickpea grains from component-based mechanistic models. For lentil, its values (1397–1364 kg/m3) were lower than the experimental values, while the predicted density values for chickpea (1375–1347 kg/m3) were higher than the experimental values. Since the mechanistic model was based on the chemical composition and structural configuration of the samples, the differences in particle density values of lentil and chickpea between experimental and mechanistic models could be due to variation in the composition of the chemical components in our samples. The components are affected by growth location, environmental factors, and planting year.[Citation10]
Particle density of lentil flour decreased from 1449 to 1432 kg/m3 as MC increased from 6.0 to 10.7% (w.b.), and particle density of chickpea flour decreased from 1425 to 1397 kg/m3 as the MC increased from 6.3 to 10.8% (w.b.) (). The predicted particle densities from component-based mechanistic model also shown in for both samples were lower than experimental data over the same MC levels. The density decreased from 1428 to 1391 kg/m3 and 1398 to 1370 kg/m3, respectively for both samples. Although the predicted density also decreased for all samples with increase in MC as expected, the mechanistic models are not sufficient to predict the density of our samples due to the differences in data generated.
Bulk densities of both lentil and chickpea grains followed a similar trend showing a negative linear relationship as the MC levels increased (). This is in consonance with the relationship between bulk density and MC reported by Deshpande et al.[Citation28] for soybean. It was found that the bulk density of soybean decreased from 735 to 708 kg/m3 as the MC increased from 8.7 to 25% d.b. Since density is inversely proportional to volume, it will be accurate to say that there was an increase in grain volume as the MC of the sample increased resulting in density reduction. Sokhansanj and Nelson[Citation29] reported a reduction in both bulk and particle densities when MC was increased at five intervals from 3.4 to 24.4% w.b. over four frequency points from 1 to 2450 MHz. Konak et al.[Citation30] also reported decrease in bulk density as MC increased from 5.2 to 16.5% d.b.
However, for split chickpea (), the bulk density did not follow similar pattern. There were no considerable changes in the bulk density as the MC increased. In fact, there was an increase of less than 1% as the MC increased from 12.0 to 14.6% (w.b.) and 14.6 to 17.0% (w.b.) respectively. At MC of 18.7% (w.b.), there was a negligible reduction (approximately 0.1%). There is no literature to explain the variation; however, our conjecture is that the variation may be due to the inconsistency in the shapes and sizes of the seeds after splitting with knife mill. Ghadge et al.[Citation31] reported that there were variations in shape, size, weight, and other physical properties of split chickpea variety studied. The variations could also be attributed to chickpea variety, splitting method, and moisture level. It is well known that the size of a grain and other physical attributes will affect its weight, this will in turn affect the density.[Citation32] Therefore, since pore spaces in any grain matrix will have a huge effect on density, it is possible that the nonuniform split seed shape which resulted in higher porosity was responsible for the variation in bulk density values as the MC increased.
Specific heat
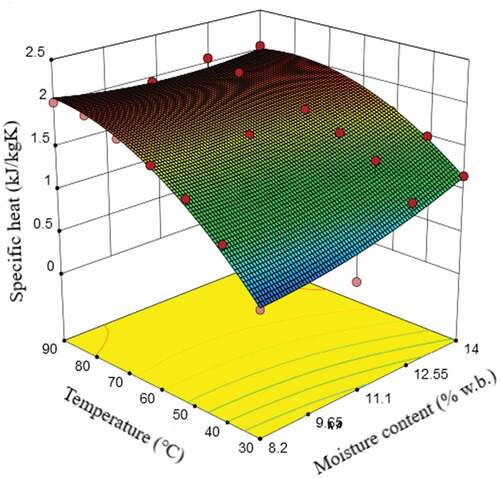
The specific heat (Cp) values of lentil and chickpea at different MCs and temperatures. The data reported are average of triplicate measurements made with a DSC. Specific heat of lentil varied from 0.907 to 2.433 kJ/kg K, while for chickpea, it varied from 0.590 to 2.051 kJ/kg K across the range of MC levels and temperatures considered. For each sample, specific heat increased as the MC and temperature increased. Specific heat data generated from a predictive component-based mechanistic model. Specific heat of lentil and chickpea flours increased from 1.919 to 2.125 kJ/kg K and 1.919 to 2.100 kJ/kg K, respectively. Compared to the experimental data, the predicted Cp values were higher at lower temperatures, while the experimental Cp values were higher from 80 from 90°C. The difference in Cp data will require that models be generated with the experimental data as the differences in Cp values between experimental and predictive models may be attributed to the reasons given above.
show the 3-D surface plots of the responses of their respective specific heat to temperature and MC. The plots further strengthen the assertion that specific heat increased as the temperature and MC of the samples increased. Similar observation was reported for Cp of laird lentil by Tang et al.[Citation13] The Cp increased quadratically from 0.81 to 2.2 kJ/kgK as the MC increased from 2.1% to 25.8% (w.b.), and linearly with temperature increasing from 10°C to 80°C at intervals of 5°C. However, the Cp values were lower than those reported in our current study. This may be attributed to varietal difference, MC levels, or temperature range. Sabapathy et al.[Citation14] also reported that the Cp of kabuli chickpea seed increased from 1.154 to 2.568 kJ/kgK as MC increased from 9.86% to 65.24% and temperature ranging from 30 to 80°C. Although chickpea variety in their work is the same with the one used for our study, their Cp values were slightly higher. This could be because of variations in the percentage composition of each chemical components in the studied sample, since these components vary within pulses of same variety due to environment factors, growth location, and planting year.[Citation15] The variation in Cp range could also result from the MC levels considered, as MC has significant effect on Cp.
Figure 2. 3-D surface plot of response of specific heat of chickpea to temperature and moisture content.
Results of specific heat of lentil and chickpea presented in revealed that there were slight reductions in the values of Cp at 9.4% and 8.3% MCs as compared to others. This may have resulted from sample composition due to nonuniform particle size distribution attributed to difficulty experienced during milling of the samples. Fat content of pulses made fine milling at high moisture content challenging. A consideration was given to defatting of the samples for ease of particle size analysis; however, it was realized that removing such important component from the sample may affect the experimental result. Future research should be carried out on the comparative study of Cp of defatted and nondefatted pulses.
Thermal conductivity and thermal diffusivity
Thermal conductivity (k) of most biological materials is influenced by moisture, chemical composition, physical structure, and temperature. shows the k values for lentil and chickpea seeds measured at room temperature, with MC ranging from 12.0 to 18.0% (w.b.) for both seed samples. Thermal conductivity for lentil and chickpea flour shown in were also measured at room temperature over MC range of 6.0–10.7% (w.b.) for lentil flour and 6.3–10.8% (w.b.) for chickpea flour. Thermal conductivity increased with MC for all samples. For both lentil and chickpea flours, k is slightly higher when compared to the seeds. This is attributed to low porosity in flour and can be further explained with the density information provided in and . Lower densities in the lentil and chickpea seeds compared to the flours connotes that there were some entrapped air or pore spaces within the seed samples resulting in high porosity. Thermal conductivity data generated from component-based predictive models are also presented in and for seed and flour samples. In all samples, predicted k values were higher than experimental k values. This may as well be attributed to the reasons given earlier.
Thermal conductivity data from our experiment was validated by the explanation given by Carson.[Citation33] It was said that for a material whose composition is known, the k value must be greater than k of the component with lowest k and must not exceed the k for the component with the highest k. This invariably means that k value presented for materials whose components are known must fall within these two extremes. shows the k for major food components, pulses inclusive. At 40°C, assuming a negligible porosity, the component with the least k value is fat (k = 0.19 W/m K), while liquid water (k = 0.63 W/m K) is the component with the highest k. The k values in our experiments fall within this range affirming the reliability of the data presented in this work.
Table 9. Thermal conductivity of food components
Consequence upon the observations made in our study, it can be inferred that the proximate composition of a material plays a huge role in determining its k value, particularly since k of each component has direct effect on the overall k of the material. According to Njie et al.,[Citation34] during ripening of plantain fruit, a large portion of its carbohydrate was converted to sucrose. Since sucrose had a lower k value, the k of banana was smaller compared to k for cassava and yam which were the other two high carbohydrate materials reported. It was further observed that there was a reduction in the available free water in plantain because sucrose has a high water-binding capacity than starch which is the highest constituent of carbohydrate (about 80–98%). Halliday et al.[Citation19] measured the thermal conductivities of two starch-based materials using the line heat source probe method used in our work. It was reported that thermal conductivity increased with increasing MC level and temperature for both materials. The effect of granular and gelatinized starch was also reported as one of the factors which was responsible for the increase in k.
Theoretically, it can be inferred from mechanistic models by Choi and Okos[Citation23] that MC has more effect on thermal conductivity than temperature. For instance, using the parallel model for predicting k values, at an average MC of 15% and average temperature of 60°C, an increment of 10% on both MC and temperature resulted in 1.9% and 1.3% increase in k value, respectively for lentil. For chickpea, the k value increased by 1.9% and 1.1% with 10% increase in average MC and temperature. This information shows the sensitivity of k values to both MC and temperature with MC having higher effect. Although the effect of temperature on k value has been established, however, it is worthy of note that in experimental situation, there could be potential errors with k measurement at high temperature. These errors could result from moisture condensation to the thermal probe during heating, as well as moisture losses that could occur while raising the sample temperature to the desired measurement temperature.
Thermal diffusivity (α) was calculated by inserting the known experimental values of k, Cp, and ρ into EquationEq. 7(7)
(7) . As shown in , thermal diffusivity decreased as MC increased for chickpea flour from 0.397 × 10⁻⁶ to 0.163 × 10⁻⁶ m2/s. However, for lentil flour a trend could not be ascertained. At 6.0% and 10.7% MC levels, α values were 0.185 and 0.159 m2/s, showing reduction in α as MC increased. However, at 8.2% and 9.4% MCs and for chickpea flour at 8.3% MC, slight disagreement with the reported trend was observed. Since α was computed from known values of measured parameters, discrepancies in Cp values which was mentioned earlier must have been responsible for the inconsistency in the trend.
Table 10. Thermal diffusivity of lentil and chickpea flour from experiment and mechanistic model at room temperature
Kara et al.[Citation11] also reported decrease in α with MC increasing from 7.13 to 17.46% (d.b.) for red lentil seeds. Gharibzahedi et al.[Citation23] reported a polynomial decrease in α as MC increased from 9.5 to 21.1% (w.b.) after computing α from the values of k, Cp, and ρ of red lentil seeds. Similarly, pumpkin seeds also exhibited decrease in α as MC increased from 5.32 to 24% (d.b.).[Citation35] Thermal diffusivity values generated from component-based predictive model did not follow similar pattern (). Its values increased from 0.097 × 10⁻⁶ m2/s to 0.103 × 10⁻⁶ m2/s and 0.095 × 10⁻⁶ m2/s to 0.101 × 10⁻⁶ m2/s for lentil flour and chickpea flour, respectively.
Thermal properties of food materials depend largely on their components and other factors that may affect heat flow or electric conductivity through the material. In fact, Sweat[Citation36] concluded that knowing the thermal properties of each component of a food material will be sufficient for predicting the properties of the mixture. However, these components may vary within food material of same variety due to many factors. According to Patterson et al.,[Citation15] these factors may include: environment factors, growth location, planting year, etc. Additionally, factors such as shape, size, void fraction, homogeneity, and orientation of fibers can affect the direction of heat flow through the material. Therefore, the variation in the data generated from this work and those of component-based models could be attributed to any of the aforementioned reasons.
Statistical analysis and predictive model
Predictive models for the measured parameters are presented in . Statistical information for each model is also given in the same table. The ANOVA results revealed that all the factor studied had significant effect on response variables (p < .05). The determination coefficient (R2) and adjusted determination coefficient (R2Adj) for the models were approximately equal to 1. This indicates that for all the samples, the measured values were very close to the mean, which suggests that each of the parameters studied can be accurately predicted using the developed models. The coefficient of variation (C.V.) was small for many of the models (C.V.<10%) buttressing the closeness of the data to the mean and giving credence to the acceptability of our model for estimation or prediction of the parameters. This can be further explained with the plots of predicted versus actual values of the Cp for lentil and chickpea flours shown in . It can be deduced from these plots that the experimental and predicted values fit very closely, which implies that the experimental values can easily be predicted with the models. p-values were greater than 0.05 but less than 0.1 in k for lentil and chickpea seeds and ρ for split chickpea, implying significance of the factors.
Figure 3. (a). Plot of predicted versus actual values of specific heat of lentil flour. (b). Plot of predicted versus actual specific heat of chickpea flour.
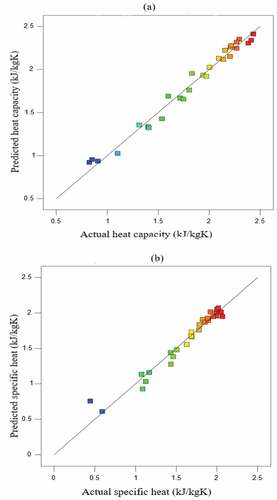
Table 11. Regression models and ANOVA results for specific heat, thermal conductivity, thermal diffusivity, and density for lentil (flour and seed) and chickpea (flour, seed, and split)
Conclusion
It is noticeable from our findings that thermal conductivity, thermal diffusivity, specific heat, and bulk density of the pulses studied are dependent on temperature and MC. The effects of the chemical components of these pulses on their overall thermal properties have also been established. Specifically, proximate composition and structural configuration of the seeds differs from variety to variety and their quantity affects their thermal properties. The thermal properties were measured with approved methods for homogeneous materials at different moisture content levels (for all properties) and different temperatures (for Cp). Experimental data from k, Cp, and ρ were used to compute α. Thermal conductivity increased with MC, Cp increased with temperature and MC, and both ρ and α decreased with MC. Thermal properties from experimental values were either higher or lower than corresponding values from component-based mechanistic models. This could be attributed to the variation in the proximate composition and structural configuration of the samples in this work and those used to generate the models. From the ANOVA results, temperature and MC had significant effect on Cp, while MC showed significant effect on other properties studied. The regression models developed can be used for reasonable estimation of these properties. They could as well be used for modeling of thermal behavior of pulses and simulation of heating processes.
Acknowledgments
Our research group gratefully acknowledges the Saskatchewan Pulse Growers for their financial support through the Pulse Science Cluster Fund program (Phase 3, A16). We also gratefully acknowledge the contributions made by the following persons: Mike O’Brien, Manager, Grain Inspection, Viterra Inc., Ian Armer, Manager, Grain Quality Control Division, Viterra Inc., and Senior Trader, Scoular Canada Ltd who provided us with pulse samples and technical supports.
Disclosure statement
No potential conflict of interest was reported by the author(s).
Additional information
Funding
References
- Food and Agricultural Organization of the United Nations. 2021. http://www.fao.org/3/ca7676en/CA7676EN.pdf Accessed January 28.
- Henchion, M.; Hayes, M.; Mullen, A. M.; Fenelon, M., and Tiwari, B. Foods; Future Protein Supply and Demand: Strategies and Factors Influencing aSustainable Equilibrium. 2017, 6(7), 53. DOI:10.3390/foods6070053.28726744
- Jarpa-Parra, M.;. Lentil Protein: A Review of Functional Properties and Food Application. An Overview of Lentil Protein Functionality. Int. J. Food Sci. Technol. 2018, 53(4), 892–903. DOI: 10.1111/ijfs.13685.
- Monnet, A.-F.; Laleg, K.; Michon, C.; Micard, V. Legume Enriched Cereal Products: A Generic Approach Derived from Material Science to Predict Their Structuring by the Process and Their Final Properties. Trends Food Sci. Technol. 2019, 86, 131–143. DOI: 10.1016/j.tifs.2019.02.027.
- Boye, J.; Zare, F.; Pletch, A. Pulse Proteins: Processing, Characterization, Functional Properties and Applications in Food and Feed. Food Res. Int. 2010, 43(2), 414–431. DOI: 10.1016/j.foodres.2009.09.003.
- Sánchez-Chino, X.; Jiménez-Martínez, C.; Dávila-Ortiz, G.; Álvarez-González, I.; Madrigal-Bujaidar, E. Nutrient and Nonnutrient Components of Legumes, and Its Chemopreventive Activity: A Review. Nutr. Cancer. 2015, 67(3), 401–410. DOI: 10.1080/01635581.2015.1004729.
- Khazaei, H.; Subedi, M.; Nickerson, M.; Martínez-Villaluenga, C.; Frias, F., and Vandenberg, A. Foods 8 9 ; , 2019 Seed Protein of Lentils: Current Status, Progress, and Food Applications. . pp 391 doi:10.3390/foods8090391.
- García-Mora, P.; Martín-Martínez, M.; Bonache, M. A.; González-Múniz, R.; Peñas, E.; Frias, J.; Martinez-Villaluenga, C. Identification, Functional Gastrointestinal Stability and Molecular Docking Studies of Lentil Peptides with Dual Antioxidant and Angiotensin I Converting Enzyme Inhibitory Activities. Food Chem. 2017, 221, 464–472. DOI: 10.1016/j.foodchem.2016.10.087.
- Nesvadba, P.;. Methods for the Measurement of Thermal Conductivity and Diffusivity of Foodstuffs. J. Food Eng. 1982, 1(2), 93–113. DOI: 10.1016/0260-8774(82)90003-6.
- Gharibzahedi, S. M. T.; Ghahderijani, M.; Lajevardi, Z. S. Specific Heat, Thermal Conductivity and Thermal Diffusivity of Red Lentil Seed as a Function of Moisture Content. J. Food Process. Preserv. 2014, 38(4), 1807–1811. DOI: 10.1111/jfpp.12151.
- Kara, M.; Boydas, M. G.; Kara, Y. A.; Ozturk, I. The Effect of Moisture Content on the Thermal Properties of Red Lentil Seeds. Transactions of the ASABE 2012. 2012, 55(6), 2301–2306. DOI: 10.13031/2013.42488.
- Alagusundaram, K.; Jayas, D. S.; Munir, W. E.; White, N. D. G. Thermal Conductivity of Bulk Barley, Lentils, and Peas. Trans. ASAE. 1991, 34(4), 1784–1788. DOI: 10.13031/2013.31801.
- Tang, J.; Sokhansanj, S.; Yannacopoulos, S.; Kasap, S. O. Specific Heat Capacity of Lentil Seeds by Differential Scanning Calorimetry. Trans. ASAE. 1991, 34(2), 517–0522. DOI: 10.13031/2013.31693.
- Sabapathy, N. D., and Tabil, L. G Thermal Properties of Kabuli Type Chickpea 2004 ASAE/CSAE annual International Meeting 1 - 4 August 2004 Ottawa, Ontario, Canada.
- Patterson, C. A.; Curran, J.; Der, T. Effect of Processing on Antinutrient Compounds in Pulses. Cereal Chem. 2017, 94(1), 2–10. DOI: 10.1094/CCHEM-05-16-0144-FI.
- ASAE Standard S532.2: 1990 Moisture Measurements - Grains and Seeds. St. Joseph, MI: American Society of Agricultural and Biological Engineers:
- ASAE Standard S352.2: 1988 Moisture Measurement - Unground Grain and Seeds. American Society of Agricultural and Biological Engineers: St. Joseph, MI.
- Vos, B. H.; Measurements of Thermal Conductivity by a Non-steady-state Method. Applied Scientific Research, Section A 1956, 5: 425–438.
- Halliday, P. J.; Parker, R.; Smith, A. C.; Steer, D. C. The Thermal Conductivity of Maize Grits and Potato Granules. J. Food Eng. 1995, 26(3), 273–288. DOI: 10.1016/0260-8774(94)00047-D.
- Baik, O. D.; Marcotte, M.; Sablani, S. S.; Castaigne, F. Thermal and Physical Properties of Bakery Products. Crit. Rev. Food Sci. Nutr. 2001, 41(5), 321–352. DOI: 10.1080/20014091091832.
- Murakami, E. G.; Sweat, V. E.; Sastry, S. K.; Kolbe, E. Analysis of Various Design and Operating Parameters of the Thermal Conductivity Probe. J. Food Eng. 1996, 30(1–2), 209–225. DOI: 10.1016/S0260-8774(96)00010-6.
- Knight, J. H.; Kluitenberg, G. J.; Kamai, T.; Hopmans, J. W. Semianalytical Solution for Dual-probe Heat-pulse Applications that Accounts for Probe Radius and Heat Capacity. Vadose Zone Journal. 2012, 11(2), vzj2011.0112. DOI: 10.2136/vzj2011.0112.
- Choi, Y.; Okos, M. R. Effects of Temperature and Composition on the Thermal Properties of Foods. In Food Engineering and Process Applications; Le Mageur, M., Jelen, P., Eds.; Elsevier Applied Science: London, 1986; pp 93–101.
- Amin, M. N.; Hossain, M. A.; Roy, K. C. Effects of Moisture Content on Some Physical Properties of Lentil Seeds. J. Food Eng. 2004, 65(1), 83–87. DOI: 10.1016/j.jfoodeng.2003.12.006.
- Guo, W.; Wang, S.; Tiwari, G.; Johnson, J. A.; Tang, J. Temperature and Moisture Dependent Dielectric Properties of Legume Flour Associated with Dielectric Heating. LWT - Food Sci. Technol. 2010, 43(2), 193–201. DOI: 10.1016/j.lwt.2009.07.008.
- Tang, J.; Sokhansanj, S. Geometric Changes in Lentil Seeds Caused by Drying. J. Agri. Eng. Res. 1993, 56(4), 313–326. DOI: 10.1006/jaer.1993.1082.
- Guo, W.; Tiwari, G.; Tang, J.; Wang, S. Frequency, Moisture and Temperature-dependent Dielectric Properties of Chickpea Flour. Biosyst. Eng. 2008, 101(2), 217–224. DOI: 10.1016/j.biosystemseng.2008.07.002.
- Deshpande, S. D.; Bal, S.; Ojha, T. P. Physical Properties of Soybean. J. Agri. Eng. Res. 1993, 56(2), 89–98. DOI: 10.1006/jaer.1993.1063.
- Sokhansanj, S.; Nelson, S. O. Dependence of Dielectric Properties of Whole-grain Wheat on Bulk Density. J. Agri. Eng. Res. 1988, 39(3), 173–179. DOI: 10.1016/0021-8634(88)90094-7.
- Konak, M.; Çarman, K.; Aydin, C. PH-Postharvest Technology: Physical Properties of Chickpea Seeds. Biosyst. Eng. 2002, 82(1), 73–78. DOI: 10.1006/bioe.2002.0053.
- Ghadge, P.; Vairagar, P., and Prasad, K. Some Physical Properties of Chickpea Split (Cicer Arietinum L). Agricultural Engineering International: The CIGR Ejournal. January. 2008, X(7 39).
- Lawrence, K.; Nelson, S.; Kraszewski, A. Temperature Dependence of the Dielectric Properties of Pecans. Trans. ASAE. 1992, 35(1), 251–255. DOI: 10.13031/2013.28596.
- Carson, J. K.;. Use of Simple Thermal Conductivity Models to Assess the Reliability of Measured Thermal Conductivity Data. Int. J. Refrig. 2017, 74, 458–464. DOI: 10.1016/j.ijrefrig.2016.10.024.
- Njie, D. N.; Rumsey, T. R.; Singh, R. P. Thermal Properties of Cassava, Yam and Platain. J. Food Eng. 1998, 37(1), 63–76. DOI: 10.1016/S0260-8774(98)00068-5.
- Kocabiyik, H.; Kayisoglu, B.; Tezer, D. Effect of Moisture Content on Thermal Properties of Pumpkin Seed. Int. J. Food Prop. 2009, 12(2), 277–285. DOI: 10.1080/10942910701673519.
- Sweat, V.;. Thermal Properties of Foods. In Engineering Properties of Foods; Rao, M. A., Rizvi, S. S. H., Eds.; Marcel Dekker: New York, 1995; pp 99138.