
ABSTRACT
The effect of freeze-thaw cycling on the quality of pre-fermented red bean steamed bun (RBSB) dough and the cooked product were explored. For frozen dough samples, the changes in water distribution, frozen water content, starch crystallinity, layered structure, and protein secondary structure of the dough during freeze-thaw cycling were analyzed. The textures, colors, and relative amino acids contents of RBSBs, which were steamed from frozen dough, were analyzed. The results showed that the transverse relaxation time of weakly bound water,T22,increased as the number of freeze–thaw cycles increased, and the freezable water content reached its highest value (14.68%) after 1 cycle. The relative crystallinity of starch was increased by 13.6% compared with the control after 4 freeze-thaw cycles. The lamellar structure of starch increased by 4.33% after more than 5 freezing cycles. Freeze-thaw treatments caused significant and irregular changes in the secondary structure of the frozen dough. Freeze-thaw cycling accelerated an increase in the hardness of RBSB products. The brightness (L*) of RBSBs decreased significantly with increases in the number of freeze-thaw cycles, and these cycles also affected the amino acid contents of RBSBs.
Introduction
Steamed stuffed buns (Baozi) are one of China’s most popular foods because they are nutritious, convenient to eat, and delicious. Steamed stuffed buns are also essential at the Chinese breakfast table. With the exchange of food cultures among various countries, steamed buns are becoming more popular in Indonesia, Thailand, Japan, and other Southeast Asian countries. Additionally, they are gradually being accepted by Western countries.[Citation1] The combination of flour, yeast, and water makes steamed stuffed bun dough; then, the dough is hand-molded or machine-rolled into a crust; the stuffing (core) is wrapped in the crust to form a steamed stuffed bun product. There are generally two kinds of stuffing, which are similar to those of dumplings and Tang yuan: (1) sweet stuffings, which use sugar, cooked red beans, sesame paste, lotus paste, or dates and nuts, and (2) salty and fresh stuffing, which uses any meat cooked with vegetables and seasonings.[Citation2,Citation3] Steamed stuffed buns ripen in the same way as Chinese steamed buns, producing soft and moist bread crumbs and a thin, smooth white crust instead of the brown crust of traditional Western-style baked bread. Compared with baked bread, there is no Maillard reaction during baking at high temperatures, resulting in fewer amounts of toxic acrylamide and furan. The addition of stuffing provides steamed buns with more nutritional and edible properties.[Citation4] Moreover, the relatively low steaming temperature used during production better preserves the protein quality of steamed buns and ensures a higher lysine utilization rate than baked bread, which is very important for national nutrition.[Citation5]
Frozen dough, which effectively prolongs the shelf life of bread and is widely used, ensures the freshness of bread and has gradually replaced traditional bread production. To meet the need for product flexibility and rapid response to consumer trends, research interest in frozen dough technology has increased since its advent in the 1970s.[Citation6] Frozen dough is of great benefit to both manufacturers and consumers. For manufacturers, frozen dough facilitates processing, trading, and retail capacity and significantly improves the shelf life of dough. For consumers, frozen dough allows them to taste fresh bread anytime and anywhere. However, although freezing prolongs the shelf life of the dough, the process of freezing and storage also reduces dough strength, lowers gas retention, and increases fermentation time, thus affecting the quality of the final product.[Citation7]
In addition to ordinary frozen fermented dough, unfermented and pre-fermented products are also available. Unfermented dough is widely used in croissants and Danish bread; while pre-fermented dough is frozen after dough preparation and is used in bread and rolls.[Citation8] To the best of our knowledge, the effects of repeated freezing and thawing on dough processing quality are largely ignored.
According to previous studies, repeated freezing and thawing is inevitable during production, transportation, and sale. Zhang Yanyan et al.[Citation9] found that temperature changes are a core issue in the cold chain of the dough industry and have an important relationship with final food quality.To predict the structural and functional properties of wheat starch subjected to multiple freezing/thawing cycles, Tao Han and Wang Pei[Citation10]suggested that freezing/thawing treatments caused increases in the contents of damaged starch and leaching materials, as well as morphological changes in the starch granules. Xu Ke et al.[Citation11] found that freezing/thawing treatment resulted in inferior quality for steamed bread by decreasing the specific volume, springiness and cohesiveness of steamed bread, while increasing hardness and chewiness. Thus, to provide consumers with high-value dough products and further improve freeze-thaw stability, it is necessary to conduct more research on the changes occurring in starch properties, protein properties, cooking and textural properties of dough during repeated freezing and thawing cycles, as well as the distribution of water in the dough.
To explore the mechanisms for freeze-thaw treatments and their effects on the processing quality of frozen pre-fermented RBSB and the nutritional quality of products, the primary purposes of this study are (1) to analyze the changes in water fluidity and frozen water content of the dough; (2) to evaluate the changes in the starch properties of the dough; (3) to understand the changes in the protein structure of the dough; and (4) to compare the color differences, textures and amino acid qualities of RBSB products.
Materials and methods
Materials
Wheat flour (moisture content 14%, protein content 18%, starch content 70.21%, crude fat 3.0%) was purchased from Shanghai Yihaijiali Grain, Oil and Food Industry Co., Ltd. (Shanghai, China). Highly active dry yeast was purchased from Lesaffre Yeast Co., Ltd. (Shanghai, China). Red bean paste(protein 4.9 g/100 g, fat 11.3 g/100 g, carbohydrate 46.5 g/100 g, starch 63.87% (dry matter)) was purchased from Shanghai Qiaojiaga Food Factory (Shanghai, China). Sugar was purchased from a supermarket. Deionized water was used throughout the experiment. All chemicals were of analytical grade unless otherwise specified.
Frozen dough preparation and steaming procedure
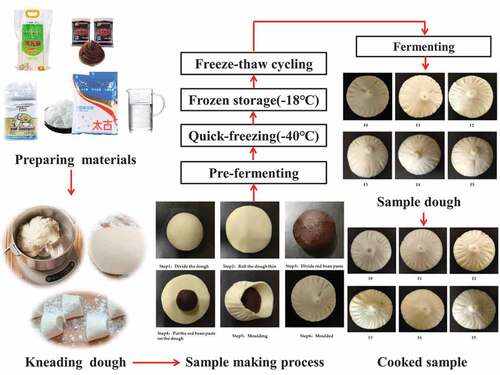
The basic recipe for RBSB included 300 g of flour, 5 g of yeast, 9 g of sugar, and 150 g of water. All ingredients were mixed and kneaded in a mixer (MK-HKM200 Mixer, Panasonic Co., Ltd., Shanghai,China) at 60 rpm for 2 min and at 120 rpm for 3–5 min to achieve complete development. Using preliminary assays, the mixing time was carefully optimized to produce smooth dough with the optimum steamed bread character. The dough was divided into 30 g pieces, and the red bean was divided into 15 g pieces; the dough was then made into RBSB by adding the red bean filling through hand molding or machine molding, and transferred to a fermentation room for approximately 30 min (at 35°C and 75% humidity). After that, these pieces were frozen in a mechanical blast freezer for 2 h at −40°C to a core temperature of −18°C. Immediately, the sample pieces were packed in double high-density polyethylene bags, sealed, and stored at −18°C.[Citation12] Freeze-thaw treatments were applied to the frozen dough samples to mimic the temperature fluctuations that occur during frozen storage. A freeze-thaw cycle consisted of partially thawing the frozen dough in an oscillator at room temperature (30°C) until the center temperature was 15°C and then subjecting it to frozen storage again at −18°C for 24 h. The frozen dough samples after a certain number of freeze-thaw cycles were designated F0, F1, F2, F3, F4, and F5, in which the number represents the number of freeze-thaw cycles to which the dough samples were subjected.[Citation13] After each freeze-thaw cycle, the RBSB dough was kept at 35°C and 75% relative humidity for 30 min, and then steamed in a tray above boiling water for 15 min. After steaming, the RBSB was cooled for exactly 1 h to room temperature and packed into plastic bags for further analysis(color, texture, amino). A brief production flow chart is shown in .
Figure 1. Production flow chart of pre-fermented red bean steamed buns.
Low-field nuclear magnetic resonance (LF-NMR) measurement
Transverse relaxation time analyses were performed using a low-resolution Ac-cuFat-1050 NMR spectrometer (Magmai Medical Technology Co., Ltd, Nanjing,China) operating at a 1 H resonance frequency of 21 MHz. The RBSB dough sample (15 ± 0.1 g) was weighed and placed into a nuclear magnetic test tube that was then placed in the center of the radio frequency coil at the center of the permanent magnetic field at a constant temperature (35°C). Spin-spin relaxation times were measured using Carr-Purcell-Meiboom-Gill (CPMG) pulse sequences. The parameters set for the CPMG experiment were SW = 250, TW = 300 µs, NECH = 3000, TE = 1000 m, and Ns = 32s. Each frozen dough sample was measured in triplicate.
Differential scanning calorimetry (DSC) measurement
Using the method described by He Yijie[Citation14] with slight modifications, the freezable water content of the dough samples was assessed using a NETZSCH 204 F1 differential scanning calorimetry (DSC) instrument equipped with a refrigerated GONG et al. cooling system (NETZSCH, GmbH, Selb, Germany). The instrument was operated in a dry nitrogen atmosphere, and an empty pan was used as the reference. Approximately 10 mg of the thawed RBSB sample was weighed and immediately sealed in an aluminum pan. The temperature profile was as follows: equilibration at 20°C for 5 min, cooled to −20°C at a rate of 5°C/min, equilibration at −20°C for 5 min, and then heated to 20°C at a rate of 5°C/min. The melting enthalpies (ΔH) of RBSB dough samples with a series of moisture contents were determined. The freezable water content was calculated directly from the enthalpy (ΔH) of the dough divided by that of pure water.
X-ray diffraction analysis
X-ray diffraction (XRD) patterns were obtained by a D8 Advance X-ray diffractometer (Bruker-AXS, Karlsruhe,Germany). The freeze-dried powder(Remove the stuffing (red bean paste)) of the RBSB dough pieces were moistened in a desiccator, where a saturated solution of NaCl maintained a constant humidity atmosphere for two weeks at 25°C. Then, the dough sample was analyzed by a diffractometer at 200 mA and 40 kV, and the diffraction angle (2θ) ranged from 3°-40° at a speed of 0.02 with an account time of 0.6 s. The relative crystallinity (%) was calculated by MDI Jade 6 software.[Citation15]
Lamellar structure analysis
The lamellar structure of the freeze-dried powder (Remove the stuffing (red bean paste)) of the RBSB dough pieces was analyzed using a Bruker NanoStar small-angle X-ray scattering (SAXS) in-strument (D8 Advance (Superspeed), Bruker-AXS, Karlsruhe,Germany) following the method of Lin Lingshang et al..[Citation16] The SAXS data were analyzed using DIFFRAC plus Nano Fit software, and the SAXS spectrum parameters were determined following the simple graphical method.
Fourier transform infrared (FTIR) spectroscopy
The secondary structures of the freeze-dried powder of the RBSB dough pieces were characterized using Fourier transform infrared (FTIR) spectroscopy. The samples were mixed with KBr at a ratio 1:100 (w/w) and ground before being pressed into a pellet. FTIR spectra were obtained from 400 to 4,000 cm−1 during 64 scans with 4 cm−1 resolution using a Nicolet 5700 FTIR spectrometer (45° incidence angle) (Varian 7000, PIKE Technologies, California, USA).[Citation17] The raw spectra and the overlapping amide I band (1600–1700 cm −1) were pre-processed and analyzed by OMNIC (Thermal Inc.) and Peak Fit Version 4.12 software (SPSS Inc., Chicago, IL, USA).[Citation18]
Color of the red bean steamed buns
The external (crust) color of the whole RBSB was measured by a chroma meter (Sanenshi Science and Technology Medical Technology Co., Ltd. 3nH, Shenzhen,China), which was calibrated before the measurement by white and black standard tiles. The determining indicators were the values of L* (lightness, white-black), a* (color-opponent dimension, red-green), and b* (color-opponent dimension, yellow-blue). Every sample was measured six times.
Instrumental Textural properties of the red bean steamed buns
The texture profile analysis technique was used to measure the textural properties of the RBSB using a TMS-PRO texture analyzer (FTC Co., Ltd. Scarsdale, NY, USA) equipped with a P/75 probe. Red bean steamed buns(the entire sample includes dough and stuffing)was used as the measurable sample. The measurements were conducted with a pretest speed of 2.0 mm/s, a test speed of 1.0 mm/s, a posttest speed of 1.0 mm/s, and a 0.1 N trigger force. The deformation level was 60% of the sample height. Indicators determined by this test include the hardness, springiness, cohesiveness, chewiness, and resilience properties. Each sample was tested six times.
Amino acid analysis
The frozen RBSB were steamed in the tray above boiling water for 15 min and freeze-dried after cooling. Then, the samples were milled using an ultracentrifuge mill. The resulting mixture was analyzed by an Agilent 1100 high-performance liquid chromatography (HPLC) system (Agilent, Palo Alto, CA,USA). Samples were weighed in test tubes with screw caps: 200 mg of dough and 100 mg of red bean filling. (1) The samples were first subjected to hydrolysis, in which 8 mL of 6 N HCl was slowly added while gently turning the hydrolysis tube to ensure that the sample was thoroughly wetted. Then the sample was placed under vacuum and sealed by an alcohol blowtorch after 5 min. (2) Hydrolysis was conducted at 110 ± 1°C for 22–24 h. (3) The deionized water used for cutting the hydrolysis tube was transferred to a 25 mL bottle up to a certain volume, and filtered with double-layer filter paper. Then, 1 mL of the filtrate was placed in a small 25 mL beaker and evaporated in a vacuum dryer with NaOH (water bath was set to no more than 50°C). After the addition of 1 mL of HCl (pH = 2.2) to dissolve the filtrate, the solution was transferred to a 1.5 mL centrifuge tube and centrifugated at 10000 rpm/min for 10 min. Then, 0.5 mL of the supernatant was added to the sample bottle.[Citation19]
Statistical analysis
The results were analyzed by one-way analysis of variance (ANOVA) with Duncan’s post hoc test at a significance level of p <0.05 using SPSS 23.0 software (IBM Corporation, Armonk, NY, USA). The graphs were drawn using Origin 2021 Pro (Origin Lab Corporation, Northhampton, MA, USA).
Results
Water mobility of the dough
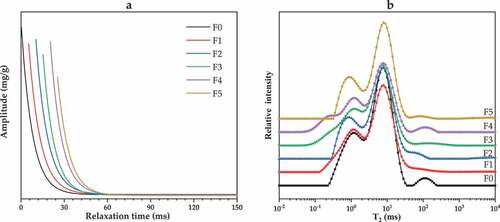
The effect on T2 of frozen dough is shown in . shows the CPMG relaxation decay curves of the samples. With the increase in the number of freeze-thaw cycles, the CPMG signal began to attenuate, especially after F1, F3, F5; notably, the CPMG signal was attenuated rapidly, and the attenuation time gradually shortened. This revealed that the increase or decrease in relaxation time was more pronounced as the duration of freeze-thaw process increased.[Citation20] T2 relaxation spectra of samples that underwent different numbers of freeze-thaw cycles are shown in . provides the data for T21 and T22 peak area proportions after freeze-thaw cycling. The T21 of frozen dough after freezing suggested that the freezing treatment had no significant influence. After F3, the T21 of frozen dough reached a minimum value and was decreased by 12.32% compared with F0. However, remarkable changes in the T22 values of frozen dough were observed after F5. Freeze-thaw processing induced a reduction in the initial T2 and an increase in the final T2, which indicated that the heterogeneity of proton mobility in the population increased, and this was due to formation of a starch-deficient phase.[Citation21] After the freeze-thaw cycles, the A21 of the control dough decreased from 3.98% to 2.92% (F3),- increased to 3.97% (F4), and – decreased to 3.52% (F5), whereas the A22 decreased from 84.60% to 77.57% (F2),- increased to 88.68% (F3), and- decreased to 84.72% (F5). This indicated that freeze-thaw treatments drove the water shift toward a more mobile state. The tightly bound water was attributed to protein and water molecular interactions in the frozen dough. The decrease in the content of water bound in this form indicated that the treatment weakened the interactions between proteins and water molecules. Less tightly bound water was mainly produced by interactions between starch and water molecules in the frozen dough. The decrease in the content of water bound in this form indicated that the interactions between starch and water molecules were weakened.[Citation14] During frozen storage, water separated from the starch–gluten matrix by crystallizing into ice crystals. During thawing, the ice crystals melted, and the resulting water phase interacted with the gluten matrix, thus reducing the water binding capacity of the dough gluten.[Citation22] However, the T21 and T22 values for pre-fermented frozen RBSB dough showed irregular trends with increasing numbers of freeze-thaw cycles; thus, the freeze-thaw cycles greatly affected the water state of the frozen dough.
Table 1. Change of NMR parameters after freeze-thaw cycles
Figure 2. (a)CPMG relaxation decay curves, (b)T2 relaxation spectra.
Thermal properties of the dough
The effects of freeze-thaw cycles on the DSC thermograms and other water properties of pre-fermented frozen RBSB dough are presented in . The melting curves of the dough shifted after freeze-thaw cycling, but they shifted in different ways. Thermal properties, such as the onset temperature (To), final temperature (Tf), peak temperature (Tp), gelatinization enthalpy (ΔH), and freezable water (FW), of frozen dough are shown in . shows that, the melting temperatures of ice varied between −5.67°C and −3.43°C. Compared with F0, the number of freeze-thaw cycles significantly affected the initial melting point and ice crystal melting range (p <0.05). In our study, the peak temperature increased from −0.27°C in F0 to 0.27°C after F2. Huang Li Qun noted that increases in peak temperatures after prolonged frozen storage were mainly due to a decreasing amount of solute in the dough system.[Citation23] The gelatinization enthalpies (ΔH) involved in gelatinization and melting of the pre-fermented frozen RBSB dough showed no significant difference (p >0.05). However, with an increase in the number of freeze-thaw cycles, ΔH showed an overall upwards trend.
Table 2. Change of melting performance of frozen doughs after freeze-thaw treatment
Figure 3. Change of melting curve of frozen doughs after freeze-thaw treatment.
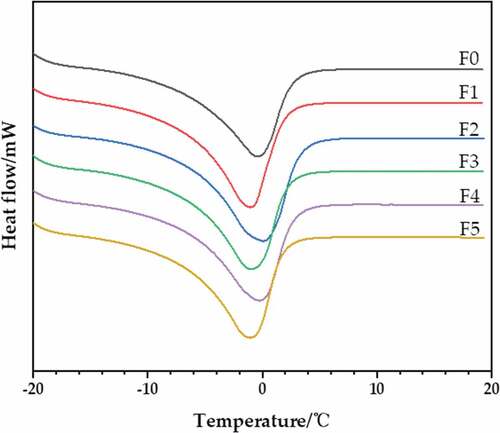
Moreover, recrystallization of ice crystals probably occurred during frozen storage and might induce changes in the structures and arrangements of amylose and amylopectin, which would lead to increases in ΔH with increased storage time.[Citation24] The freezable water content of the frozen dough increased with increasing numbers of freeze-thaw cycles. The highest freezable water content was (14.68%) after F1, which was 2.41% above that of the control (12.27%). Freezable water comprises free water and some of the bound water. Water in different states presents various crystallization features, and abnormal expansion damages the 3D network structures of proteins in yeast cells.[Citation25] Freeze-thaw cycling increased the number and volume of crystals by inhibiting migration of frozen water in the dough during freezing and further increased the physical damage done to the gluten network by ice crystals, thereby reducing the stability of the gluten network during the freezing process.
XRD and starch crystallinity
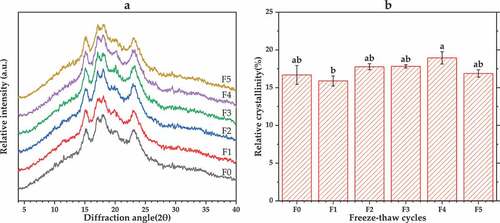
illustrates the XRD patterns and relative crystallinities (RCs) of the samples. All samples showed a pattern with single peaks at 15° and 23°, and a conjoined double peak at 17° and 18°, which is the typical spectrum of an A-type starch ().[Citation26] A weak peak at 20°, exhibited a V-type structure, due to amylose-lipid complex formation.[Citation27] The RCs were calculated from the diffractograms, and the results are presented in . With an increase in the number of freeze-thaw cycles, the RC value of the dough showed an upwards trend during F5 before suddenly decreasing (p <0.05), and the highest crystallinity values were observed after F4 (18.96%). Starch crystallinity was attributed to packing of double helices in a channel formed by hexagonally packed double helices and water molecules. In contrast, the double helices and water molecules were associated via inter- and intramolecular hydrogen bonds.[Citation28] During freezing, the internal or external ice crystals occupied more space than an equal amount of water due to volume expansion. This pressure compressed and crumbled the granules in the high-pressure chamber and allowed the amylose molecules to align and release trapped moisture, thereby favoring the formation of crystalline starch.[Citation29] Therefore, freezing-thaw cycles disrupted the ordered structures of starch molecules, resulting in disorganization of starch crystallites and destroying the quality of the product by altering moisture relationships.[Citation30]
Figure 4. (a) X-ray spectra, (b) The relative crystallinity.
Furthermore, a correlation study involving starch crystallinity, textural properties and secondary structure analyses was performed. Starch crystallinity exhibited negative correlations with Hardness, Adhesiveness, Springiness, Chewiness, and the quantities of α-helixes, β-sheets, β-turns, and positive correlations with Cohesiveness and random coil formation. This further illustrated that crystallinity is an important indicator for evaluating the quality attributes of RBSB during the freeze thaw process.
Lamellar structure of wheat starch
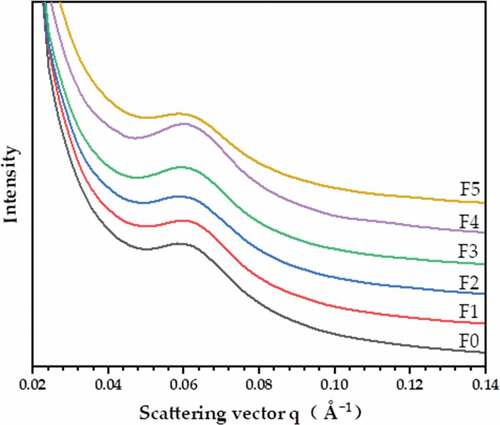
SAXS spectra of the samples are shown in . All pieces showed a prominent scattering peak at approximately 0.06 Å−1. As seen in the figure, the lamellar peak positions (Smax) were similar, suggesting that the number of freeze-thaw cycles did not significantly change the peak position. The lamellar parameters are presented in . There were differences among the peak intensities (IMAX) for different samples, and these reached the highest values after F4(72.73). The differences suggested that freeze-thaw treatment strongly disrupted the periodic arrangements of crystalline and amorphous lamellae.[Citation31] The half-peak width (ΔS) showed an upwards and downwards trend at first; freeze-thaw cycling initially led to a slight increase in the sample peak width, but this decreased with an increase in the number of freeze-thaw cycles. Hongwei Wang et al. suggested that the increase in the half-peak width mainly resulted from micromechanical forces generated by ice crystals during the frozen stage, which strengthened the alignment and packing of helical components in the semicrystalline lamellae region.[Citation32] However, after freezing and thawing for 4–5 cycles, the peak width decreased, which may be due to the increase in the number of freezing cycles. Freezing of water external to the lamellae led to the compression of amorphous lamellae, and at constant mass, this compression would account for the increased electron densities of the amorphous lamellae.[Citation33] The thickness (D) of the lamellae first increased, before decreasing and then increasing again. In addition, these lamellar structures facilitated redistribution of water molecules during the thawing stage. Then, more ice crystals formed within the lamellar structure in the freezing stage. The formation of ice crystals led to increased volume and further damage to the lamellar structure.[Citation34] P.A. Perry et al.[Citation33]showed that all of the starches they investigated exhibited transition temperatures ranging from 6~-14°C. In this study, the frozen dough was stored at −18°C, which was much lower than the glass transition temperature (Tg) of frozen dough and caused the lamellar structure to collapse. In addition, this temperature hindered uniform generation of ice and aggregation of wheat starch molecular chains during repeated freeze-thaw treatments. The linking bridges of the main structure were quickly interrupted by repeated freeze-thaw treatments.[Citation35] Therefore, with an increase in the number of freeze-thaw cycles, the hydration effect increased, which decreased the distance between lamellar structures, and then increased again. Notably, the lamellar structure of the sample was destroyed.
Table 3. Change of lamellar structure of starch of frozen dough after freeze-thaw treatment
Figure 5. SAXS pattern of frozen doughs after freeze-thaw treatment.
Secondary structure of the dough
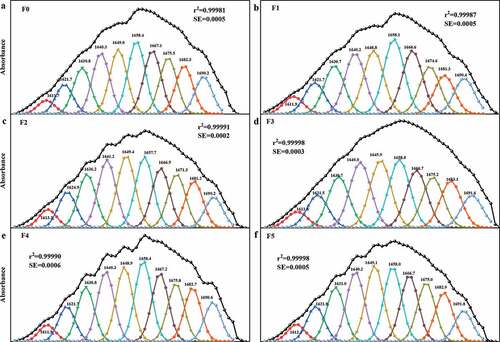
To elucidate the effects of freeze-thaw cycling on the secondary structure of RBSB dough, second derivative difference spectra were analyzed for the amide I region of the flour dough after different numbers of freeze-thaw cycles. The secondary structure indicated by the 1700–1600 cm−1 amide I band region and deconvolution after baseline correction and Gaussian smoothing are shown in . Peaks in the spectral range from 1620–1644 cm−1 were assigned to β-sheets, those from 1644–1652 cm−1 to unordered structures, those from 1652–1660 cm-1 to α-helices, and those from 1660–1685 cm-1 to β-turn structures,[Citation36] The secondary structures indicated by the amide I region were quantified according to the assignments of these bands (). There was no significant difference in the relative content of β-sheets after freeze-thaw cycling, which was consistent with the work of Yu Wenjie et al., who believed that frozen storage would not cause substantial changes in β-sheets.[Citation37] During freeze-thaw treatments, the α-helices structures of the dough presented an irregular trend. They first decreased and then increased before decreasing again with increasing numbers of freeze-thaw cycles; the minimum value was obtained for F5 (15.01%). Some studies have shown that decreases in α-helices structures indicated weaker hydrogen bond interactions and dough adhesion. The higher the relative content of the α-helix, the higher the order of the protein. Upon increasing the freezing time, the relative content of α-helixes decreased, indicating that the secondary structure of the protein became disordered during the freeze-thaw process.[Citation38,Citation39] RBSB dough showed a decrease of 9.91% for β-turns, while an increase of 28.58% was observed for random coils after F5. Konrad Kłosok et al.[Citation40] suggested that the presence of tyrosine, threonine, serine, glutamine, and proline induced formation of type II β-turns, which were dominant in ω-gliadin and sensitive to freezing parameters during frozen storage. Additionally, Wang Pei et al.[Citation12] suggested that consecutive β-turn structures were implicated as one of the structural elements responsible for the viscoelasticity of dough. The greater the amount of this structural element was in the dough, the greater the ability of the dough to trap gas bubbles; thus, the volume of the bread loaf would be greater. Therefore, freeze-thaw cycling affected the viscoelasticity and specific volume of the product. Moreover, it may be that the gluten structure of yeast dough was more fragile and more vulnerable to ice crystal pressure, which probably led to gluten molecule aggregation and made the relative content of random coils increase significantly after freeze-thaw treatments.[Citation11]
Table 4. Estimation of the secondary structural compositions of frozen dough after freeze-thaw cycles
Figure 6. FTIR spectra and curve fitting results of frozen doughs after freeze-thaw treatment.
In this study, correlation analyses showed, that there was a significant positive correlation between the number of β-turns and A21 (r = 0.817, p <0.05). Thus, our results revealed that freeze-thaw treatment damaged the molecular structure of the dough during freezing, inhibited rearrangement and self-assembly of protein molecules, and made the protein structure more disordered.
Color of the red bean steamed buns
The effects of freeze-thaw cycling on color indexes such as the brightness, redness, and yellowness of frozen RBSB are shown in . Freeze-thaw treatment significantly affected the L*, a*, and b* values. During freeze-thaw cycling, L* decreased linearly, but the decreases were not significant after three cycles. It may be that an increase in the temperature fluctuation frequency affects the soluble glutenins in flour and, leads to destruction of the gluten network structure. Thus, the structure was no longer tight, reflection of light became weaker, and the color darkened. This finding agreed to some extent with the results of Wang Pei et al.[Citation41] and J.-B Ohm et al.[Citation42] On the other hand, a* increased linearly. MA JIE et al.[Citation43] thought this result was probably due to generation of more sugars from increased hydrolysis of the damaged starch during extrusion cooking, which accelerated the Maillard reaction and sugar caramelization. However, the method for ripening bean paste steamed buns was different from that of bread, and steaming reduced the occurrence of the Maillard reaction. Therefore, the increase in redness may be directly related to migration of the bean paste stuffing core to the yeast hole surface during repeated freezing and thawing. In addition, the freeze-thaw cycles reduced the b* value of the sample; this could be caused by temperature fluctuations that reduced the number of cells and thickened the cells wall of the RBSB, thereby leading to more brownish crumbs.[Citation12] Appealing RBSB should have a relatively white and smooth skin and evenly distributed delicate gas cells within thin cell walls. Notably, the color quality of the product will be affected after more than three freeze-thaw cycles.
Table 5. The color of the products after freeze-thaw cycles
Textural analysis of red bean steamed buns
The textural properties of cooked RBSB products that underwent different numbers of freeze-thaw cycles are shown in . There were significant differences in quality indexes after different numbers of freeze-thaw treatments. The hardness of RBSB showed an increasing trend and, reaching its minimum (17.02 N) after 4 freeze-thaw cycles and its maximum (24.15 N) after 5 cycles. However, multiple freeze-thaw cycles led to an increase in dough hardness, which, on the one hand, was related to retrogradation of starch, and on the other hand, to a lower frozen water content.[Citation44] Zhang Yanjie et al.[Citation45] found that the texture of steamed bread with fewer ice crystals was softer and more stable. After many freezing treatments, the frozen water content directly affected the content of ice crystals formed during frozen storage. The ice crystals formed during frozen storage destroyed the integrity of the gluten network. Adhesion of the product changed irregularly after freezing and thawing, and a higher adhesion value may be caused by an increase in soluble matter generated by destruction of the gluten structure during freezing.[Citation46] Meng Kexin et al.[Citation47] suggested that dough elasticity tended to increase, which may have been caused by microbial fermentation in the dough. Unlike other products, RBSBs are required to have a soft skin because of their stuffing; thus, high elasticity does not mean that the product is of better quality. Cohesiveness is related to the integrity of the sample. There was no significant difference in cohesion of the product after freeze-thaw treatment. Nevertheless, the overall trend was a decreasing one, which indicated that freeze-thaw treatments decreased the cohesion of RBSBs. This result was reflected in the obtained gluten values, which were markedly low.[Citation48] Freeze-thaw treatment made a large difference in the chewiness of a steamed bun stuffed with red bean paste, and Daniela F. et al.[Citation49] believed that the differences in chewiness of the frozen products confirmed the possibility of structural damage. Better fermentation products are larger and softer.[Citation44] Notably, the hardness, chewiness, and stickiness of the F3 and F5 RBSBs were greater, which led to a bad taste.
Table 6. The textural of the products after freeze-thaw cycles
Amino acid composition and evaluation
Amino acids play an essential role in protein formation and metabolism. At the same time, wheat products are important sources of amino acids in countries with flour products as staple foods, and they significantly affect the daily nutritional balance.[Citation50] The amino acid compositions of RBSBs after different numbers of freeze-thaw treatments are shown in . The contents of all amino acids decreased after different numbers of freeze-thaw cycles. Among all RBSB samples, glutamic acid was the most abundant nonessential amino acid, followed by aspartic acid, serine, and glycine. This resulted because wheat flour accounted for 2/3 of the RBSB, and studies have shown that alanine, serine, aspartic acid, and glutamic acid are the primary amino acids in wheat fractions. The decrease in the aspartic acid content was due to consumption by the RBSB during the process of repeated fermentation, and the aspartic acid content reached its lowest value (0.54 g/100 g) after F3.[Citation51] The decrease in serine content was obvious, and was consistent with the results of Jacek Słupski et al.[Citation52] Arginine and lysine contents did not decrease significantly because charged amino acids show marked cryoprotective activity.[Citation53] Additionally, Jun Shima et al.[Citation54] found that intracellular arginine and/or glutamate accumulated and enhanced the freeze tolerance in car1 mutants derived from commercial baker’s yeast. Nevertheless, in this study, the content of glutamate was decreased significantly with freeze-thaw treatment. KOH BONG-KYUNG et al.[Citation55] showed that the addition of 1% methionine and phenylalanine effectively increased the bread volume of unfrozen dough and kept the frozen dough from being destroyed. In this study, only phenylalanine showed insensitivity to freeze-thaw cycling. However, methionine reached its lowest level during F5, which may have been affected by culinary or technological processing.[Citation52] Additionally, decreases in the frozen water contents of freeze-thaw-treated samples was another important factor.[Citation56] M. A. Abdelaleem et al.[Citation57] found that among gluten protein amino acids, cysteine generally played an essential role in gluten function and structure. In this study, all samples showed significant decreases in cysteine contents after frozen storage followed by thawing, possibly because the gluten structure was destroyed. Some studies have suggested that freeze-thaw storage times had no significant impact on the content of free amino groups in wheat gluten and other samples[Citation58,Citation59] In contrast, GARCı́A-ARIAS M T et al.[Citation60] suggested that frozen storage followed by thawing induced losses in the nutritional quality of samples, and this decrease might hurt protein digestibility and metabolic utilization. Jiang Xiaoling et al.[Citation61] reported that the amino acid content was decreased when making steamed bread, which was caused by the added yeast. In addition, the amino acid levels in wheat dough depend on the pH, the fermentation time, the proteolytic activity of the microflora and/or flour enzymes, and the consumption of amino acids by lactic acid bacteria (LAB) and/or yeasts.[Citation62] Therefore, the changes in amino acids vary, and the specific mechanisms for changes caused by freeze-thaw treatment of RBSB products should be studied further.
Table 7. The Amino acid composition of the products after freeze-thaw cycles (g/100 g)
Conclusion
This study examined the effects of freeze-thaw cycling on dough and cooked RBSB products. The physical and chemical properties of the dough and the edible quality and nutritional characteristics of the cooked RBSBs were investigated. With an increase in the number of freeze-thaw cycles, the ice recrystallized in the dough, which resulted in a decrease in the content of strongly bound water and an increase in the content of frozen water. Multiple freeze-thaw cycles changed the ordered structure of starch by, increasing the relative crystallinity, peak intensity, and layered structure. Furthermore, freeze-thaw cycling destroyed the molecular structures of the proteins in dough. Through rearrangements and self-assembly of protein molecules, the relative content of α-helices was significantly increased and then decreased, and the relative contents (%) of β-turns and random coils increased and then decreased, making the protein structure more disordered. After freeze-thaw cycling, the L* value of RBSBs decreased significantly, while the hardness and chewiness increased greatly; moreover, the relative content of amino acids decreased. Our study explored the deterioration of frozen raw RBSB dough during simulated freeze-thaw cycling, and analyzed the main influencing factors. Our findings provided experimental evidence and rationales with which to select optimal solutions to prevent deterioration of the physicochemical properties of RBSB dough(such as improving the integrity of the gluten protein network, and enhancing the freeze-thaw tolerance of yeast), and further improve the edible and nutritional quality of frozen steamed products.
Disclosure statement
No potential conflict of interest was reported by the author(s).
Additional information
Funding
Notes
1. This research was also supported by a grant from Construction Project of Cooperative Innovation platform of Yangzhou University (No.YZ2020267)
References
- LI, K.; Zhang, M.; Bhandari, B.; LI, L.; Yang, C. Effect of Pre‐emulsified Soybean Oil as a Fat Replacer on the Physical and Sensory Attributes of Reduced‐fat filling in Steamed Buns. J. Food Process Eng. 2019, 43(2). DOI:10.1111/jfpe.13306.
- LI, Y.; Zhang, C.; Jiang, X.; Gao, M.;Yao, X.;Liu, H.;Wang, J.;Zhang, H.;Zhang, C. The Effects of Different Additives on the Physical Properties of dumpling Wrapper. J. Food Meas. Charact. 2019, 13(4), 3077–3085. DOI: 10.1007/s11694-019-00230-4.
- LI, J. R.; Hsieh, Y. H. Traditional Chinese Food Technology and Cuisine. Asia Pac. J. Clin. Nutr. 2004, 13(2), 147–155.
- Zhu, F. Influence of Ingredients and Chemical Components on the Quality of Chinese Steamed Bread. Food Chem. 2014, 163, 154–162. DOI: 10.1016/j.foodchem.2014.04.067.
- Wang, P.; Tao, H.; Jin, Z., and Xu, X. The Final Established Physicochemical Properties of Steamed Bread Made from Frozen Dough: Study of the Combined Effects of Gluten Polymerization, Water Content and Starch Crystallinity on Bread Firmness. J. Cereal Sci. 2015, 63, 116–121. DOI: 10.1016/j.jcs.2015.03.008.
- Luo, W.; Sun, D.-W.; Zhu, Z., and Wang, Q.-J. Improving Freeze Tolerance of Yeast and Dough Properties for Enhancing Frozen Dough Quality - A Review of Effective Methods. Trends Food Sci. Technol. 2018, 72, 25–33. DOI: 10.1016/j.tifs.2017.11.017.
- Kondakci, T.; Ang, A. M. Y.; Zhou, W. Impact of Sodium Alginate and Xanthan Gum on the Quality of Steamed Bread Made from Frozen Dough. Cereal Chem. J. 2015, 92(3), 236–245. DOI: 10.1094/cchem-03-14-0036-r.
- Omedi, J. O.; Huang, W.; Zhang, B.; Li, Z.; Zheng, J. . Advances in Present-day Frozen Dough Technology and Its Improver and Novel Biotech Ingredients Development trends-A Review. Cereal Chem. 2019, 96(1), 34–56. DOI: 10.1002/cche.10122.
- Zhang, Y.; Li, Y.; Liu, Y., and Zhang, H. . Effects of Multiple Freeze-thaw Cycles on the Quality of Frozen Dough. Cereal Chem. 2018, 95(4), 499–507. DOI: 10.1002/cche.10053.
- Tao, H.; Wang, P.; Ali, B.; Wu, F.; Jin, Z., and Xu, X. . Structural and Functional Properties of Wheat Starch Affected by Multiple Freezing/thawing Cycles. Starch - Stärke. 2015, 67(7–8), 683–691. DOI: 10.1002/star.201500036.
- Xu, K.; Chi, C.; She, Z.; Liu, X.; Zhang, Y.; Wang, H., and Zhang, H. . Understanding How Starch Constituent in Frozen Dough following Freezing-thawing Treatment Affected Quality of Steamed Bread. Food Chemistry 2022, 366, 130614. DOI: 10.1016/j.foodchem.2021.130614.
- Wang, P.; Yang, R.; Gu, Z.; Xu, X., and Jin, Z. . Comparative Study on the Freeze Stability of Yeast and Chemical Leavened Steamed Bread Dough. Food Chemistry 2017, 221, 482–488. DOI: 10.1016/j.foodchem.2016.10.108.
- Ding, X.; LI, T.; Zhang, H.; Guan, C.; Qian, J., and Zhou, X. . Effect of Barley Antifreeze Protein on Dough and Bread during Freezing and Freeze-Thaw Cycles. Foods 2020, 9(11), 1698. DOI: 10.3390/foods9111698.
- He, Y.; Guo, J.; Ren, G.;Cui, G.;Han, S.;Liu, J. Effects of Konjac Glucomannan on the Water Distribution of Frozen Dough and Corresponding Steamed Bread Quality. Food Chem. 2020, 330. DOI: 10.1016/j.foodchem.2020.127243.
- Zhu, D.; Zhang, H.; Guo, B.; Xu, K.; Dai, Q.; Wei, C.; Zhou, G., and Huo, Z. Physicochemical Properties of Indica-japonica Hybrid Rice Starch from Chinese Varieties. Food Hydrocolloids 2017, 63, 356–363. DOI: 10.1016/j.foodhyd.2016.09.013.
- Lin, L.; Guo, K.; Zhang, L.; Zhang, C.; Liu, Q., and Wei, C. Effects of Molecular Compositions on crystalline Structure and Functional Properties of Rice Starches with different Amylopectin Extra-long Chains. Food Hydrocolloids 2019, 88, 137–145. DOI: 10.1016/j.foodhyd.2018.09.033.
- Zhao, Q.; Xiong, H.; Selomulya, C.; Chen, X. D.; Huang, S.; Ruan, X.; Zhou, Q., and Sun, W. Effects of Spray Drying and Freeze Drying on the Properties of Protein Isolate from Rice Dreg Protein. Food Bioprocess. Technol. 2013, 6(7), 1759–1769. DOI: 10.1007/s11947-012-0844-3.
- Zhang, Y.; LI, Y.; Wang, H.;Aoo, B.;Zhang, H.;Liu, X. Effects of Ultrasound-assisted Freezing on the Water Migration of Dough and the Structural Characteristics of Gluten Components. J. Cereal Sci. 2020, 94. DOI: 10.1016/j.jcs.2019.102893.
- Zhao, Z.; Mu, T.; Sun, H. Comparative Study of the Nutritional Quality of Potato Steamed Bread Fermented by Different Sourdoughs. J. Food Process. Preserv. 2019, 43(9). DOI: 10.1111/jfpp.14080.
- Al-habsi, N. A.; Al-hadhrami, S.; Al-kasbi, H., and Rahman, M. S. Molecular Mobility of Fish Flesh Measured by Low-field Nuclear Magnetic Resonance (LF-NMR) Relaxation: Effects of Freeze–thaw Cycles. Fish. Sci. 2017, 83(5), 845–851. DOI: 10.1007/s12562-017-1114-0.
- Tang, X. J.; Liu, N.; Huang, W. N.; Cheng, X.Y.;Wang, F.; Zhang, B.L.;Chen, J.F.;Jiang, H.;Omedi, J.O.;Li, Z.B. Syneresis Rate, Water Distribution, and Microstructure of Wheat Starch Gel during Freeze-thaw Process: Role of a High Molecular Weight Dextran Produced by Weissella Confusa QS813 from Traditional Sourdough. Cereal Chem. 2018, 95(1), 117–129. DOI: 10.1094/Cchem-08-17-0174-R.
- Ma, S.; Li, L.; Wang, X.-X.; Zheng, X.-L.; Bian, K., and Bao, Q.-D. Effect of Mechanically damaged Starch from Wheat Flour on the quality of Frozen Dough and Steamed Bread. Food Chemistry 2016, 202, 120–124. DOI: 10.1016/j.foodchem.2016.01.075.
- Huang, L.; Wan, J.; Huang, W.; Rayas-Duarte, P., and Liu, G. Effects of Glycerol on Water Properties and Steaming Performance of Prefermented Frozen Dough. J. Cereal Sci. 2011, 53(1), 19–24. DOI: 10.1016/j.jcs.2010.07.006.
- Gaikwad, S.; Arya, S. S. Influence of Frozen Storage on quality of multigrain Dough, Par Baked and Ready to Eat Thalipeeth with Additives. Lwt. 2018, 96, 350–356. DOI: 10.1016/j.lwt.2018.05.057.
- Ren, S.; Ma, R. Effects of Xylanase on Quality of Frozen Dough Steamed Bread. Food Sci. Technol. Res. 2016, 22(4), 409–417. DOI: 10.3136/fstr.22.409.
- Jia, C.; Yang, W.; Yang, Z., and Ojobi, O. J. Study of the Mechanism of Improvement Due to Waxy Wheat Flour Addition on the Quality of Frozen Dough Bread. J. Cereal Sci. 2017, 75, 10–16. DOI: 10.1016/j.jcs.2017.03.007.
- Guo, L.; Xu, D.; Fang, F.; Jin, Z., and Xu, X. Effect of Glutathione on Wheat Dough Properties and Bread Quality. J. Cereal Sci. 2020, 96, 103116. DOI: 10.1016/j.jcs.2020.103116.
- Tao, H.; Li, M.; Deng, H.-D.; Ren, K.-X.; Zhuang, G.-Q.; Xu, X.-M., and Wang, H.-L. The Impact of Sodium Carbonate on Physico-chemical Properties and Cooking qualities of Starches Isolated from Alkaline Yellow Noodles. International Journal of Biological Macromolecules 2019, 137, 697–702. DOI: 10.1016/j.ijbiomac.2019.07.008.
- Wang, P.; Yang, R.; Gu, Z.; Xu, X.;Jin, Z. Comparative Study of Deterioration Procedure in Chemical-leavened Steamed Bread Dough under Frozen Storage and Freeze/thaw Condition. Food Chemistry 2017, 229, 464–471. DOI: 10.1016/j.foodchem.2017.02.122.
- Tao, H.; Zhang, B.; Wu, F.; Jin, Z., and Xu, X. Effect of Multiple Freezing/thawing-modified Wheat Starch on Dough Properties and Bread Quality Using a Reconstitution System. J. Cereal Sci. 2016, 69, 132–137. DOI: 10.1016/j.jcs.2016.03.001.
- Zhang, Z.; Fan, X.; Ma, H.; Li, C.; Li, E.; Gilbert, R.G. Characterization of the Baking-induced Changes in Starch Molecular and crystalline Structures in Sugar-snap Cookies. Carbohydr. Polym. 2021, 256. DOI: 10.1016/j.carbpol.2020.117518.
- Wang, H.; Xu, K.; Liu, X.; Zhang, Y.; Xie, X.; Zhang, H. Understanding the Structural, Pasting and Digestion Properties of Starch Isolated from Frozen Wheat Dough. Food Hydrocolloids 2021, 111. DOI: 10.1016/j.foodhyd.2020.106168.
- Perry, P. A.; Donald, A. M. The Effects of Low Temperatures on Starch Granule Structure. Polymer. 2000, 41(16), 6361–6373. DOI: 10.1016/S0032-3861(99)00813-7.
- Jing, L.; Liu, Y.; Gao, J.; Xu, M.; Gou, M.; Jiang, H.; Zhang, G.; Li, W. Effect of Repeated Freezing‐thawing on Structural, Physicochemical and Digestible Properties of Normal and Waxy Starch Gels. Int. J. Food Sci. 2019, 54(9). Doi:10.1111/ijfs.14177.
- Wang, L.; Xie, B.; Xiong, G.; Wu, W.; Wang, J.; Qiao, Y., and Liao, L. The Effect of Freeze–thaw Cycles on Microstructure and Physicochemical Properties of Four Starch Gels. Food Hydrocolloids 2013, 31(1), 61–67. DOI: 10.1016/j.foodhyd.2012.10.004.
- Bock, J. E.; Connelly, R. K.; Damodaran, S. Impact of Bran Addition on Water Properties and Gluten Secondary Structure in Wheat Flour Doughs Studied by Attenuated Total Reflectance Fourier Transform Infrared Spectroscopy. Cereal Chem. J. 2013, 90(4), 377–386. DOI: 10.1094/cchem-01-13-0008-fi.
- Yu, W.; Xu, D.; Zhang, H.;Guo, L.;Hong, T.; Zhang, W.;Jin, Y.; Xu, X. Effect of Pigskin Gelatin on Baking, Structural and Thermal Properties of Frozen Dough: Comprehensive Studies on Alteration of Gluten Network. Food Hydrocolloids 2020, 102. DOI: 10.1016/j.foodhyd.2019.105591.
- LI, Y.; Zhang, Y.; Liu, X.; Wang, H., and Zhang, H. Effect of Ultrasound-assisted Freezing on the Textural Characteristics of Dough and the Structural Characterization of Wheat Gluten. Journal of Food Science and Technology 2019, 56(7), 3380–3390. DOI: 10.1007/s13197-019-03822-6.
- Wang, B.; Li, Y.; Wang, H.; Liu, X.; Zhang, Y., and Zhang, H. In-situ Analysis of the Water Distribution and Protein Structure of Dough during Ultrasonic-assisted Freezing Based on Miniature Raman Spectroscopy. Ultrasonics Sonochemistry 2020, 67, 105149. DOI: 10.1016/j.ultsonch.2020.105149.
- Klosok, K.; Welc, R.; Fornal, E., and Nawrocka, A. Effects of Physical and Chemical Factors on the Structure of Gluten, Gliadins and Glutenins as Studied with Spectroscopic Methods. Molecules 2021, 26(2), 508. DOI: 10.3390/molecules26020508.
- Wang, P.; Tao, H.; Jin, Z., and Xu, X. Impact of Water Extractable Arabinoxylan from Rye Bran on the Frozen Steamed Bread Dough Quality. Food Chemistry 2016, 200, 117–124. DOI: 10.1016/j.foodchem.2016.01.027.
- Ohm, J.-B.; Ross, A. S.; Peterson, C. J., and Ong, Y.-L. Relationships of High Molecular Weight Glutenin Subunit Composition and Molecular Weight Distribution of Wheat Flour Protein with Water Absorption and Color Characteristics of Noodle Dough. Cereal Chemistry Journal 2008, 85(2), 123–131. DOI: 10.1094/Cchem-85-2-0123.
- Ma, J.; Kaori, F.; Ma, L.; Gao, M.; Dong, C.; Wang, J.; Luan, G. The Effects of Extruded Black Rice Flour on Rheological and Structural Properties of Wheat‐based Dough and Bread Quality. Int. J. Food Sci. Technol. 2018, 54(5), 1729–1740. DOI: 10.1111/ijfs.14062.
- Yaqoob, S.; Liu, H.; Zhao, C.; Liu, M.; Cai, D., and Liu, J. Influence of Multiple Freezing/thawing Cycles on a Structural, Rheological, and Textural Profile of Fermented and Unfermented Corn Dough. Food Science & Nutrition 2019, 7(11), 3471–3479. DOI: 10.1002/fsn3.1193.
- Zhang, Y.; Zhang, H.; Wang, L.; Qian, H., and Qi, X. Extraction of Oat (Avena Sativa L.) Antifreeze Proteins and Evaluation of Their Effects on Frozen Dough and Steamed Bread. Food Bioprocess. Technol. 2015, 8(10), 2066–2075. DOI: 10.1007/s11947-015-1560-6.
- Liu, Q.; Guo, X.-N.; Zhu, K.-X. Effects of Frozen Storage on the Quality Characteristics of Frozen Cooked Noodles. Food Chemistry. 2019, 283, 522–529. DOI: 10.1016/j.foodchem.2019.01.068.
- Meng, K.; Gao, H.; Zeng, J.; Li, G., and Su, T. Effect of Subfreezing Storage on the Quality and shelf Life of Frozen Fermented Dough. J. Food Process. Preserv. 2021, 45(3). DOI:10.1111/jfpp.15249.
- Correa, M. J.; Añón, M. C.; Pérez, G. T., and Ferrero, C. Effect of Modified Celluloses on Dough Rheology and Microstructure. Food Res. Int. 2010, 43(3), 780–787. DOI: 10.1016/j.foodres.2009.11.016.
- Olivera, D. F.; Salvadori, V. O. Effect of Freezing Rate in Textural and Rheological Characteristics of Frozen Cooked Organic Pasta. J. Food Eng. 2009, 90(2), 271–276. DOI: 10.1016/j.jfoodeng.2008.06.041.
- Katar, D.; Olgun, M.; Turan, M. Analysis of Morphological and Biochemical Characteristics of Buckwheat (Fagopyrum esculentumMoench) in Comparison with Cereals. CyTA - J. Food. 2015, 14(2), 176–185. DOI: 10.1080/19476337.2015.1076522.
- Mustafa, A.; Aman, P.; Andersson, R., and Kamaleldin, A. Analysis of Free Amino Acids in Cereal Products. Food Chem. 2007, 105(1), 317–324. DOI: 10.1016/j.foodchem.2006.11.044.
- Słupski, J.; Achrem-achremowicz, J.; Lisiewska, Z.; Korus, A. Effect of Processing on the Amino Acid Content of New Zealand Spinach (Tetragonia Tetragonioides Pall. Kuntze). Int. J. Food Sci. Technol. 2010, 45(8), 1682–1688. DOI: 10.1111/j.1365-2621.2010.02315.x.
- Shi, X.; Miao, Y.; Chen, J. Y.; Chen, J.; Li, W.; He, X., and Wang, J. The relationship of Freeze Tolerance with Intracellular Compounds in Baker’s Yeasts. Applied Biochemistry and Biotechnology 2014, 172(6), 3042–3053. DOI: 10.1007/s12010-014-0744-2.
- Shima, J.; Sakata-tsuda, Y.; Suzuki, Y.; Nakajima, R.; Watanabe, H.; Kawamoto, S., and Takano, H. Disruption of the CAR1 Gene Encoding Arginase Enhances Freeze Tolerance of the Commercial Baker’s Yeast Saccharomyces Cerevisiae. Applied and Environmental Microbiology 2003, 69(1), 715–718. DOI: 10.1128/AEM.69.1.715-718.2003.
- Koh, B.;Lee, G.; Lim, S.Effect of Amino Acids and Peptides on Mixing and Frozen Dough Properties of Wheat Flour. J. Food Sci. Technol. 2005, 70(6),s359-s364. Doi:10.1111/j.1365-2621.2005.tb11456.x.
- Römer, J.; Majchrzak, D.; Elmadfa, I. Interaction between Amino Acid Degradation, Sensory Attributes and Lipid Peroxidation in Wheat Rolls. Eur. J. Lipid Sci. Technol. 2008, 110(6), 554–562. DOI: 10.1002/ejlt.200700247.
- Abdelaleem, M. A.; Al-azab, K. F. Evaluation of Flour Protein for Different Bread Wheat Genotypes. Brazilian Journal of Biology. 2021, 81(3), 719–727. DOI: 10.1590/1519-6984.230403.
- Zhao, L.; Li, L.; Liu, G.-Q.; Liu, X.-X., and Li, B. Effect of Frozen Storage on Molecular Weight, Size Distribution and Conformation of Gluten by SAXS and SEC-MALLS. Molecules 2012, 17(6), 7169–7182. DOI: 10.3390/molecules17067169.
- Matsuura-endo, C.; Ohara-takada, A.; Chuda, Y.; Ono, H.; Yada, H.; Yoshida, M.; Kobayashi, A.; Tsuda, S.; Takigawa, S.; Noda, T., et al. Effects of Storage Temperature on the Contents of Sugars and Free Amino Acids in Tubers from Different Potato Cultivars and Acrylamide in Chips. Bioscience, Biotechnology, and Biochemistry 2006, 70(5), 1173–1180. DOI: 10.1271/bbb.70.1173.
- Garcı́a-arias, M. T.; Álvarez Pontes, E.; Garcı́a-linares, M. C.; Garcı́a-Fernández, M. C., and Sánchez-Muniz, F. J. Grilling of Sardine Fillets. Effects of Frozen and Thawed Modality on Their Protein Quality. LWT - Food Sci. Technol. 2003, 36(8), 763–769. DOI: 10.1016/S0023-6438(03)00097-5.
- Jiang, X. L.; Hao, Z.; Tian, J. C. Variations in Amino Acid and Protein Contents of Wheat during Milling and Northern-Style Steamed Breadmaking. Cereal Chemistry Journal. 2008, 85(4), 504–508. DOI: 10.1094/Cchem-85-4-0502.
- Zotta, T.; Piraino, P.; Ricciardi, A.; McSweeney, P. L. H., and Parente, E. Proteolysis in Model Sourdough Fermentations. Journal of Agricultural and Food Chemistry 2006, 54(7), 2567–2574. DOI: 10.1021/jf052504s.