
 ?Mathematical formulae have been encoded as MathML and are displayed in this HTML version using MathJax in order to improve their display. Uncheck the box to turn MathJax off. This feature requires Javascript. Click on a formula to zoom.
ABSTRACT
This article investigated household-level food security for Ghana, Liberia, and Senegal. Different agroclimatic, ecological, social, and farming conditions in West Africa were represented. Using data-driven Random Forest and Chi-Square Automatic Interaction Detection (CHAID) decision tree methodology, this study classified 644 Ghanaian, 323 Liberian, and 510 Senegalese households for comparison and interpretation on food security. The predictors growing Liberian and Senegalese decision trees imply community support, diverse selling channels outside villages, resolving the dispute over farmland, and increasing community-level investment for food availability and access demonstrate household food security. Predictor importance on food security for Ghana highlighted the role of independent producers and food suppliers toward stability. Household food security or insecurity was distinguished by location-specific and gender-led households in Liberia and Senegal. Practically, the results presented a need to step-up agricultural education and extension based on an empirical field survey and its interpretations. The results can add considerations to the role of farming households as independent and individual suppliers and consumers to long-standing dimensions of food security, i.e., food availability, access, and stability.
INTRODUCTION
Feeding 7.8 billion people in today’s world will be more challenging as the population clock ticks toward 9.9 billion by 2050.[Citation1] Currently, communities, families, and individuals face different food insecurity challenges, complicating the increase in population. For example, one-third of under-5 children suffered malnutrition in 2018. Malnutrition encompasses undernutrition, overweight, and hidden hunger by essential nutrient deficiencies. Malnutrition often precedes mother-to-child and subsequent generations in poverty, isolation, and marginalization.[Citation2]
Food security needs more interdisciplinary studies and actions. Food security is that people enjoy sufficient, preferable, nutritious, and safe food to maintain healthy and productive lives.[Citation3] But it is always questionable who, when, and where societies meet the standards in many social structures.[Citation4] An empirical case different from the definition is farming households in sub-Saharan Africa. Two recent publications complement that 33 million smallholder farms that supplied 70% of food in Africa suffer the most from persistent poverty and food insecurity.[Citation5,Citation6] To untangle the irony, the role of plant pathology, science, and technology to merge agricultural production needs with agribusiness strategies, agricultural education, and extension.[Citation7]
The remaining sections are structured as follows: Section 2 contains the background, reasoning, objectives of the study, as well as an explanation on food-security classification. In Section 3, the methodology discusses descriptive statistics and the research methods. The presentation of the results and their interpretation follows in Section 4. Section 5 discusses this research and policy implications.
MATERIAL AND RESEARCH CONTEXT
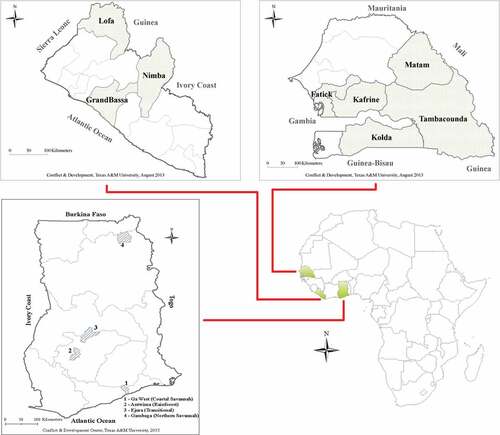
The objective was to comprehend the interplay of factors affecting food security in selected rural communities of West Africa. In Food Security and Production Assessment of Ghana, Senegal, and Liberia from September 2012 to April 2013, the Center on Conflict and Development at Texas A&M University partnered with local government agents in Ghana, Senegal, and Liberia. There was a purposeful selection of four Ghanaian districts, five Senegalese regions, and three Liberian counties based on different agroclimatic, ecological conditions, socio-economic status, and farming practices (). Then farming households who volunteered within those regions were randomly sampled.
Figure 1. Study locations of Ghana (Bottom), Liberia (Top left), and Senegal (Top right).
Survey timing determined information quality. Because survey time was near the end of the rainy season to the beginning of the dry season, researchers could better understand how farming households coped with past food insecurity. Responses to food-security questions in the questionnaire helped to construct and categorize 644 Ghanaian, 323 Liberian, and 510 Senegalese households () based on this study’s food security criteria as household food stability, availability, and access (). For Ghana, more than 64% of households had no food shortage in the last 12 months, and among them, only 57% satisfied food availability and access. Those became food-secure households, and the other 43% were food-insecure.
Table 1. Food security categories
Table 2. Food security construction criteria
The categorization of the other two countries differed because almost none of the households satisfied the same food-security standard as Ghana. As a result, Liberian and Senegalese cases had three ordinal levels of food insecurity (severely insecure, moderately insecure, and mildly secure). Severe food insecurity refers to households that experienced a food shortage for three months or more with scarce availability and access. Families in moderate food insecurity experienced a food shortage for three months with difficulty procuring quality nutritious food; mild food security had food shortages of two months or fewer.
Overall, Ghanaian food-secure families achieved food stability, availability, and access, but others categorized in food-insecurity and mild food security were insufficient satisfaction of one to all three dimensions. It is noted that three Liberian and three Ghanaian families were omitted due to incomplete food security or predictor information. Cases of each category were recorded as observations and compared with predicted instances for misclassification. Three research questions to further the study and lead to germane conclusion and discussion: (i) What underlying factors influenced food security for farming households, and how can commonalities or differences be used to aid the smallholding community in preventing food insecurity? (ii) What is the most significant effect of farming capacities on the lives of farming households? (iii) What recommendations should agricultural educators and extensionists take to support smallholders and subsistence-level households?
METHODS
Descriptive statistics
We hypothesized a direct relationship between farm costs and returns, as well as off-farm income, and food security. Currency conversion was done to compare the countries directly. Household data were collected. Due to the length of the survey, the currency was standardized at the exchange rate of 0.5248, 0.01361, and 0.00198 USD at the midpoint of the survey (i.e., December 14, 2012) for the Ghanaian Cedi, Liberian Dollars, and Senegal’s West African CFA Franc respectively.[Citation8] One USD equals 1.9 Cedis, 73.5 Liberian Dollars, and 505.1 Francs ().
Table 3. Financial information
Household income was a combination of crop, off-farm, and animal income. Coincidentally, the median in Ghana (1548 USD) and the arithmetic means in Senegal (1343 USD) and Liberia (555 USD) were comparable to their 2012 gross domestic product (GDP) per capita when converted to 2010 U.S. dollars, i.e., 1588 USD, 1318 USD, 565 USD.[Citation9] As median values differed from their means, the income distributions’ shapes skewed to the right. Among all income categories, crop income in Senegal had closest mean and median.
Crop income was calculated based on profit. Given the situation where farmers sold a modest amount of harvest after household consumption for a limited time, this task was strenuous but attainable. Rice, a staple crop in Liberia, was such a case. A concise rice cultivation cycle for upland rice is harvested from September to mid-December, and swamp rice from mid-December to January.[Citation10] From November to early December, the field research time frame was suitable to record costs incurred by hand tools, fences, and traps to protect crops from animal pests, meals for farm labor, transportation, and rental space at the market. The cost range per activity/item was almost the same in each village. Kuu, Liberia’s intimate, small-sized, and time-honored co-operative groups, facilitate planting and harvesting that demand more manual labor than other tasks in every cropping season.[Citation11] No such group was in Senegal and Ghana.
Crop income constituted the preponderance of household income. Two additional categories complemented household income: animal income and off-farm income. Animal income was present in Ghana and Senegal, while it was limited in Liberia. Livestock is a vital financial and productive asset. Further clarification is that rural Senegalese families possessed approximately 10% animal, 50% crop income, and 40% off-farm income.[Citation12] Marginalized households raised more livestock as protection against crop failure.[Citation13] Among mean comparisons, Senegal was a higher animal income in a limited number of households. Also, livestock served as collateral for food purchase, migration, labor, capital (buildings), and farm and nonfarm activities.
Off-farm income was available for all three countries. Liberia’s off-farm income included sales of bushmeat, charcoal, coffee, palm oil, palm wine, and sugarcane juice. Liberia’s income from coffee and rubber trees was also included in crop income for fruits, vegetables, starchy roots, and tubers. The zero medians of Liberia and Senegal indicated limited off-farm opportunities. Fishers, wood collectors, blacksmiths, and farm workers were among Liberian and Senegalese households. Comparably, Senegal had more nonfarm sector earnings from governmental and non-governmental organization affiliations. Ghana had additional off-farm income from traders’ profit; near high population densities farmers transported their own and neighbors’ farm produce to the nearest market. Fifty percent of Ghanaians recorded higher off-farm income than those from the other countries.
Climate variability has escalated farming household vulnerability in recent years. For instance, northern Ghana experience delayed rainy seasons and drier farmland after frequent wind.[Citation14] Soil degradation is inevitable, and farmers utilize manure to stabilize soil nutrients for crop production.[Citation15] Credit was exclusive. Informal community banks, traders, and market women were typical independent, informal microcredit sources. Their essential role to rural households lacking collateral is complicated by interest charges, repayment due, and responsible household members.[Citation16–18] In Senegal, although we found no such lenders, of the households who obtained credit from neighbors, families, or relatives, less than 50% of them experienced no interest.
Additional financial information was available and gathered for Ghana. Several Ghanaian farmers used their resources and government vouchers/coupons for fertilizer, herbicide, or insecticide. Money spent on food per month was the only predictor that had normal distribution, with the smallest gap between the mean and median (115 and 119 USD), and a minimum of zero and maximum of 367 USD.
Despite scant food expenditure information for Senegal and Liberia, community support played an important role in village-wide food aid, farmer training, and occasional village-council loans. Neighbors bartered, shared, or bought their produce together. Community-food expenditure increased Senegalese household food security, especially among more vulnerable communities.[Citation19] Community support was more prevalent in Senegal than in Liberia. The ‘wealth’ or ‘output’ redistribution in community leadership assists households whose family farms were affected by locusts, birds, and other animal pests and mitigate community-level food security.[Citation20,Citation21] More families received exogenous support from farmers’ organizations, local governments, or non-governmental organizations (NGOs) which supported training workshops, selling farm produce, and food assistance in Ghana.
The selling channel indicates whether households sold harvest inside or outside the village. About the same proportion of Ghanaians and Liberians could expand their selling channel, but the gap between Ghana and Liberia widened regarding agricultural information access. More than 70% of Ghanaians obtained weather, farm-product, or market information compared to 37% Liberians ().
Table 4. Binary predictor information
For Liberian households without proper irrigation, more rain in the swamp made it possible to grow rain-fed lowland rice, giving a higher yield.[Citation22,Citation23] In contrast, 41% responded that drought or flood frustrated cultivation in Ghana. Considering the simultaneous nature of higher land productivity, two different harvest seasons between upland and lowland rice, and fragmented land tenure, it is not coincidental that the same number experienced land conflict. We found in Ghana, fewer experienced land conflicts against a priority of unity of fragmented land tenure in post-conflict Liberia.[Citation24]
An equal number of male and female farmers were targeted in Ghana and Liberia, but there were more female farmers than male farmers targeted in Senegal, i.e., 70% female growers.[Citation25] We heard from a similar proportion of female farmers in Senegal; the gender gap was similarly disproportionate in other countries. However, strictly female-led households were merely 22% (114/510 families) in Senegal, 26% (169/644) in Ghana, and 35% (112/323) in Liberia.
Constraints such as outside labor, family labor, animal consumption, farming hindrances, and dependents were counted. On average, Liberia and Senegal had additional impediments compared to Ghana. Outside and family labor is complementary to labor-intensive agriculture. Ghana and Liberia relied on outside workers as opposed to Senegal’s family labor reliance. Many Senegalese families raised livestock; three to four cattle, sheep, or goats were usually slaughtered to sustain livelihoods in the last cropping season. Small children and elderly family members needed to be fed but were unable to contribute to the household. Households in Liberia and Senegal had more dependents than those in Ghana. Technology was counted for Ghana but categorized ordinally for Senegal due to the innate lack of technological variety. Ghanaian farmers applied three of six possible technologies, while most Senegalese (i.e., 86%) farmed at primary and intermediate levels (). All predictor information was based on 644 Ghanaians, 323 Liberians, and 510. Senegalese, almost equally divided amongst the four districts of Ghana, three counties of Liberia, and five regions of Senegal respectively.
Table 5. Count/categorical predictor information
Data analysis
Machine learning-based analysis is relatively new but has a vast potential for food security researchers. For example, a study applied six machine learning models for 756 Pakistani households for their food security classifications. The random forest algorithm showed the most accurate predictability among six model comparisons with hidden and heterogenous predictors/factors. The approach was to derive better decisions from human-machine learning interactions.[Citation26]
Similarly, in this study, STATISTICA Data Miner (Version 13.5) ran two decision tree algorithms instead of a single model: Exhaustive Chi-squared Automatic Interaction Detectors (CHAID) and a random forest. The emphasis was to explore complex data with many possible predictors to food security. Categorizing predictor choice by relevance and importance to the target and tolerance of skewed data were reasons to use these methods.[Citation27]
The inter-country differences and ordinal target categories (i.e., severe/moderate/mild) for Liberia and Senegal and the binary target (i.e., insecure/secure) for Ghana formed individual trees. But later, the data were combined for a holistic conclusion and implication. Exhaustive CHAID and random forest have different classification algorithms. In CHAID, dividing continuous predictors into multiple categories from as equal observations as possible was the first step. Then exhaustively, a cycle of merging-predicting continues until a chi-squared test identifies the least statistical significance of a group of predictors (the final pair of categories for each predictor) X to the target variable Y. Suppose I and J denotes respective X and Y categories, then the unadjusted test statistic and p-value are:
There are two expected cell counts and
. The former informs the null hypothesis of independence, and the latter represents row-effects. The algorithm then splits predictors to choose the one most statistically significant. The Bonferroni multiplier B makes the unadjusted p-value adjusted.
Until the adjusted p-value remains smaller than the alpha-to-split value, splitting continues. Once larger, splitting stops, and the relating node becomes final.[Citation28] V-fold cross-validation helps evaluate the accuracy of predicted classification. This breaks all training data samples in ten groups equally, then randomly and repeatedly calculates the average misclassification rate and standard error in a total of nine of the 10 folds as every round excludes the final fold.
CHAID algorithm entails conceivable overfitting risk by single tree construction, which shows accurate classification on the training data but high misclassification on test data or new information. Random Forests could minimize overfitting.[Citation29] Random Forest algorithm draws a separate random subsample from training data with replacement (i.e., bootstrapping) for an out-of-bag (OOB) error rate, confusion matrix, and variable importance then builds the many single decision trees randomly (i.e., ntree) from test data, combines all the predictor information (i.e., ensemble), and selects the most voted classification.[Citation30] Employing tree ensembles improves predicted classification accuracy, as every tree is an independent predictor. Misclassification rate was determined by the OOB error computed on the training data and test error as 150 trees built in a forest. Of the entire data, 50% was designated for training and 30% for random testing.
The algorithm randomly chooses m predictor variables among M variables for every node and seeks the maximum possible split on those chosen variables. Predicted accuracy depends on class-based error rate. Given ntree and m variables, a margin function calculates the average vote for the correct class that surpasses the other. This measure makes predictions more accurate.
Gains curves present the accumulated votes. The vertical y-axis shows the percentage of ‘Yes’ true-positive (TP) counts, divided by true-positive but false-negative counts. This displays the accumulated probability of right ‘Yes’ classification from observations and predictions (TP) out of TP plus ‘Yes’ misclassification originated from predictions (false-negative or type 2 error, FN). On the horizontal x-axis, the proportion is the number of TP, and ‘Yes’ misclassification emerge from observations (false-positive or type 1 error, FP), divided by all observation counts. Later, together with a confusion matrix for the overall classifier performance, clearer and more straightforward interpretations are possible.
Often, gains curves substitute receiver operating characteristic (ROC) curves. Both look visually alike as the y-axis shares the same information. Horizontally on the x-axis, however, gains charts add TP counts on the numerator to FP counts. Still, on the x-axis, ROC curves take only TN and FP on the denominator compared to gains charts that take all observation counts. The fundamental difference between the two curves is that a gains curve displays based on Yes/food-secure cases. displays different and similar elements to form gains and ROC curves.
Table 6. Gains and ROC chart construction
Predictor variable importance gives relative importance of variables to the target. The algorithm first adds all tree nodes then records ranks and importance statistics according to decrease in node impurity (i.e., delta) to the most crucial variable or earned the largest sum. Here the algorithm counts and scales every tree as equal, and the variable which reaches a value of 1 is most significant to the target. Values lower than one follow. The delta relative to split (s) of a parent node t is:
The parent Gini impurity is subject to subtraction of a proportion to the right child node and the impurity on the right hand and another proportion on the left child node multiplied by the impurity on the left.[Citation31]
RESULTS
As a result, there were two decision trees, two classification matrixes for Liberia and Senegal, and a random forest graph and summary, a gains chart, and a classification matrix for Ghana. Overall, the random forest showed the highest precision. Liberia’s tree comprises 23 child nodes. ‘Box’ was the name of each node shown in each STATISTICA result (). Six child nodes are on the right; 17 nodes shape a long-left tail. The more severely food-insecure households in the red bar on the left corresponded to additional predictors. Every division took different modes, i.e., the most frequent causes of a node.
Figure 2. Decision tree graph for Liberia.
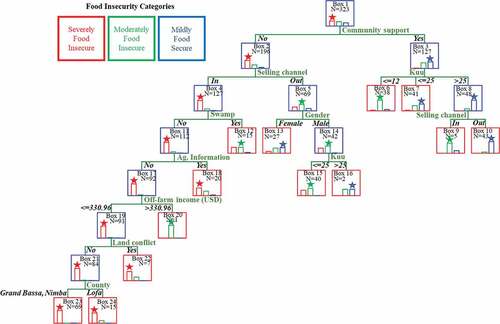
Community support was the leading factor to split the root node; the closer the predictor is to the parent node, the more important it is for classification. A total of 196 households which reported no community support comprise Box 2. Within that, 125 were classified as severely food insecure, 55 were moderately food insecure, and 16 were mildly food secure.
Continuing on the left, those 196 families with no community support responded to selling channels. Box 2 divides into Box 4 and Box 5. Following Box 5, its 69 households constitute more moderately food-insecure households which sold harvest outside their villages. Among them, 27 were female-led (Box 13), and 42 were male-led (Box 14). Box 13 includes more mild food-secure female-led households, 12 cases, than moderate 11 cases and severe, 4 cases. In Box 14, most male-led households were moderate with 24 cases, severe with 17 cases and mild with 1 case. For male-led households, the number of Kuu, the system of Liberian outside labor, further splits. Households with more than 25 laborers in Box 16 have only two instances (one moderate; one mild). Less than or equal to 25 laborers, Box 15, has 40 male-led families ending that node.
Back to Box 4: out of the 196 no community-supported instances, 127 families answered no harvest was sold outside their villages. It was split further by five additional predictors. No apparent mode change was observed on the left tail because of 104 severe cases, 20 moderate cases, and three mild cases. The predictor Swamp which shows which households grow rain-fed lowland rice contains 15 households: seven severe, seven moderate, and one mild. The other 112 households respond to another predictor: Agricultural Information.
A total of 20 households accessed agricultural information (Box 18): 12 severe, seven moderate, and one mild. The other 92 families without information access in Box 17 reported the amount of off-farm income. Only one household, which was moderately food insecure, earned over 330 USD in Box 20. Those 91 households which earned less than or equal to 330 USD comprise Box 19. In the selected regions of Liberia, land conflict appeared on rare occasions as only seven of 91 experienced land conflict. Of the other 84 families, 69 were in Grand Bassa and Nimba in Box 23; 15 were in Lofa County in Box 24.
The community-supported 127 families were about 40% of the total households surveyed in Liberia. On the right side, the number of Kuu, outside farm laborers, who worked for the last crop season was a predictor. The predictor leafed three child nodes: Boxes 6, 7, and 8. Box 6 includes those who had less than or equal to 12 outside farm laborers with a majority of 32 moderate instances. The more Kuu members there were, the more households were mild. Less than or equal to 25 laborers in Box 7 had 22 mild cases of the total 41. In Box 8, 40 of 48 families, 83%, were mild.
Box 8 bifurcates two end nodes with Boxes 9 and 10 predictor Selling Channel. On the right in Box 9, 39 households were mild with four moderate as they could diversify selling channels inside and outside their villages. On the left in Box 10, only four moderate and one mild household sold harvest inside their villages.
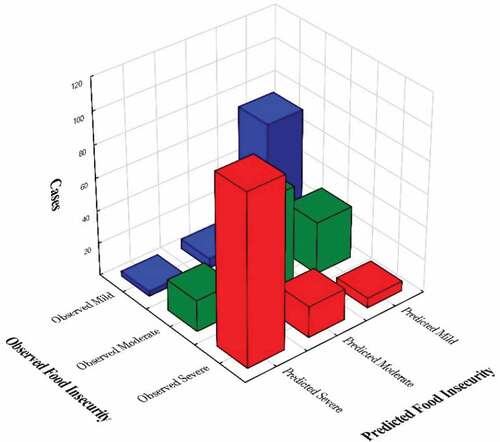
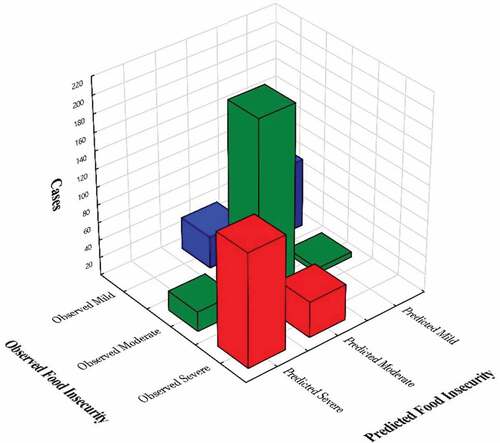
, the three-dimensional graph with original classification on the x-axis, prediction on the y-axis, and cases on the z-axis, shows how predicted classification was accurate to observations. Diagonally, each bar in red, green, and blue displays the matched cases (104 severely insecure; 61 moderates; 73 mild) with 73.7% predicted accuracy. The misclassification rate was 26.3%. The 85 mismatches comprise 19 observed severe and predicted moderate, six observed severe and predicted mild, 19 observed moderate and predicted severe, 32 observed moderate and predicted mild, three observed mild and predicted severe, and six observed mild and predicted moderate. We observed a risk estimate of v-fold cross-validation of 31.6% and a 26% misclassification rate of the original/training data despite almost the same 0.02 standard error.
Figure 3. Classification matrix for Liberia.
presents the decision tree for Senegal, which tails longer in the middle. This Senegal tree comprises 25 nodes, and community support was the first, and most important, predictor from parent node. The predictor cleaves the 510 food-insecure households (167 severe, 230 moderate, 113 mild cases) into not community supported, 249, on the left in Box 2 and community supported, 261, on the right in Box 3. Box 2 takes 148 severe cases, 89 moderate, and 12 mild households. Box 3 contains 19 severe cases, 141 moderate cases, and 101 mild cases.
Figure 4. Decision tree graph for Senegal.
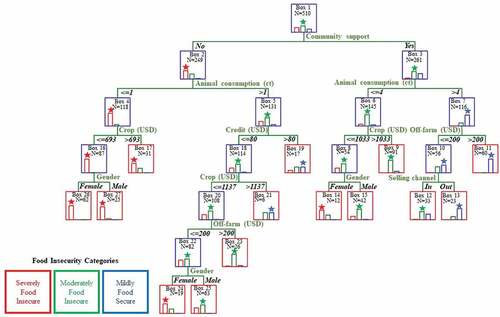
The grass-fed/grain-fed livestock predictor makes the next two nodes. Less than or equal to one animal slaughtered for household nutrition in Box 4 comprises 118 cases of which 106 were severe; 12 were moderate, and zero were mild. More than one animal slaughtered for household nutrition constituted a major change with 77 moderately food-insecure households, 42 severe, and 12 mild in Box 5. For the 261 community-supported on the right side, Box 6 divides into less than or equal to four animals slaughtered and Box 7 into more than four animals slaughtered. In Box 6, there were 116 moderate, 18 severe, and 11 mild households. In Box 7, of the 116 families one was severe, 25 were moderate, and 90 were mild.
The third row establishes three financial predictors: crop income, credit, and off-farm income. On the far-left, for Box 4 the split condition was 693 USD. As the median and mean for crop income in Senegal was about 940 USD () split condition was diminutive. Less than or equal to 693 USD in Box 16 encompasses 87 households of which 62 were female-led households, and 25 were male-led households (Box 26). Except two male-led moderately food-insecure households, all others were severely food insecure. In Box 17 there were more households, but 21 were severe while ten were moderate.
For the 131 cases in Box 5, credit amount precedes crop and off-farm income to form Boxes 18 and 19. For households with over 80 USD in credit, there were seven cases of both moderately food-insecure and mildly food-secure households and three severely food-insecure households. Due to the large gap between the zero median and the 139 USD average for credit in Senegal, 80 USD was reasonable to divide a group of credited and non-credited households (). Less than or equal to 80 USD includes 70 moderate cases, 39 severe, and five mild. Those total 114 cases in Box 18 respond to crop income, off-farm income, and gender.
None of the predictors’ modes were mild; most were moderately food insecure. Without sufficient credit, having crop income over 1137 USD was unlikely as in Box 21 only 3 cases were in moderate and mild each. The 108 households that make less than 1137 USD respond to the off-farm income predictor. Most of the households in Box 23 that make more than 200 USD were moderately food insecure. Eighty-two of the households, Box 22, that make less than or equal to 200 USD were separated further by gender. In Box 25, the majority of male-led households were moderately food insecure. The mode changes to severely food insecure in Box 24 which contains female-led households.
Boxes 6 and 7, whose split condition was four animals, the predictors crop income and off-farm income respectively split the nodes. As they received community support, the higher income, 1033 USD, was higher than for those in Box 4. For the 54 households making less than or equal to 1033 USD, they were split further by gender. The female-led households, 12, tended to be severely food insecure, while the male-led households were typically moderately food insecure.
When off-farm income was more than 200 USD, nearly all households were mildly food secure. For those with off-farm income less than or equal to 200 USD, most were mildly food secure, but it further splits by selling channel. Despite less off-farm income, households with selling channels outside villages were more likely to be mildly food secure rather than those without outside selling channels, of which the majority of the households were moderately food insecure. presents another three-dimensional classification for Senegal, classified more precisely than Liberia’s, with a 20% misclassification rate for train data and a 25% v-fold cross-validation risk. The correct matches between observation and predictions were 127 severe, 202 moderate, and 77 mild cases. Mismatches occurred in 40 observed severe-predicted moderate; 22 observed moderate-predicted severe; 6 observed moderate-predicted mild; 36 observed mild-predicted moderate instances.
Figure 5. Decision tree classification matrix for Senegal.
Ghana’s random forest result is shown in and . is ensemble trees from the test data to represent the overall data structure. The graph begins with 222 cases, of which 89 were food-insecure, and 133 were food-secure instances. This 40–60 split was comparable to the original data’s 43–57 division.
Figure 6. Random forest graph for Ghana.
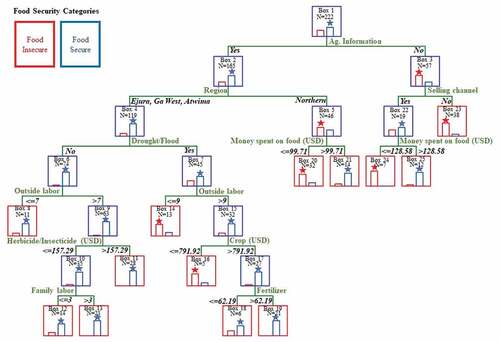
Figure 7. Summary of random forest for Ghana.
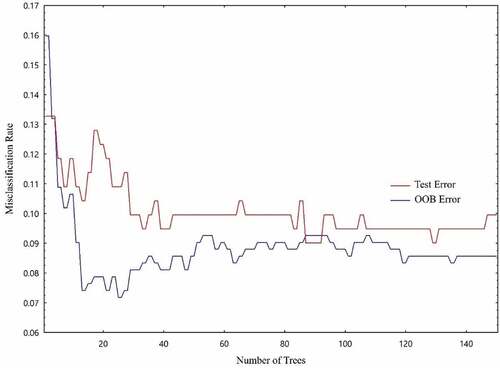
Figure 8. Classification matrix for Ghana.
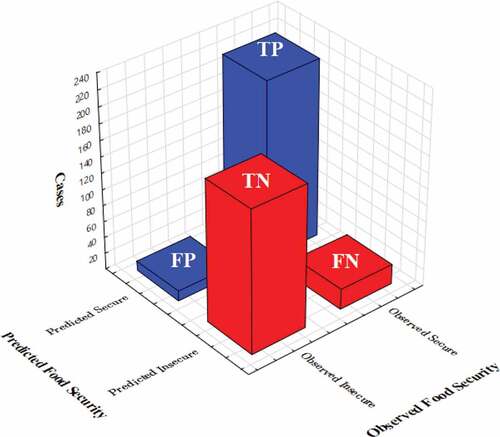
Figure 9. Gains chart for Ghana.
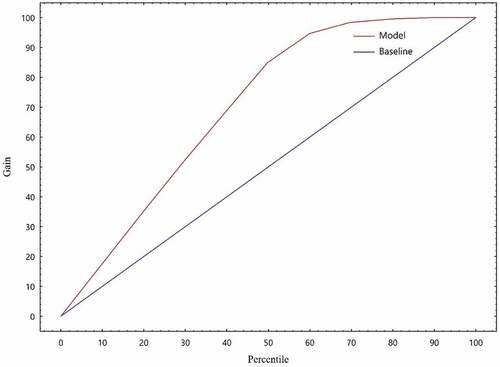
Table 7. Variable importance to food security in Ghana
The original node splits based on access to agricultural information. The group that did not access splits into five end nodes whose households were mostly food insecure. Of the total 38 cases in Box 3, 33 cases were food insecure. These cases had both no agricultural information and limited selling channels. The seven food-insecure cases in Box 24 diversified selling channels but no agricultural information access and less money spent on food items for family nutrition.
Despite access to agricultural information (Box 2), residence in the Northern region and limited financial resources on food items produced 25 food-insecure cases of the total 32 in Box 20. For the other districts (i.e., Ejura, Ga West, Atwima), the existential threat of drought or flood precipitated food insecurity. Of 45 households affected by drought or flood (Box 7), ten food-insecure cases had insufficient labor power (i.e., equal or fewer than nine laborers) to restore food production. Even though 32 cases had over nine laborers, low income predicted food insecurity in Box 16 with the majority of those making less than or equal to 791.92 USD labeled food insecure.
Opposite cases were observable. Box 11 consists of 28 food-secure cases that accessed agricultural information that experienced no drought or flood, worked with more than seven laborers, and spent over 157.29 USD on herbicide/insecticide. For cases that spent equal to or less than 157.29 USD (Box 10), 21 instances were classified as food secure because they had more than three family laborers (Box 13).
The summary of random forest () displays information on overall misclassification rate, significant discrepancies between test and OOB data, or possible overfitting issues. The largest misclassification gap was between the 14th and 18th tree data. Especially for the 18th, the misclassification error of test data increased to 13%, while OOB data remained at 8%. But then test data began to stabilize its misclassification. Once, between the 87th and 92nd trees, both misclassification rates cross at 9%. Overall, both garnered approximately 9% misclassification risk and 0.01 standard error.
, the classification matrix, shows 80 and 110 correctly classified cases for food insecure (True Negative) and food secure (True Positive) respectively. However, there were nine false positive and 12 false negative cases. was a cumulative gains chart targeting food-secure cases. The 45-degree baseline represents random observations with undetermined selection criteria – the y-axis showing the targeted proportion against the x-axis baseline. For the first 10% baseline, we observed 18% positive cases. The growth rate of the y-axis was quicker than the x-axis baseline. At 50% baseline, 84% of the total cases were food secure. After that, the target proportion rate turns sluggish; the other 16% target was on the other 50% baseline. coherently and proportionately captured more Ghanaian food-secure households, indicating a reasonable, accurate classification.
Variable importance from Ghana’s OOB data in was critical. The most important being the top eight ranks. Financial information on crop income, fertilizer, and herbicide/insecticide, directly related to food production, acquired the 1st, 2nd, and 4th positions, respectively. The money spent on food from markets for balanced household nutrition ranked the 3rd variable importance. Constraints, outside labor, and technology as count variables ranked 5th, 6th, and 7th, respectively. The high-ranked predictors were all related to commercial farming.
The least significant variables were also worth observing. Credit and gender heads were crucial predictors in Senegal’s decision tree, but they were the 16th and 18th of 19 variables for Ghana. While land conflict rests at 19th for Ghana or the least significant among all predictors, it was substantial for Liberia. Despite households having different forms and amounts of internal and external laborers, exogenous assistance was the least essential predictor. Also, Liberia’s trees identified the selling channel as a critical predictor, followed by Ghana and Senegal.
DISCUSSION AND IMPLICATIONS
This research has multiple implications. The first was our method selection and results. Our methods structured distinctive trees to show food insecurity/security levels under various social, farming, and environmental conditions. Due to country variability apparent after the in-field survey, different approaches were best suited to exploring food insecurity and security levels rather than a one-size-fits-all approach. Consequently, more predictors classify severely food-insecure households for Liberia and more moderately food-insecure households for Senegal. Split conditions and criteria were reasonable to means, medians, or frequencies, and likewise, reduced misclassification risks consistently from Liberia, Senegal, and Ghana.
Second, dynamic process was highlighted. With more households severely and moderately food insecure, two decision tree algorithms chose community support as a priority. Ghana’s random forest presented more predictors indicating farming households were independent producers. In post-conflict Liberia, survival on subsistence agriculture was a prominent concern. Farmers should sell and purchase goods to improve household food security, and more assistance with agricultural education and extension should assist them in balancing supply and demand.
Farming is uncertain and unexpected. No farmer can predict the exact amount of harvest, and happenstance is God’s Will, quoting Liberian respondents. Agricultural educators and extensionists should assist farmers in mitigating the ex-post impact ex-ante. Bringing more agricultural information, knowledge, and techniques to each village and introduce additional off-farm activities closely related to agriculture rather than staple crop production to farming households near the most food-insecure months. Over time, stakeholders should settle mechanisms to prevent land conflict while developing land with communities.
In Senegal, more active community roles are needed for women. We observed female-led families harvest less for consumption and income in the field, data, and decision tree. Tailored education and extension to find ways out of subordinate roles in agriculture could increase food security. Credit from family members toward farming and household nutrition was only available for select, and typically, male-led households. We need to seek possibilities for communities to support each other financially so that both male and-female-led households increase farm capacities and alleviate food insecurity.
Ghana showed a balance of food supply and demand in regard to food security. Despite lower predictor importance than others, the need for family labor is emphasized. Finally, future food production and food security research is needed. Decision tree classifiers or predictions are understudied in food security still, and we hope for more evidence from more cases in extended periods.
Acknowledgments
The authors thank the Howard G. Buffett Foundation and the United States Agency for International Development for supporting this research. Thanks to Alexis Zickafoose’s significant time for thorough edits and invaluable comments, this journal article reaches out to the reader with precise knowledge. We also thank the interviewees for their time and help. The most genuine intentions of this study were to assist growers in improving farming, their lives, and the lives of their families and communities.
Disclosure statement
No potential conflict of interest was reported by the authors.
Additional information
Funding
References
- International Institute for Sustainable Development (IISD). World Population to Reach 9.9 Billion by 2050; Winnipeg, Canada: IISD. https://sdg.iisd.org/news/world-population-to-reach-9-9-billion-by-2050 Accessed02 December 2021, 2020.
- United Nations Children’s Fund (UNICEF). The State of the World’s Children 2019. Children, Food and Nutrition: Growing Well in a Changing World; New York, NY: UNICEF. https://files.eric.ed.gov/fulltext/ED599360.pdf Accessed 25 March 2021, 2019.
- Food and Agriculture Organization of the United Nations (FAO). Food Security; Rome, Italy: FAO. http://fao.org/fileadmin/templates/faoitaly/documents/pdf/pdf_Food_Security_Cocept_Note.pdf Accessed 2 January 2020, 2007.
- Gibson, M. Food security—A Commentary: What Is It and Why Is It so Complicated? Foods. 2012, 1(1), 18–27. DOI: 10.3390/foods1010018.
- International Fund for Agricultural Development (IFAD). (2017). The Field Report. Rome, Italy: IFAD. https://ifad.org/thefieldreport Accessed 18 March 2020
- Doss, C.; Meinzen-Dick, R.; Quisumbing, A.; Theis, S. Women in Agriculture: Four Myths. Global Food Secur. 2018, 16, 69–74. DOI: 10.1016/j.gfs.2017.10.001.
- Borlaug, N. E.; (2008). Nobel Peace Laureate Norman Borlaug Endorses Food Security. Food Security. https://springer.com/journal/12571/updates/17238148 Accessed 25 May 2020
- International Civil Service Commission (ICSC). Retail Prices Indices Relating to Living Expenditures of United Nations Officials; New York, NY: ICSC. https://icsc.un.org/Home/GetDataFile/2638 Accessed 01 March 2018, 2012.
- World Bank, World Development Indicators (Ghana, Liberia, Senegal). GDP per Capita (Constant 2010 US$) -; Washington, D.C., 2018. https://data.worldbank.org/indicator/NY.GDP.PCAP.KD?end=2018&locations=GH-LR-SN&most_recent_value_desc=false&start=1960&view=chart Accessed 15 June 2020. Weighted average [Data file].
- Currens, G. Women, Men, and Rice: Agricultural Innovation in Northwestern Liberia. Hum Organ. 1976, 35(4), 355–365. DOI: 10.17730/humo.35.4.v170358063026823.
- Kolkmeyer, J. Utilizing Traditional Co-operatives in Liberia. J Liberian Studies 1970, 3(1), 63–66.
- Alobo, S.; Bignebat, C. Patterns and Determinants of Household Income Diversification in Rural Senegal and Kenya. J Poverty Alleviation Int Dev 2017, 8(1), 93–126.
- Reardon, T. Using Evidence of Household Income Diversification to Inform Study of the Rural Nonfarm Labor Market in Africa. World Dev. 1997, 25(5), 735–747. DOI:10.1016/S0305-750X(96)00137-4.
- Dickinson, K. L.; Monaghan, A. J.; Rivera, I. J.; Hu, L.; Kanyomse, E.; Alirigia, R.; Adoctor, J.; Kaspar, R. E.; Oduro, A. R.; Wiedinmyer, C. Changing Weather and Climate in Northern Ghana: Comparison of Local Perceptions with Meteorological and Land Cover Data. Reg. Environ. Change. 2017, 17(3), 915–928. DOI: 10.1007/s10113-016-1082-4.
- Karbo, N., and Agyare, W. Crop–livestock Systems in Northern Ghana. In Improving Crop–livestock Systems in the Dry Savannas of West and Central Africa, Hiernaux, P., Tarawali, G. Eds.; Ibadan, Nigeria: International Institute of Tropical Agriculture (IITA), 2002; pp. 112–126. http://hubrural.org/IMG/pdf/iita_ghana_syst_agri_elevage.pdf Accessed 26 April 2019
- Arku, C.; Arku, F. S. More Money, New Household Cultural Dynamics: Women in Micro-finance in Ghana. Dev Pract. 2009, 19(2), 200–213. DOI:10.1080/09614520802689469.
- Ganle, J. K.; Afriyie, K.; Segbefia, A. Y. Microcredit: Empowerment and Disempowerment of Rural Women in Ghana. World Dev. 2015, 66, 335–345. DOI: 10.1016/j.worlddev.2014.08.027.
- Schindler, K. Credit for What? Informal Credit as a Coping Strategy of Market Women in Northern Ghana. J. Develop. Stud. 2010, 46(2), 234–253. DOI: 10.1080/00220380903002905.
- Nébié, E. K. I.; Ba, D.; Giannini, A. Food Security and Climate Shocks in Senegal: Who and Where are the Most Vulnerable Households? Global Food Secur. 2021, 29, 100513. DOI: 10.1016/j.gfs.2021.100513.
- Shipton, P. African Famines and Food Security: Anthropological Perspectives. Annu Rev Anthropol. 1990, 19(1), 353–394. DOI:10.1146/annurev.an.19.100190.002033.
- Taal, H. How Farmers Cope with Risk and Stress in Rural Gambia. IDS Bull. 1989, 20(2), 16–22. DOI:10.1111/j.1759-5436.1989.mp20002003.x.
- Johnny, M.; Karimu, J.; Richards, P. Upland and Swamp Rice Farming Systems in Sierra Leone: The Social Context of Technological Change. Africa: Journal of the International African Institute. 1981, 51(2), 596–620. DOI:10.2307/1158829.
- Ministry of Agriculture of Liberia (MOAL). National Rice Development Strategy of Liberia Doubling Rice Production by 2018; MOAL: Monrovia, 2012. https://riceforafrica.net/downloads/NRDS/LNRDS.pdf Accessed 18 February 2020.
- Vinck, P.; Pham, P. N., and Kreutzer, T. Talking Peace: A Population-based on Attitudes about Security Dispute Resolution and Post-conflict Reconstruction in Liberia; Berkeley, CA: Human Rights Centre at University of California , 2011.
- UN Women. (2018). UN Women executive director visits Senegal to put women farmers at the heart of the gender equality agenda. https://www.un.org/africarenewal/news/un-women-executive-director-visits-senegal-put-women-farmers-heart-gender-equality-agenda Accessed 26 September 2020
- Razzaq, A.; Ahmed, U. I.; Hashim, S.; Hussain, A.; Qadri, S.; Ullah, S.; Asghar, A.; Imran, A.; Asghar, A. An Automatic Determining Food Security Status: Machine Learning Based Analysis of Household Survey Data. Int. J. Food Prop. 2021, 24(1), 726–736. DOI: 10.1080/10942912.2021.1919703.
- Song, Y. Ying, L. Decision Tree Methods: Applications for Classification and Prediction. Shanghai Arch Psychiatry. 2015, 27(2), 130–134. DOI:10.11919/j.1002-0829.215044.
- IBM. (n.d.). Exhaustive CHAID Algorithm (CHAID algorithms). https://ibm.com/support/knowledgecenter/SSLVMB_22.0.0/com.ibm.spss.statistics.algorithms/alg_tree-chaid_exhaustive.htm Accessed 5 May 2019
- Breiman, L. Random Forests. Mach. Learn. 2001, 45(1), 5–32. DOI: 10.1023/A:1010933404324.
- Breiman, L., and Cutler, A. Random Forests. Department of Statistics, University of California: Berkeley, 2003, https://stat.berkeley.edu/~breiman/forests/cc_home.htm Accessed 03 June 2019.
- TIBCO. (n.d.). Random forests overview. https://docs.tibco.com/data-science/GUID-0F859CE9-E241-443C-AEA5-511B0E9A2187.html Accessed 01 November 2019