
 ?Mathematical formulae have been encoded as MathML and are displayed in this HTML version using MathJax in order to improve their display. Uncheck the box to turn MathJax off. This feature requires Javascript. Click on a formula to zoom.
ABSTRACT
The determination of rice grain quality (RGQ) parameters is important because it is the benchmark of rice breeding success to meet up the consumers’ demand. RGQ includes milling, storage, cooking, eating, nutrition, and market quality of rice grain. Furthermore, demand for high-quality rice has increased globally and is expected to continue to rise due to consumer preferences. However, global consumer demand, culture, and demographic variances determine acceptable RGQ attributes. For example, European consumers prefer long-grain, nonaromatic rice, whereas Middle Eastern consumers prefer long-grain, well-milled rice with a strong aroma. To improve the rice quality, RGQ analysis is the best way; besides we need to understand the genetic mechanism of the several grain quality quantitative trait loci (QTLs) actions. A better understanding of these QTLs can be tremendously useful in the development of novel RGQ varieties. This review is intended to study major RGQ parameters and their assessment tools. This study is focusing on the limitations and prospects of QTLs to improve RGQ.
Introduction
Rice is one of the most important food crops, it is consumed as a staple food by more than half of the world’s population and fulfills over 21% of total caloric requirements.[1,Citation2] More than 90% of the world’s rice is cultivated and consumed in Asia. It has been documented that the world population is predicted to reach 7.6 billion to 9.8 billion by 2050 .[Citation3] The existing challenge toward the rice breeding programs is to feed the rising population with diminishing natural resources and environmental fluctuations on one hand and varieties that have grain quality, on the other. With the intensifications of diverse food demands, RGQ has become a major concern for rice breeders as consumer preference, acceptance and economic value of a rice variety depends on its grain quality.[Citation1]
RGQ is a complex trait and is often hard to define comprehensively.[Citation1] Usually, rice quality is judged based on its attributes, which have been grouped into two classes: i). intrinsic, such as texture, taste, or color, and ii) extrinsic, such as brand, packaging, or label to the product.[Citation1] Yet, RGQ comes from a polygenic group of traits that are affected by crop management, environmental factors as well as a combination of their subsequent interactions.
RGQ is mainly determined based on physical properties (such as head rice recovery, grain size and shape, and grain color), biochemical composition (such as amylose content, gelatinization temperature, viscosity, and aroma), and nutritional properties (such as micronutrient, digestibility, protein, and lipid content).[Citation1]
Besides, the cooking and eating quality are the most important quality parameters of rice as it meets the customer’s satisfaction and controls rice price in the market. The distinction of rice cooking quality is a small example of its total diversity inside diverse varieties.[Citation4] In the year 2012, Bao et al.[Citation5] documented that the cooking and eating quality of rice are primarily measured by some physicochemical properties of the starch for example Gelatinization temperature (GT), apparent amylose content (AAC), and gel consistency (GC). Thus, pasting properties, GC, and AAC are the most important standards’ that can directly affect consumer preference and the economic value of rice varieties.[Citation4]
However, the underlying mechanisms controlling the traits of cooking and eating quality are generally complex and measured by some genes as well as influenced by some environmental factors.[Citation1] Clear concepts about these attributes are very much essential for the future development of new premium rice varieties. Thus, Scientists around the world are interested in the diversity of cooking and eating quality rice. Besides, rice grain mostly consists of carbohydrates in the form of starch, with fair amounts of essential nutrients.[Citation6] However, as a staple food, the fortification of some additional nutrients might be critical for the maintenance of human health. Up to this date, several quantitative trait loci (QTL) regulate the RGQ parameters that were recognized by molecular markers.[Citation7]
Nevertheless, based on the composition of rice endosperm, rice is divided into glutinous and non-glutinous types.[Citation8] Glutinous rice is sticky when cooked due to its dextrin content in the endosperm in place of starch.[Citation8] By contrast, non-glutinous rice is not sticky when cooked because of its higher fat and less protein content.[Citation8] Almost all consumption of rice around the world is glutinous as people prefer it because of its softness after cooking.[Citation8]
One of the major challenges facing the rice breeding programs is to have simple, high throughput, and robust methods for assessing various RGQ parameters that are directly associated with consumer preference. RGQ can be determined by a combination of both physical, and biochemical methods. The objective of this review was to discuss the development made toward the key grain quality traits with the improvement of high-yielding varieties in the present scenario of environmental fluctuations and decreasing natural resources. The various methods used in rice breeding programs to evaluate RGQ traits. This review presents the highlight of various grain quality parameters. Besides, this review also presents data in tabulated and picture format so that readers can easily understand.
Rice grain quality (RGQ)
Typically, RGQ is difficult to define because it depends on some precise factors such as market demand, projected functional use, and regional consumer preference().[Citation9] For instance, Southeast Asians generally prefer soft gel consistency, long grains with intermediate AC while South Asians normally favor hard gel consistency, long grain with a high AC.[Citation10] Additionally, in some cases, premium-quality rice in one area can be considered low-quality rice varieties in another area. Besides, rice grains have huge variations in cooking, biochemical, physical, processing properties, and sensory qualities.[Citation11] Thus, making grain quality classification challenging. A commonly accepted consensus among cereal chemists and grain quality experts is that RGQ usually covers the Physico-chemical characteristics of rice kernels which influence their cooking, milling, eating, nutritional and sensory properties ().
Figure 1. Details classification of RGQ.
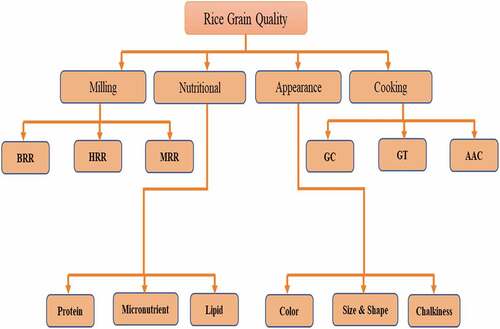
Classification of RGQ
Broadly, RGQ includes main four aspects and these are discussed in the following sections.
Milling quality
Usually, the milling quality refers to the head rice yield. Briefly, milling quality refers to the proportion of unbroken white rice recovered from milling, firstly in the form of brown rice and then in white rice.[Citation11] From a marketing standpoint, milling quality is one of the most significant standards of rice quality. Overall, milling quality includes: (i) Head Rice Rate (HRR), (ii) White Rice Rate (WRR), and Brown Rice Rate (BRR).
Cooking and sensory quality
Cooking quality refers to the inclusive estimation of the color, smell, shape, taste, palatability, and some sensory properties after cooking.[Citation6] Previous literature documented GC, AAC, gelatinization temperature, and cooking method are the main indicators affecting cooking and sensory quality.[Citation6]
Appearance quality
Appearance quality refers to the appearance of polished rice. Appearance quality includes size, shape, color, transparency, and chalkiness.[Citation6] Herein, chalkiness and grain shape are the main indicators affecting appearance quality. Briefly, grain shape traits include grain thickness, grain length, grain width, and length/width ratio. Besides, based on the chalkiness rice can be divided into the white belly, white back, and white core according to location.
Nutritional quality
The key nutrients present in rice grains are protein, especially the amino acid lysine. Some B vitamins and minerals are also found in rice grain and act as a vital nutrient in areas where trace elements are scarce. Additionally, rice bran is rich in crude fiber, anthocyanins, and polyunsaturated fatty acids. Thus, there are many health benefits in eating lower milling white rice or brown rice, which contains vitamins, minerals, fiber, and amino acids ().
Table 1. RGQ determination method
RGQ assessment procedure
Milling quality
Milling yield is the estimate of the quantity of total milled rice and head rice that can be produced from a unit of rough rice. It is generally expressed as a percentage.[Citation12] The milling process usually involves five key operations[Citation13]: (i) Firstly, clean the rough rice to remove unwanted matter (such as leaves, rice stems, and other foreign matter), (ii) Secondly, dehulling to remove the hulls, (iii) Thirdly, cleaning the BR to remove the hulls, (iv) Fourthly, polishing the BR, (v) Finally, separate broken kernels from the whole grains.
Milling yield calculations: The percentage of milling quality of rough rice can be calculated by the following formulas[Citation14]:
Usually, the rough rice contains 20% to 22% of hulls, while literature has recorded a variation of 18% to 26% .[Citation14] Bran embryos constitute an extra 8% to 10% hulls. Moreover, from 100 g of rough rice only 70 g of milled rice and 20 g of broken rice is obtained. Thus, the head rice recovery is only around 50%. However, it has been found in earlier studies that the head-rice recovery may vary from 25% to 65%.[Citation15]
Cooking and eating quality
Gelatinization Temperature (GT): GT can be defined as the range of temperature in which 90% of starch granules swell and lose their crystallinity and thus refraction quality .[Citation14] GT is also known as a physical-chemical property as it directly reflects the cooking quality of rice grain in terms of energy and time required for cooking. Briefly, rice cooking starts at GT when starch granules absorb water and lose their crystalline nature permanently. Simply, GT indicates the time of cooking a particular kind of rice. Depending upon the types of rice, GT ranges from 55 to 79°C. The GT is classified into three categories[Citation13]: (i) Low: 55–69°C, (ii) Intermediate: 70–74°C, and (iii) High: more than 74°C, respectively.
RGQ preferences differ from man to man around the world, although, most of the countries prefer intermediate GT rice varieties.[Citation13,Citation15] The GT influences the cooking quality of rice greatly for instance elongation of the kernel, water uptake, and expansion of its volume.[Citation16] The cooking properties of rice are more closely related to the GT even than the amylose content of the starch.[Citation13] As reported by Fitzgerald et al.[Citation17] cooking time for rice can be reduced by up to 4 min by lowering the GT of the grain. In case of overcooking, the high GT makes the rice too soft. If the standard cooking procedure is applied, the grain can be less elongated and undercooked. GT correlates positively with the time required to cook rice. High GT rice needs more energy than low GT rice upon cooking. Rice with a high GT becomes excessively soft and tends to disintegrate when overcooked. Under standard cooking procedures: (i) Rice with a high GT tends to remain undercooked. Rice varieties with a high GT require more water and time to cook than those with a low or intermediate GT. Rice with a high GT remains largely unaffected in the alkali solution. Varieties with a high GT generally have a low amylose content, (ii) Rice with a low GT disintegrates completely, (iii) Rice with an intermediate GT shows only partial disintegration. Intermediate GT has been combined with low amylose content.
GT determination procedure: The two most used methods for GT determination are: Differential Scanning Calorimetry (DSC) and alkali spreading value (ASV). DSC is an instrumental method based on measuring in real-time the first peak of the endotherm was the starch granules gelatinize.[Citation18] Although DSC is a precise and first technique, DSC is an expensive method and cannot be routinely used to screen thousands of samples in rice improvement programs. By contrast, the ASV method is based on the disintegration of starch granules principal present in milled rice kernels in dilute KOH.[Citation19,Citation20] The degree of disintegration is then numerically scored on a scale of 1–7 ().
Table 2. Numerical scale for scoring GT.[Citation14]
In a breeding program, an estimate of the gelatinization temperature is measured by the ASV method.[Citation13] GT is not associated with other important plant or grain traits except for certain useful correlations with amylose content.[Citation6] Briefly, a duplicate set of six whole-milled kernels without cracks is selected and placed in a plastic box (5 × 5 × 2.5 cm). Half kernels can be used in the absence of whole kernels. Ten mL of 1.7% (0.3035 M) potassium hydroxide (KOH) solution is added. The samples are arranged to provide enough space between kernels to allow for spreading. The boxes are covered and incubated for 23 h in a 30°C oven. Samples can be placed outside in the absence of an oven if the ambient temperature is almost the same as what is required. Starchy endosperm is rated visually based on a 7-point numerical spreading scale (). Standard check varieties of high, intermediate, and low gelatinization types of rice are included for every test. Cooking time and gelatinization temperature of milled rice are positively correlated,[Citation13] although GT does not correlate with the texture of cooked rice.[Citation13] Finally, ASV is a high throughput GT determination method, however, ASV is an indirect and subjective test. Therefore, in an advanced laboratory, GT is also determined by an amylograph method and was approved as the AACCI Method 61–01.01.[Citation20,Citation21] The principle of the AACCI method involves it tracks the viscosity changes that take place when rice flour-water slurry is heated with continuous stirring. The temperature at which the viscosity of 20% slurry begins to rise, determined as GT. The Rapid Viscoamylograph (RVA) instrument is used extensively in advanced rice quality labs to determine GT.[Citation22]
GC Test: Usually, GC is measured by the length of the cold gel in the culture tube held horizontally for 0.5 to 1 h. Varietal differences in GC exist among varieties of similar amylose content (>25%). Depending on GC measurement the test separates high-amylose rice into three categories ().
Table 3. High-amylose rice varieties are grouped into three categories based on their GC
GC determination procedure: In the GC determination test at first it is necessary to ensure that all the samples are kept at the same storage temperature for at least 2 days to ensure that the moisture content is similar. Then carefully place 10 rice grains in the Wig-L-Bug amalgamator and grind for approximately 40 sec to give 100 mesh fine flour. Afterward, 100 mg flour (±1 mg at 12% moisture) is weighed in duplicate into a 13 × 100 mm culture tubes.
Soft, hard, and medium gel rice varieties were included as standards. Ethyl alcohol (0.2 mL of 95%) containing 0.025% thymol blue is added and 2.0 mL of 0.2 M KOH is added with a pipette (here alcohol prevents clumping of the powder during alkali gelatinization, while thymol blue imparts color to the alkali paste to make the gel front easier to read). The mixtures were then mixed using a Vortex mixer with speed set at about 6. Then all the test tubes need to be enclosed with glass marbles to avoid reflux and steam loss.
The samples are then cooked for 8 min vigorously in a boiling water bath to make sure that the sample content reach 2/3 the height of the tube. Afterward, the test tubes need to be removed from the water bath and cool at room temperature for 5 min. The tubes are then cooled in an ice-water bath shaker for 20 min and finally laid horizontally on a table lined with millimeter graphing paper. The total length of the gel is measured from the bottom of the tube to the gel front and calculated as mm.
AC: Many of the cooking and eating characteristics of milled rice are influenced by the ratio of two kinds of starches, amylose, and amylopectin, in the rice grain.[Citation23] Amylose is the linear fraction of starch in the no glutinous varieties, whereas amylopectin, the branched fraction, makes up the remainder of the starch. According to rice varieties are grouped into waxy (0–2%), very low (3–9%), low (10–19%), intermediate (20–25%), and high (>25%) based on their AC.[Citation13,Citation24] Usually, AC correlates negatively with taste panel scores for tenderness, cohesiveness, gloss, and color of boiled rice.[Citation25] A great majority of the rice from Myanmar, Vietnam, Thailand, and the Indian subcontinent prefer a high amylose content.[Citation14] The major feature of such rice is a high degree of flakiness and high-volume expansion.[Citation14] Additionally, such type is less tender, cooks dry, and becomes hard upon cooling.[Citation14] Most rice-growing areas of the world are intermediate AC rice varieties. This rice does not become hard upon cooling and cooks moist and shows tenderness.[Citation14] A great majority of the rice from Malaysia, Indonesia, and the Philippines are intermediate AC rice varieties.[Citation14] A survey conducted by IRRI shows that intermediate AC rice is the most preferred rice variety consumed in the Southeast Asia region.[Citation13] However, amylose is nearly absent from waxy (glutinous) rice. All the japonica varieties of temperate regions have a low AC and thus are also considered as waxy rice varieties. This rice shows a high glossy and sticky feature and remains firm when cooked.[Citation25] This rice is the most staple food of people in Thailand and Lao. Low-amylose rice cooks moist and sticky.[Citation14] Thus, scientists around the world are mainly interested in the development of improved germplasm with intermediate AC.
Table 4. Classification of rice-based on their AC
Procedure used for AC analysis: Still now, the simplified procedures (Auto-Analyzer and manual method) of Juliano[Citation26] are essentially used for the AC analysis.[Citation14] In this procedure, the moisture content of the samples is principally constant and need not be determined if the relative humidity and temperature of the laboratory are controlled.[Citation14] The AC is determined by using a conversion factor and the results are expressed on a dry weight basis. For every experiment, high, low, and intermediate amylose standard varieties must be included to serve as checks.
Briefly, twenty dehusked whole rice kernels need to be ground with a Udy cyclone mill. Then, 100 mg of rice powder needs to be put into a 100-mL volumetric flask, and subsequentially 9 mL of 1 M sodium hydroxide and 1 mL of 95% ethanol need to be added. Then, the mixture needs to be heated in a boiling water bath to gelatinize the starch. After that, the mixture needs to be cooled for approximately 1 h. Then sufficient distilled water needs to be added and confirm that the contents are mixed well.
Then, five mL of the starch solution is put through a pipette again in a 100-mL volumetric flask and add 1 mL 1 M acetic acid and 2 mL of iodine solution. (2.0 g potassium + 0.2 g iodine + distilled water = 100 mL aqueous iodine solution) and the volume is made up 100 with the addition of required distilled water. The mixers are then shaken well and left to stand for 20 min. Finally, the absorbance of the solution is measured at 620 mm with a spectrophotometer.[Citation14] Starch solutions (100 mg 100 mL 1) prepared by the above manual method can also automatically analyzed with an Auto-Analyzer. The results are usually expressed as percent apparent AC in milled rice weight. This process also requires A standard curve which is essentially prepared by using rice samples of known amylose content.
Grain elongation: Usually, grain elongation appears to be a quantitative trait. Grain elongation is being tested into improved germplasm. Evaluation for these properties were done in the F3 generation. Some pilot experience indicates that only a few hybrid lines approach the parents in degree of elongation.
Procedure to determine grain elongation: The method used for evaluating the degree of elongation is described by Cruz et al.[Citation14] At first 25 whole milled kernels are soaked in 20 mL of distilled water and kept for 30 min. The samples are then placed in a circulating water bath at 98°C for 10 min. Afterward, the heated rice is transferred to a petri dish lined with filter paper. Out of 25 cooked whole grains, 10 grains are selected and placed in a photographic enlarger to measure the proportionate elongation. Finally, the grain elongation is calculated by the ratio of the average length of raw rice grains to the average length of cooked rice grains.
Appearance quality
The appearance quality of rice is an important property to the consumers as they prefer rice with a translucent endosperm and are willing to pay a premium price for it. Thus, appearance quality is among the first criteria of rice quality that breeders usually consider in developing new varieties for commercial production.[Citation14] Appearance quality is usually classified based on shape and length. Here, length is the measure of the rice kernel based on its dimension while the shape is measured by the length: width ratio. Generally, the size and shape of a rice grain can be visually classified, however, more precise measurements are required for critical comparison of varieties. One of the useful classifications for routine breeding evaluation are tabulated in .
Table 5. The routine classification system used by the international rice research institute
Table 6. Classification of rice-based on shape .[Citation14].
Another useful appearance quality is chalkiness which is mostly determined by endosperm opacity. The amount of chalkiness is measured either on the center (white center), dorsal side of the grain (white belly), or in the ventral side (white back).[Citation14] In the chalky areas the starch granules are less compactly packed as compared to translucent areas.[Citation14] Therefore, the chalky areas are not as hard as the translucent areas and the grains with chalkiness are more prone to breakage during milling. For routine analysis milled grains are scored for the absence or presence of white center, white belly, white back, breakage at the basal-ventral end of the grain, and degree of translucency and thus mentioned as the condition of the eye. The scale used for classifying rice with chalkiness is tabulated in . Basically, Chalk is produced due to genetic and environmental factors. Among them, a rise in nighttime air temperatures during the grain filling stage can raise chalk and thus cut HR yields.[Citation27] Finally, rice grain dimensions are often measured using vernier calipers, transparent rulers, and photographic enlargers[Citation28] while chalk dimensions are visually scored. However, grain dimensions measurement by manual procedures is both time-consuming and labor intensive. Moreover, visual scoring of chalk involves bias. To overcome these challenges, recently, image analysis methods are being used in advanced laboratories to reduce time and bias.[Citation1,Citation28]
Table 7. Classification of rice-based on chalkiness .[Citation14].
Aroma
Most of the premium quality preferred rice varieties are aromatic for example, Dulhabhog of Bangladesh, Leuang Hawn of Thailand, Khao Dawk Mali, Azucena and Milfor of the Philippines, Sadri varieties of Iran, Rojolele of Indonesia, Barah of Afghanistan, Della of the United States and Basmati rice of Pakistan and India.[Citation14] Some attractive features of this aromatic rice are intermediate amylose content and gelatinization temperature, high elongation ratio, long slender grains, and strong aroma.[Citation14]
Procedure used to determine the aroma: A simple laboratory technique to evaluate the aroma of rice grain was developed at IRRI (1971).[Citation14] The details of the procedure are listed below:
One gram of freshly harvested milled rice is placed into a centrifuge tube (50 ml round bottom). About 20 ml of distilled water is added.
The tubes are then covered with aluminum foil. The samples are placed in a boiling water bath for 10 minutes
The cooked samples can cool, and the presence of aroma is determined for every sample. Brown rice may also be used with the cooking time increased to 30 minutes.
The samples are scored as strongly aromatic, moderately aromatic, slightly aromatic, and non-aromatic. A strongly scented variety is used as a check for comparison.
Nutritional quality
Rice is consumed as a staple food for providing sustenance to half the world. Starch is the major source of energy and is the main constituent of milled rice grain; and thus, it affects rice nutritional quality. It has been documented that starch is digested at different rates in the human digestive system.[Citation29] The digestibility of starch is measured by the glycemic response and is known as the glycemic index (GI). GI is measured by estimating the rise in blood glucose level upon consumption of food containing 50 g available carbohydrates compared to a 50 g glucose as the standard solution.[Citation30,Citation31] The estimation of GI is time consuming and expensive clinical assay; therefore, it is not suitable for routine nutritional quality analysis in rice grain.[Citation32] Therefore, estimation of nutritional fractions of starch is carried out worldwide which involves estimating the content of total starch, and total sugars. Besides, rapidly digestible starch, slowly digestible starch, and resistant starch are also measured.[Citation33]
The other major macronutrients measured in rice kernels are proteins, lipids, and non-starch polysaccharides. Even though they constitute minor components of a milled rice grain, these macronutrients significantly affect the textural, sensory traits, functional properties, and nutritional quality of rice grain.[Citation32] Rice proteins are hypoallergenic and possess good amino acid composition thus acting as the major source of proteins in developing countries as well as African continents.[Citation34] The Kjeldahl method (AACCI Method 46–13.01) is widely used for the estimation of total proteins.[Citation35]
Nutritional components such as vitamins, minerals, and phytochemicals are intense in the bran layer and are present at low levels or absent in milled grains. The zinc and iron are present in low amounts and some of which are lost during milling. Subsequently, a modest increase in these micronutrient levels in rice could offer a substantial nutritional boost to the millions of people who consume rice as a staple food. Thus, as a staple food, there is an imperative demand for the fortification of some additional nutrients, a shift in emphasis toward the development of nutritionally high-quality rice. This is achieved by evaluating the available germplasm lines for micronutrient content and by the generation of knowledge regarding their inheritance pattern to use in future breeding programs. Micronutrients are being quantified by using atomic absorption spectroscopy (AAS), X-ray fluorescence spectrometry (XRF), inductively coupled plasma-mass spectrometry (ICP-MS), laser-induced breakdown spectroscopy (LIBS), and inductively coupled plasma-optical emission spectrometry (ICP-OES).[Citation36]
QTLs for rice grain quality enrichment
Rice is cultivated universally, and it has a rich germplasm resource, including naturally found and artificially modified germplasms. Yet, it lacks many vital nutrients including essential amino acids, fatty acids, vitamins, minerals, and phytochemicals; hence further enhancement is required to meet the future demands. New varieties with better quality, yield capability, and resistance to biotic and abiotic stress conditions are often studied in rice breeding programs but enhancement of grain quality should also be given attention because all end users want the best grain quality. The view of grain quality improvement programs comprises enrichment in physical properties, milling, biochemical, cooking, eating, and nutritional quality. Several studies have reported genes and QTLs are related to grain quality. Recently, various molecular tools for marker assisted selection are available to improve grain quality by combining with other important traits (). Genome-Wide Association Study (GWAS) has emerged as a powerful tool with rapid development in next-generation sequencing technology has become an innovative approach to work on a diverse population with relatively unbiased technique for loci and candidate genes identification in several species.[Citation36] In the study of GWAS for ionomic concentration in rice, Zhang et al.[Citation56] identified 47 QTL regions for grain mineral concentrations (GMC) of Fe, Zn, Cd, Mn, Cu, and Se in milled grains. In another study, Norton et al.[Citation57] analyzed As, Cu, Mo, and Zn concentrations in rice grain performed across five environments. Famoso et al.[Citation58] identified 48 genomic regions associated with Al tolerance and similarly, 14 QTLs and a novel candidate gene, OsNRAMP2, associated with QTL for Cd accumulation in rice grain were identified.[Citation58] The composition of trace elements and mineral nutrients in plants is known as plant ionome.[Citation59] Plant ionome are determined either by genetic or environmental factors as well as their possible interactions.[Citation59] A comprehensive study of the genetic architecture of the variation in the rice ionome analyzes 17 elements concentration in rice grain and identifies 72 loci associated with natural ionomic variations.[Citation59] Many genes which are responsible for the uptake, translocation, and storage of mineral elements in plants have been identified .[Citation59] However, the trait related to grain quality is often complicated and thus requires more studies before implementation. The list of genes responsible for RGQ is tabulated in .
Table 8. List of genes responsible for RGQ
QTLs for improving appearance quality: Up to this date, numerous genes have been identified in previous studies that control rice appearance quality. A total of 28 QTLs were reported for appearance quality of which numerous were reported for the first time.[Citation20] Among the four major and six minors, grain shapes were finely mapped and characterized functionally.[Citation20] A functional marker in the second exon of GS3 was identified in the year 2009 by Fan et al.[Citation59] which explains that GS3 genes are responsible for 80–90% of the kernel length variation. Similarly, Bai et al.[Citation60] identified four QTLs on chromosomes (Ch) 3 and 7 for grain length and 10 QTLs for grain width, and 9 QTLs for grain thickness on Ch 2, 3, 5, 7, 9, and 10, respectively. Thus, different studies across different environments and genetic backgrounds identified some genes which can control the appearance quality of rice kernels. For instance, qSW5/GW5/ GSE5 affects grain width.[Citation44–46] GS3 affects grain length[Citation45] and GL7/GW7[Citation56] shaping both grain length and grain width. However, a limited number of QTLs for grain chalkiness have been documented. Chalk 5 was the first QTLs that were cloned and functionally characterized to control rice grain chalkiness.[Citation44] Recently, Fiaz et al.[Citation47] documented that integration of functionally characterized QTLs through knock-in/out with CRISPR/Cas9 can significantly improve the understanding of rice grain appearance quality.
QTLs for improving GT: Similarly, a functional marker corresponding to the alk locus was identified by Fan et al.[Citation59] with evidence that Alk/alk has a major effect on alkali spreading value. It has been documented that Alk/alk codes for starch synthase IIa (SSIIa).[Citation61,Citation62] GT is classified into two groups by allelic variation in SSlla.[Citation61,Citation62] The single nucleotide polymorphism (SNP) in SSlla defines four haplotypes (two haplotypes associated with high GT and two haplotypes associated with low GT).[Citation37,Citation63] SSIIa is accountable for the major variances in amylopectin chain length distribution, specifically, four haplotypes can distinguish easily within low and high GT verities.[Citation62] Furthermore, starch synthesis related genes such as SSI, SSIV-2, SSIII-2, SSIIa as well as starch biosynthesis related genes for instance ISA, BE3, SBE1, AGPlar, and PUL all have effects on the overall cooking and eating quality of rice.[Citation5,Citation47] However, up to this date, specific QTLs which can identify genotypes within the intermediate class of GT have yet to be discovered.
QTLs for improving AC: With the advent of molecular marker technology, it is now easy to apprehend complex quantitative traits.[Citation7] Various genetic studies have documented that AC is controlled by one major gene known as the waxy gene locus (Wx) present on Ch 6. Wx encodes the granule-bound starch synthase (GBSS) which is required for amylose synthesis.[Citation64] Also, several alleles are encoded by the Wx locus such as-Wxa, Wxb, and Wx, which are well known and present in japonica, waxy (sticky) rice, indica, and sub-species, respectively.[Citation39,Citation40] However, the activity of the encoded protein and GBSS differs in different genetic backgrounds.[Citation17] Moreover, SNPs at the splice site of intron 1 differentiate low amylose varieties from the high and intermediate amylose varieties. Thus, rice can be categorized depending on this SNP into Wxa and Wxb alleles for high and low amylose, respectively.[Citation38]
QTLs for Improving Milling Yield: Milling yield is an important grain quality parameter, particularly from the commercial standpoint. This trait is estimated based on the recovery of head rice, brown rice, and milled rice.[Citation65] About 34 QTLs have been identified in ten studies for head rice recovery. One of the prominent QTLs identified for head rice recovery in Ch 3 and another trait for grain length was also found in the same region.[Citation42] Similar other studies have also reported the QTL for head rice recovery in Ch 3 which supported that the QTL for head rice recovery is in this Ch.[Citation47,Citation66,Citation67] By contrast, three studies have reported the QTL for head rice recovery in ch 1,[Citation68] 5,[Citation68] and 6.[Citation69] However, this trait is affected by abiotic factors, especially in environmental interactions. For instance, Chandra et al.[Citation65] studies revealed that the environment plays an important role in the expression of this QTL as there is a strong correlation between the recovery of head rice with QTLs in the warm parts of the world.
Approximately 20 QTLs have been discovered for brown rice recovery Chandra et al. .[Citation65] Previous study results supported that all Ch contain QTL for brown rice recovery except Ch 2.[Citation65] One of the important and functionally active QTLs found in Ch 5 has also contained traits related to the grain width (C734b and RM42 marker).[Citation42] Other studies also supported that the same QTL region in Ch 3 controlled both brown rice recovery and grain length.[Citation47] Thus, the outcomes indicate that brown rice recovery is linked with size and shape of grain.
In previous studies, there were a total of 19 QTLs reported for milled rice recovery. All Ch contain QTL for milled rice recovery except Ch 8.[Citation65] Three important QTLs for the recovery of milled rice were identified on Ch 5 by three independent studies.[Citation47] However, almost all the QTLs related to this trait have fractional effects.[Citation47,Citation66,Citation67] Thus, the genetic control behind this trait is very intricate and is not very well understood.
QTLs for Improving Rice Protein Content: Rice breeding innovation programs are continuously trying to generate nutrient-rich rice varieties. Protein content in rice is an important nutritional component of rice that affects cooking and eating quality as well as consumer health. It has been reported previously that qGPC-1, qGPC-10, qCPC5, Ra, Rc, Rd QTLS on Ch1, Ch5, Ch7 and Ch10 segment control protein, fat and phenolics content in rice grain.[Citation41] In the current year, chromosome segment substitution lines (CSSLs) for rice protein QTLs mapping were developed by Zhao et al. .[Citation43] They were able to identify four novel and stable QTLs for rice protein content enrichment by CSSLs mapping from 9311 (recipient) and Nipponbare (donor). Their novel QTLs could serve as candidate genes for future research.
Future prospects
RGQ is directly or indirectly influenced by a decrease in cultivable land due to a rise in urbanization, climate fluctuations and soil deterioration. For a couple of years, rice breeding innovation programs have developed numerous crop varieties with improved traits including biotic and abiotic stresses, high yield, and disease resistant varieties.
Among RGQ, cooking and eating traits appear to be very much important as it is directly regulating consumer demand as well as market price. Research on the cooking and eating quality traits have made some progress but, the genetic mechanism of this trait is too complex and needs to be deciphered. Recently, the advancement of marker-assisted selection (MAS) has made some progress to improve cooking and eating quality. Yet, molecular breeding program, for example genome editing, and genome-wide association and genome sequencing studies might also be applied to improve cooking and nutritional quality .[Citation41]
Rice appearance quality is also an important and complex trait, and it involves interaction within the quality and yield as well as affected by environment. Among various appearance qualities, chalkiness is of primary concern since it affects the milling, eating, and cooking properties. To solve chalkiness, genotypes with low chalk formation at high temperature after a heading can be identified and utilized through MAS. Besides, biochemical, physiological, and molecular mechanisms must need to be worked parallel to identify and clone chalkiness functional genes.
The most challenging issue facing the milling industry is to obtain high head rice recovery, since it is directly related to profitability to both the farmers and millers. QTLs of milling quality is still immature because no milling quality mutants have been reported yet, however, mutants induced by T-DNA insertion might create a new starting point for describing the genes responsible for milling quality. To conduct in-depth research on milling quality, rapid and accurate analytical tools are required to measure the trait, as well as finely dissection of QTLs with large effects. Thus, improvement of milling quality requires the following steps: (i) Rapid and precise analytical equipment’s to measure the trait; (ii) Search for new QTLs with high yield varieties; (iii) With the prompt advancement in functional genomics and high throughput genotyping technologies, a greater amount of rice functional genes can be cloned in the future to explore allelic discrepancy in polymorphisms or transformed into better quality lines to meet regional consumer preferences, (iv) improvement in postharvest handling techniques; and (v) Improvement in storage conditions.
Nowadays, people are much concerned about the health benefits of rice thus nutritional quality which includes protein, minerals, fat, and phenolics will be a new area for further research. Each nutrient in rice grain may vary from one variety to another as it is formed through a complex pathway which involve many enzymes or genes. Still now, invented QTLs controlling a diversity of grain quality traits have been recognized only on ch 3, 6, and 8 indicating that there are still many novel genes to be discovered. Finally, the success of molecular breeding technologies is dependent on consumer acceptance; however, the major downsides of traditional transformation technologies are the inability to eliminate the endogenous target gene. Thus, modern molecular breeding tools including targeted genome editing skills can play an important role in minimizing this barrier.
Author contributions
Writing—original draft preparation, S, Sultana & M, Faruque; writing—review and editing, S, Sultana; M.R, Islam; supervision, M.R, Islam; project administration, M.R, Islam; funding acquisition, M.R, Islam.
Disclosure statement
No potential conflict of interest was reported by the author(s).
Additional information
Funding
References
- Sharma, N., and Khanna, R. Rice Grain Quality: Current Developments and Future Prospects. In Recent Advances in Grain Crops Research. Rijeka, Coratia; IntechOpen, 2019; pp 105.
- Khush, G. S. What It Will Take to Feed 5.0 Billion Rice Consumers in 2030. Plant Mol. Biol. 2005, 59(1), 1–6. pmid:16217597. DOI: 10.1007/s11103-005-2159-5.
- The World Population Prospects: The 2017 Revision, Published by the UN Department of Economic and Social Affairs.
- Wang, K.; Wambugu, P. W.; Zhang, B.; Wu, A. C.; Henry, R. J.; Gilbert, R. G. The Biosynthesis, Structure, and Gelatinization Properties of Starches from Wild and Cultivated African Rice Species (Oryza Barthii and Oryza Glaberrima). Carbohydr. Polym. 2015, 129, 92–100. DOI: 10.1016/j.carbpol.2015.04.035.
- Bao, J. S. Toward Understanding the Genetic and Molecular Bases of the Eating and Cooking Qualities of Rice. Cereal Foods World. 2012, 57(4), 148–156. DOI: 10.1094/CFW-57-4-0148.
- Zhou, J.; Xin, X.; He, Y.; Chen, H.; Li, Q.; Tang, X.; Zhong, Z.; Deng, K.; Zheng, X.; Akher, S. A., et al. Multiplex QTL Editing of Grain-related Genes Improves Yield in Elite Rice Varieties. Plant Cell Rep. 2019, 38(4), 475–485. DOI: 10.1007/s00299-018-2340-3.
- Fan, C. C.; Yu, X. Q.; Xing, Y. Z.; Xu, C. G.; Luo, L. J.; Zhang, Q. The Main Effects, Epistatic Effects, and Environmental Interactions of QTLs on the Cooking and Eating Quality of Rice in a Doubled-haploid Line Population. Theor. Appl. Genet. 2005, 110(8), 1445–1452. DOI: 10.1007/s00122-005-1975-y.
- Ahmed, F.; Abro, T. F.; Kabir, M.; Latif, M. A. Rice Quality: Biochemical Composition, Eating Quality, and Cooking Quality. In The Future of Rice Demand: Quality beyond Productivity; Springer: Cham, 2020; pp 3–24.
- Butardo, V. M., Jr.; Sreenivasulu, N.; Jeon, K. Tailoring Grain Storage Reserves for a Healthier Rice Diet and Its Comparative Status with Other Cereals. Int. Rev. Cell Mol. Biol. 2016, 323, 31–70.
- Khush, G. S.; Juliano, B. O. Breeding for High-yielding Rices of Excellent Cooking and Eating Qualities. Rice grain quality and marketing. Papers presented at the International Rice 1985 Research Conference, Manila, Philippines, International Rice Research Institute, 1985. pp 61–69.
- Bergman, C. J.; Bhattacharya, K. R.; Ohtsubo, K. Rice End-use Quality Analysis. In Rice Chemistry and Technology, 3rd ed.; Champagne, E. T., Ed.; AACC International: St. Paul, MN, 2004; pp 415–472.
- Khush, G. S.; Kumar, I.; Virmani, S. S. Grain Quality of Hybrid Rice. Hybrid Rice; International Rice Research Institute: Manila (Philippines), 1988; pp 201–215.
- Graham, R. A proposal for IRRI to establish a grain quality and nutrition research center (No. 2169-2019-1615); 2002.
- Cruz, N. D.; Khush, G. S. Rice Grain Quality Evaluation Procedures. Aromat. Rices. 2000, 3, 15–28.
- de Oliveira, A. C.; Pegoraro, C., and Viana, V. E. The Future of Rice Demand: Quality beyond Productivity; Cham Switzerland: Springer, 2020.
- Traore, K. Characterization of novel rice germplasm from West Africa and genetic marker associations with rice cooking quality. PhD diss., Texas A & M University, USA, 2005.
- Fitzgerald, M. A.; Sackville Hamilton, N. R.; Calingacion, M. N.; Verhoeven, H. A.; Butardo, V. M. Is There a Second Fragrance Gene in Rice? Plant Biotechnol. J. 2008, 6(4), 416–423. DOI: 10.1111/j.1467-7652.2008.00327.x.
- Normand, F. L.; Marshall, W. E. Differential Scanning Calorimetry of Whole Grain Milled Rice and Milled Rice Flour. Cereal Chem. 1989, 66, 317–321.
- Bhattacharya, K. R.; Sowbhagya, C. M.; Indudhara, S. Y. M. Importance of Insoluble Amylose as a Determinant of Rice Quality. J. Sci. Food Agric. 1978, 29(4), 359–364. DOI: 10.1002/jsfa.2740290410.
- Sharma, A.; Jaiswal, H. K. Heterosis for Yield and Grain Quality Parameters in Basmati Rice (Oryza Sativa L.). Electron. J. Plant Breed. 2020, 11, 1106–1115.
- Halick, J. V.; Beachell, H. M.; Stansel, J. W.; Kramer, H. H. A Note on the Determination of Gelatinization Temperature of Rice Varieties. Cereal Chem. 1960, 37, 670.
- Champagne, E. T.; Bett, K. L.; Vinyard, B. T.; McClung, A. M.; Barton, F. E.; Moldenhauer, K. A.; Linscombe, S.; McKenzie, K. Correlation between Cooked Rice Texture and Rapid Visco Analyser Measurements. Cereal Chem. 1999, 76(5), 764–771. DOI: 10.1094/CCHEM.1999.76.5.764.
- Fitzgerald, M. A.; Bergman, C. J.; Resurreccion, A. P.; Möller, J.; Jimenez, R.; Reinke, R. F.; Martin, M.; Blanco, P.; Molina, F.; Chen, M.-H. Addressing the Dilemmas of Measuring Amylose in Rice. Cereal Chem. 2009, 86(5), 492–498. DOI: 10.1094/CCHEM-86-5-0492.
- Kumar, I.; Khush, G. S. Gene Dosage Effect of Amylose Content in Rice Endosperm. Jpn. J. Genet. 1986, 61(6), 559–568. DOI: 10.1266/jjg.61.559.
- Cheng, F. M.; Zhong, L. J.; Wang, F.; Zhang, G. P. Differences in Cooking and Eating Properties between Chalky and Translucent Parts in Rice Grains. Food Chem. 2005, 90(1–2), 39–46. DOI: 10.1016/j.foodchem.2004.03.018.
- Juliano, B. O. A Simplified Assay for Milled Rice Amylose. Cereal Sci. 1971, 16, 334–338, 340, 360.
- Cooper, N. T.; Siebenmorgen, T. J.; Counce, P. A. Effects of Nighttime Temperature during Kernel Development on Rice Physicochemical Properties. Cereal Chem. 2008, 85(3), 276–282. DOI: 10.1094/CCHEM-85-3-0276.
- Yu, L.; Turner, M. S.; Fitzgerald, M.; Stokes, J. R.; Witt, T. Review of the Effects of Different Processing Technologies on Cooked and Convenience Rice Quality. Trends Food Sci.Technol. 2017, 59, 124–138. DOI: 10.1016/j.tifs.2016.11.009.
- Marsh, K.; Brand-Miller, J. State of the Art Reviews: Glycemic Index, Obesity, and Chronic Disease. Am. J. Lifestyle Med. 2008, 2(2), 142–150. DOI: 10.1177/1559827607311514.
- Wolever, T. M. S. Glycaemic Index: A Physiological Classification of Dietary Carbohydrate. In CAB International Book Archive, Titles From 2005, 2006, 2007. CABI Publishing: Wallingford, UK, 2006.
- Trinidad, T. P.; Mallillin, A. C.; Encabo, R. R.; Sagum, R. S.; Felix, A. D.; Juliano, B. O. The Effect of Apparent Amylose Content and Dietary Fiber on the Glycemic Response of Different Varieties of Cooked Milled Rice and Brown Rice. Int. J. Food Sci. Nut. 2013, 64(1), 89–93. DOI: 10.3109/09637486.2012.700922.
- Butardo, V. M.; Sreenivasulu, N.; Juliano, B. O. Improving Rice Grain Quality: State-of-the-art and Future Prospects. Rice Grain Qual. 2019, 19–55.
- Englyst, K. N.; Englyst, H. N.; Hudson, G. J.; Cole, T. J.; Cummings, J. H. Rapidly Available Glucose in Foods: An in Vitro Measurement that Reflects the Glycemic Response. Am. J. Clin. Nutr. 1999, 69(3), 448–454. DOI: 10.1093/ajcn/69.3.448.
- Shih, F. F. 2019. Rice Proteins. In Rice: Chemistry and Technology, 3rd ed.; Champagne, E. T., Ed.; American Association of Cereal: Inc, St. Paul, MN.
- AACC. International Approved Methods of Analysis; Association for American Cereal Chemists (AACC International): St. Paul, MN, 2009.
- Zhao, X.; Zhou, L.; Ponce, K.; Ye, G. The Usefulness of Known Genes/Qtls for Grain Quality Traits in an Indica Population of Diverse Breeding Lines Tested Using Association Analysis. Rice. 2015, 8(1), Yano, K. E., Aya, K., Takeuchi, Y., Lo, P., Hu, L., Yamasaki, M. “Genome-wide association study using whole-genome sequencing rapidly identifies new genes influencing agronomic traits in rice.” Nat. Genet. 2016, 48, 927-934. DOI: 10.1186/s12284-015-0064-3.
- Waters, D. L. E.; Henry, R. J.; Reinke, R. F.; Fitzgerald, M. A. Gelatinization Temperature of Rice Explained by Polymorphisms in Starch Synthase. Plant Biotechnol. J. 2006, 4(1), 115–122. DOI: 10.1111/j.1467-7652.2005.00162.x.
- Zhang, G.; Cheng, Z.; Zhang, X.; Guo, X.; Su, N.; Jiang, L.; Mao, L.; Wan, J.; Gulick, P. Double Repression of Soluble Starch Synthase Genes SSIIa and SSIIIa in Rice (Oryza Sativa L.) Uncovers Interactive Effects on the Physicochemical Properties of Starch. Genome. 2011, 54(6), 448–459. DOI: 10.1139/g11-010.
- Teng, B.; Zeng, R.; Wang, Y.; Liu, Z.; Zhang, Z.; Zhu, H.; Ding, X.; Li, W.; Zhang, G. Detection of Allelic Variation at the Wx Locus with Single-segment Substitution Lines in Rice (Oryza Sativa L.). Mol. Breed. 2012, 30(1), 583–595. DOI: 10.1007/s11032-011-9647-x.
- Chen, L.; Gao, W.; Chen, S.; Wang, L.; Zou, J.; Liu, Y.; Wang, H.; Chen, Z.; Guo, T. High-resolution QTL Mapping for Grain Appearance Traits and Co-localization of Chalkiness-associated Differentially Expressed Candidate Genes in Rice. Rice. 2016, 9(1), 1–17. DOI: 10.1186/s12284-016-0121-6.
- Patra, B.; Majhi, P. K.; Tripathy, S. K.; Tripathy, S. P.; Khan, A.; Behera, P. P.; Das, S.; Ahamad, A. Genomic-Assisted Breeding Tools for Grain and Nutritional Quality Improvement in Rice. Int. J. Environ. Clim. 2022, 12(1), 10–24.
- Tan, Y. F.; Sun, M.; Xing, Y. Z.; Hua, J. P.; Sun, X. L.; Zhang, Q. F.; Corke, H. Mapping Quantitative Trait Loci for Milling Quality, Protein Content and Color Characteristics of Rice Using a Recombinant Inbred Line Population Derived from an Elite Rice Hybrid. Theor. Appl. 2001, 103(6–7), 1037–1045. DOI: 10.1007/s001220100665.
- Zhao, L.; Zhao, C. F.; Zhou, L. H.; Yao, S.; Zhao, Q. Y.; Chen, T.; Zhu, Z.; Zhang, Y. D.; Wang, C. L. Mapping QTLs for Rice (Oryza Sativa L.) Grain Protein Content via Chromosome Segment Substitution Lines. Cereal Res. Commun. 2022, 18, 1.
- Liu, J.; Chen, J.; Zheng, X.; Wu, F.; Lin, Q.; Heng, Y.; Tian, P.; Cheng, Z.; Yu, X.; Zhou, K. GW5 Acts in the Brassinosteroid Signalling Pathway to Regulate Grain Width and Weight in Rice. Nature Plants. 2017, 3(5), 17043. DOI: 10.1038/nplants.2017.43.
- Shomur, A.; Izawa, T.; Ebana, K.; Ebitani, T.; Kanegae, H.; Konishi, S.; Yano, M. Deletion in a Gene Associated with Grain Size Increased Yields during Rice Domestication. Nat. Genet. 2008, 40(8), 1023–1028. DOI: 10.1038/ng.169.
- Duan, P.; Xu, J.; Zeng, D.; Zhang, B.; Geng, M.; Zhang, G.; Huang, K.; Huang, L.; Xu, R.; Ge, S. Natural Variation in the Promoter of GSE5 Contributes to Grain Size Diversity in Rice. Mol. Plant. 2017, 10(5), 685–694. DOI: 10.1016/j.molp.2017.03.009.
- Fiaz, S.; Ahmad, S.; Noor, M. A.; Wang, X.; Younas, A.; Riaz, A.; Riaz, A.; Ali, F. Applications of the CRISPR/Cas9 System for Rice Grain Quality Improvement: Perspectives and Opportunities. Int. J Mole Sci. 2019, 20(4), 888. DOI: 10.3390/ijms20040888.
- Xu, R.; Yang, Y.; Qin, R.; Li, H.; Qiu, C.; Li, L.; Wei, P.; Yang, J. Rapid Improvement of Grain Weight via Highly Efficient CRISPR/Cas9-mediated Multiplex Genome Editing in Rice. J. Genet. Genom. 2016, 43(8), 529–532. DOI: 10.1016/j.jgg.2016.07.003.
- Shen, L.; Li, J.; Fu, Y.; Wang, J.; Hua, Y.; Jiao, X.; Yan, C.; Wang, K. Orientation Improvement of Grain Length and Grain Number in Rice by Using CRISPR/Cas9 System. Chin. J. Rice Sci. 2017, 31, 223–231.
- Liu, J.; Wu, X.; Yao, X.; Yu, R.; Larkin, P. J.; Liu, C.-M. Mutations in the DNA Demethylase OsROS1 Result in a Thickened Aleurone and Improved Nutritional Value in Rice Grains. Proc. Natl. Acad. Sci. USA. 2018, 115(44), 11327–11332. DOI: 10.1073/pnas.1806304115.
- Paul, J.; Rana, J. Consumer Behavior and Purchase Intention for Organic Food. J. Consumer Marketing. Sep 7, 2012, 29(6), 412–422. DOI: 10.1108/07363761211259223.
- Lee, S.; Jeon, U. S.; Lee, S. J.; Kim, Y. K.; Persson, D. P.; Husted, S.; Schjørring, J. K.; Kakei, Y.; Masuda, H.; Nishizawa, N. K., et al. Iron Fortification of Rice Seeds through Activation of the Nicotianamine Synthase Gene. Proc. Natl. Acad. Sci. 2009, 102, 22014–22019. DOI: 10.1073/pnas.0910950106.
- Lee, S.; Kim, S. L.; Lee, Y. S.; Choi, S. C.; Jeong, H. J.; Yi, J.; Park, S. J.; Han, C. D.; PARK, S. J.; HAN, C.-D. OsMADS50 and OsMADS56 Function Antagonistically in Regulating Long Day (Ld)-dependent Flowering in Rice. Plant Cell Environ. 2009, 32(10), 1412–1427. DOI: 10.1111/j.1365-3040.2009.02008.x.
- Ishimaru, Y.; Masuda, H.; Bashir, K.; Inoue, H.; Tsukamoto, T.; Takahashi, M.; Nakanishi, H.; Aoki, N.; Hirose, T.; Ohsugi, R., et al. Rice Metal‐nicotianamine Transporter, OsYSL2, Is Required for the Long‐distance Transport of Iron and Manganese. Plant J. 2010, 62(3), 379–390. DOI: 10.1111/j.1365-313X.2010.04158.x.
- Lee, S.; An, G. Over-expression of OsIRT1 Leads to Increased Iron and Zinc Accumulations in Rice. Plant Cell Environ. 2009, 32(4), 408–416. DOI: 10.1111/j.1365-3040.2009.01935.x.
- Zhang, G. M.; Zheng, T. Q.; Chen, Z.; Wang, Y. L.; Wang, Y.; Shi, Y. M.; Wang, C. C.; Zhang, L. Y.; Ma, J. T.; Deng, L. W., et al. Joint Exploration of Favorable Haplotypes for Mineral Concentrations in Milled Grains of Rice (Oryza Sativa L.). Front. Plant Sci. 2018, 9, 447. 2018. DOI: 10.3389/fpls.2018.00447.
- Norton, G. J.; Duan, G. L.; Lei, M.; Zhu, Y. G.; Meharg, A. A.; Price, A. H. Identification of Quantitative Trait Loci for Rice Grain Element Composition on an Arsenic Impacted Soil: Influence of Flowering Time on Genetic Loci. Ann. Appl. Biol. 2012, 161(1), 46–56. DOI: 10.1111/j.1744-7348.2012.00549.x.
- Famoso, A. N.; Zhao, K.; Clark, R. T.; Tung, C.-W.; Wright, M. H.; Bustamante, C.; Kochian, L. V.; McCouch, S. R.; Copenhaver, G. P. Genetic Architecture of Aluminum Tolerance in Rice (Oryza Sativa) Determined through Genome-wide Association Analysis and QTL Mapping. PLoS Genet. 2011, 7(8), e1002221. DOI: 10.1371/journal.pgen.1002221.
- Fan, C.; Yu, S.; Wang, C.; Xing, Y. A Causal C–A Mutation in the Second Exon of GS3 Highly Associated with Rice Grain Length and Validated as A Functional Marker. Theor. Appl. Genetics. 2009, 118(3), 465–472. DOI: 10.1007/s00122-008-0913-1.
- Bai, X.; Luo, L.; Yan, W.; Kovi, M. R.; Zhan, W.; Xing, Y. Genetic Dissection of Rice Grain Shape Using a Recombinant Inbred Line Population Derived from Two Contrasting Parents and Fine Mapping a Pleiotropic Quantitative Trait Locus qGL7. BMC Genet. 2010, 11(1), 1. DOI: 10.1186/1471-2156-11-16.
- Umemoto, T.; Yano, M.; Satoh, H.; Shomura, A.; Nakamura, Y. Mapping of a Gene Responsible for the Difference in Amylopectin Structure between Japonica-type and Indica Type Rice Varieties. Theor. Appl. Genetics. 2002, 104(1), 1–8. DOI: 10.1007/s001220200000.
- Bao, J. S.; Corke, H.; Sun, M. Nucleotide Diversity in Starch Synthase IIa and Validation of Single Nucleotide Polymorphisms in Relation to Starch Gelatinization Temperature and Other Physicochemical Properties in Rice (Oryza Sativa L.). Theor. Appl. Genetics. 2006, 113(7), 1171–1183. DOI: 10.1007/s00122-006-0355-6.
- Umemoto, T.; Yano, M.; Satoh, H.; Shomura, A.; Nakamura, Y. Mapping of a Gene Responsible for the Difference in Amylopectin Structure between Japonica-type and Indica Type Rice Varieties. Theor. Appl. Genetics. 2002, 104(1), 1–8.
- Smith, A. M.; Denyer, K.; Martin, C. The Synthesis of the Starch Granule. Ann. Rev. Plant Physiol. Plant. Mol. Biol. 1997, 48(1), 67–87. DOI: 10.1146/annurev.arplant.48.1.67.
- Chandra, S.; Banerjee, A., and Roychoudhury, A. . In ; Springer: Singapore, 2020; pp 687–697.
- Dong, Y.; Kamiunten, H.; Ogawa, T.; Tsuzuki, E.; Terao, H.; Lin, D.; Matsuo, M. Mapping of QTLs for Leaf Developmental Behavior in Rice (Oryza Sativa L.). Euphytica. 2004, 138(2), 169–175. DOI: 10.1023/B:EUPH.0000046799.21410.13.
- Aluko, G.; Martinez, C.; Tohme, J.; Castano, C.; Bergman, C.; Oard, J. H. QTL Mapping of Grain Quality Traits from the Interspecific Cross Oryza Sativa× O. Glaberrima. Theor. Appl. 2004 1, 109(3), 630–639. DOI: 10.1007/s00122-004-1668-y.
- Nelson, J. C.; McClung, A. M.; Fjellstrom, R. G.; Moldenhauer, K. A.; Boza, E.; Jodari, F.; Oard, J. H.; Linscombe, S.; Scheffler, B. E.; Yeater, K. M. Mapping QTL Main and Interaction Influences on Milling Quality in Elite US Rice Germplasm. Theor. Appl. 2011, 122(2), 291–309. DOI: 10.1007/s00122-010-1445-z.
- Nelson, J. C.; Oard, J. H.; Growth, D.; Utomo, H. S.; Jia, Y.; Liu, G.; Moldenhauer, K. A.; Correa-Victoria, F. J.; Fjellstrom, R. G.; Scheffler, B., et al. Sheath-blight Resistance QTLS in Japonica Rice Germplasm. Euphytica. 2012, 184(1), 23–34. DOI: 10.1007/s10681-011-0475-1.
- Dang, J. M. C.; Bason, M. L. AACCI Approved Methods Technical Committee Report: Collaborative Study on a Method for Determining the Gelatinization Temperature of Milled Rice Flour Using the Rapid Visco Analyser. Cereal Foods World. 2014, 59(1), 31–34. DOI: 10.1094/CFW-59-1-0031.
- McKenzie, K. S.; Rutger, J. N. Genetic Analysis of Amylose Content, Alkali Spreading Score, and Grain Dimensions in Rice 1. Crop Sci. 1983, 23(2), 306–313. DOI: 10.2135/cropsci1983.0011183X002300020031x.