
ABSTRACT
Lotus rhizome starch (LRS) is an important traditional processed product of lotus rhizome in China due to its good taste and high nutritional value. However, adulterated lotus rhizome starches are prevalent on the market. In this study, a novel method for the rapid detection of adulteration in LRS based on color reaction between ferrous sulfate (FS) and (-)-gallocatechin (GC) in LRS was studied. The polyphenols in LRS were analyzed by liquid chromatography-mass spectrometry (LC-MS/MS) as GC and (+)-catechin, and GC could show a bluish color with FS solution. LRS showed a bluish color when FS solution (0.01 mol/L) was used as the chromogenic agent, which was not observed for other ten kinds of starches tested in this work. There was an obvious color gradient when FS solution was used to react with adulterated LRS at different proportions, and the change in blue color was obvious when maize starch or cassava starch was adulterated in LRS at the ratio of 6:4. Then, a semi-quantitative method was used to make a color card according to the color gradient, which was then successfully used to detect the adulteration of four kinds of commercial LRS. The results indicate that the proposed method may facilitate the simple, effective and efficient detection of adulteration in LRS.
Introduction
Lotus rhizome (Nelumbo nucifera Gaertn.), which is native to the tropical swamp in southern Asia, is a perennial plant of the water lily family. Lotus rhizome has a cultivation history of more than 3000 years,[Citation1] C-1: References should be number format and is one of the most widely cultivated aquatic vegetables in China. It is rich in carbohydrates, vitamins, minerals, proteins and tannins.[Citation2,Citation3] Lotus rhizome starch (LRS) is an important traditional processed product of lotus rhizome. LRS has certain regulatory effects on the functions of the spleen and stomach with convenient consumption, delicious taste and easy digestion, and thus is popular among consumers especially the elderly.[Citation4] In the traditional production process of LRS, after the removal of sediment and nodes, fresh lotus rhizome is first ground, and then subjected to filtering, rinsing, precipitation and drying. However, the yield of LRS is only about 8% of the weight of fresh lotus rhizome, resulting in the high price of LRS. Driven by economic interests, some unscrupulous producers or sellers adulterate LRS with cheap maize starch and cassava starch, which is difficult to be distinguished from pure LRS in appearance. Therefore, to protect the interests of consumers, it is highly necessary to develop rapid detection methods for the adulteration of LRS in the lotus rhizome processing industry.
Many techniques have been applied to the detection of adulteration in LRS. For example, Fourier transform mid infrared (FT-MIR) and partial least squares (PLS) can be combined to identify the adulteration of LRS with potato or maize starch, as well as for quantitative studies of LRS[Citation5,Citation6] Based on the difference in gelatinization endothermic peak between LRS and other starches, a differential scanning calorimetry (DSC)method was developed to qualitatively and quantitatively detect the cassava and sweet potato starch adulterated in LRS products.[Citation7] Currently, the gold standard method is often used for the objective observation of the microscopic morphological characteristics of starch.[Citation8] However, in addition to the typical rod-like structure, there are some small LRS granules in other shapes such as spheres.[Citation9] These LRS granules are very similar to potato starch granules in microstructure, which are difficult to be distinguished and may cause the risk of false detection. Chemical-based colorimetric detection is a low-cost, rapid, and simple method for the specific detection of different types of target molecules in biological, environmental and food samples, which has been extensively employed in microfluidic paper-based analytical devices (μPAD) and multiplex optical bioassays (MOBAs) technology.[Citation10,Citation11] An inexpensive paper device has also been developed by Cardoso and his coworkers for the determination of adulterant such as sugar-based artificial dyes in whiskey.[Citation12] Besides, the above detection methods are rather complex and require highly professional equipment and technicians. Therefore, it is urgent to develop a detection method for the simple and rapid detection of the presence or degree of adulteration in LRS.
Lotus rhizome contains abundant polyphenols including gallic acid, caffeic acid, coumaric, rutin, gallic catechin, catechin, epicatechin, chlorogenic acid and resveratrol.[Citation13] Polyphenols can chemically react with iron ions and show certain colors, mainly through the chelation of ferrous or ferric ions with electron-rich polyphenol hydroxyl groups to result in blue or black products due to charge transfer.[Citation14] In this study, the color reaction between the polyphenols in LRS and ferrous sulfate (FS) was carried out, which generated a blue color. Therefore, the blue color reaction between LRS and FS was proposed as the method for detecting adulteration in LRS. Besides, the detection conditions were optimized as well. The proposed method is simple, effective and efficient in detecting adulteration in LRS, providing a technical basis for the better development of LRS production industry.[Citation15]
Materials and methods
Chemicals and materials
Standard chemicals including (-)-gallocatechin (GC) and (+)-catechin were purchased from Yuanye Bio-technology Co., Ltd (Shanghai, China). HPLC grade solvents including formic acid, methanol and acetonitrile were purchased from Aladdin Industrial Co. Ltd (Shanghai, China). Lotus rhizome (Nelumbo nucifera Gaertn.) was harvested (November, 2020) from Wuhan City, Hubei province, China (Cultivar: Elian No. 5). The samples were used to prepare LRS to be used in this work. Water chestnut (Eleocharis dulcis Trin.) starch was processed from fresh water chestnut purchased in Wuhan in November 2020. Starches of mung bean, corn, wheat, glutinous rice, sweet potato, potato, cassava, pueraria lobata, buckwheat, and commercial LRS I, II, III and IV (CLRS I, CLRS II, CLRS III and CLRS IV) were collected from the local supermarket.
Preparation of starches and lotus rhizome juice
Native starches were prepared with the previously described method[Citation16] with minor modifications. Specifically, lotus rhizome and water chestnut were washed and brushed immediately. After brushing, the samples were cut into small pieces and homogenized with water in a household blender. The slurry was filtered through gauze to amass the residue while collecting the filtrate in a glass beaker. The residue left on the gauze was washed with distilled water three times for the release of starch granules from the fibers, and then the residue was discarded. The extract was filtered with 100-mesh sieves. The beakers containing the filtrate were kept undisturbed to settle the starch naturally, and the supernatant was then decanted off. The precipitate was dried at a constant temperature of 40°C in an electric blast drying oven. The samples were then crushed and filtered with 100-mesh sieves to obtain LRS and water chestnut starch. Lotus rhizomes were washed and brushed immediately. After brushing, they were cut into small pieces and homogenized with water in a household blender. After centrifugation at 10000 rpm for 7 min, the starch was completely removed by filtration to obtain the supernatant, which was lotus rhizome juice (LRJ).
Extraction of polyphenols
Polyphenols were extracted from LRS according to the method described in literature[Citation17] with minor modifications. Briefly, 5.0 g LRS was evenly mixed with 50 mL of 70% ethanol solution. Then, ultrasound-assisted extraction (UAE) was performed under the conditions of 360 W, 40 min and 40°C. The mixture was centrifuged at 6000 rpm for 10 min. The supernatant was decanted and retained, and the residue was extracted for further two times. The three extract supernatants were combined and evaporated under vacuum at 40°C on a rotary evaporator to remove the ethanol solution. The residue was dissolved in 5 mL of 80% aqueous methanol and stored at – 20°C prior to analysis. The LRJ was extracted three times with the mixed solution of anhydrous ether and ethyl acetate (v/v, 1/1). The three extract supernatants were combined and evaporated under vacuum at 40°C on a rotary evaporator. The solid was dissolved in 5 mL of 80% aqueous methanol and then stored at – 20°C prior to analysis.
Identification of polyphenol compounds
Polyphenols extracted from LRS were identified by using the method reported previously[Citation18] with minor modifications. The analysis of polyphenol compounds in the LRS and LRJ by HPLC-ESI-QTOF-MS/MS was carried out using a High-Performance Liquid Chromatography system (Agilent Technologies, SGP) with a photo diode array (PDA) detector coupled to an Agilent G6520B quadrupole time-of-flight (Q-TOF) micro-mass spectrometer, fitted with an electrospray ionization (ESI) source acting on negative mode. The Agilent Eclipse Plus C18 column (4.6 mm × 250 mm, 5 μm particle size; Agilent Technologies Co. Ltd., USA) was maintained at 30°C. The injection volume was 10 μL, and the elution was completed in 75 min with a flow rate of 0.3 mL/min. Solvents A (0.4% formic acid) and B (acetonitrile) were used in the following gradients: 0–40 min (95%–75% A), 40–50 min (75%–50% A), 50–55 min (50%–30% A), 55–56 min (30%–10% A), 56–62 min (10% A), 62–70 min (10%–95% A), 70–75 min (95% A).
UV-vis spectroscopy
GC and catechin standard chemical solution (0.01 mol/L, colorless) were mixed with ferrous sulfate (FS) solution (0.01 mol/L, colorless) to obtain the polyphenol-iron solution. The absorbance of each sample was scanned (200–800 nm) using a spectrophotometer (Shimadzu Corporation uv-1800, Suzhou, China) after 10 min of incubation. Each sample was run in triplicate using a deionized water reference. The spectrophotometer was calibrated using a calibration cell supplied by the manufacturer.
Establishment of the adulteration detection method of LRS
Effects of Fe(II) and Fe (III) on the color development of LRS: About 1 g of LRS was weighed and put into the test tube, followed by the addition of 4 mL 0.01 mol/L FS solution, ferrous chloride solution, ferric chloride solution and ferric sulfate solution, respectively. The mixture was fully shaken and kept for stratification. The color of the sediment was recorded by a Canon EOS 6D digital camera (aperture value: f/10, exposure time: 1/125 s, ISO speed: ISO-100) to screen the best color developer.
Optimization of FS concentration: About 1 g of LRS was weighed and put into the test tube, followed by the addition of 4 mL of 0.1, 0.01, 0.001 and 0.0001 mol/L FS solution, respectively. The mixture was fully shaken and kept for stratification, and the color of the sediment was recorded by a camera.
Analysis of other influencing factors for the detection method: About 1 g of LRS was weighed and put into the test tube. The 0.01 mol/L FS solutions with the pH of 1, 2, 3, 4, 5 and 6 were prepared with HCl (0.1 mol/L) and NaOH (0.1 mol/L). Each of the FS solutions (4 mL) was added to the tube, and the mixture was then shaken evenly, left to stand for layering, photographed and recorded with color development. Besides, the 0.01 mol/L FS solution was added with 1% ascorbic acid solution and 0.1 mol/L EDTA-2Na solution, respectively, and the color development was recorded. The LRS produced in 2018, 2019 and 2020 was ground and used for color development with 0.01 mol/L FS solution. Photographs were taken to record the color development.
Specificity evaluation of the established method: About 1 g of each of mung bean, maize, wheat, glutinous rice, sweet potato, potato, cassava, kudzu, buckwheat and water chestnut starches was reacted with 0.01 mol/L FS solution, respectively. The mixture was fully shaken and kept for stratification, and the color of the sediment was recorded by a camera. Then, mung bean, maize, wheat, glutinous rice, sweet potato, potato, cassava, kudzu, buckwheat and water chestnut starches were respectively used to mix with LRJ at the ratio of 1:10 (w/w) and the temperature of 25°C for 20 min. After that, the starches were collected after centrifugation at 10000 rpm for 8 min, and the wet starch cake was washed with water for three times. The precipitate was dried at a constant temperature of 40°C in an oven. The obtained starches were regarded as polyphenol-rich starches, which were then used for color development test with FS.
Adulteration detection of commercial lotus rhizome starch: Home-made LRS, CLRS I, CLRS II, CLRS III and CLRS IV were passed through a 100-mesh standard sieve, and about 1 g of each starch was reacted with 4 mL water and 0.01 mol/L FS solution, respectively. The mixture was fully shaken and kept for stratification, and the color of the sediment was recorded by a camera. Furthermore, home-made LRS, CLRS I, CLRS II, CLRS III and CLRS IV were uniformly dispersed into a suspension with water at the ratio of 1:40 (w), and the granule morphology was observed with a biological microscope, which is the gold standard method for LRS test.
Statistical analysis
All data were presented as mean values of triplicates. All photos were repeated three times. All figures were drawn by Origin 2018.
Results and discussion
Identification of polyphenols in LRS and LRJ
Starch interacts with polyphenols through hydrogen bonding, hydrophobic interaction and electrostatic and ionic interactions.[Citation19] To study the phenolic profiles, phenolic compounds in LRS and LRJ were identified and characterized via comparison of their HPLC-Q-TOF-MS/MS dissociation patterns, UV spectral characteristics and retention time (RT) with those of authentic standards or published data. Two phenolic compounds were detected and identified in LRS and LRJ ( and ). Peak 1 had an [M-H] – with m/z 305.0667 (LRS) or 305.0659 (LRJ) (C15H14O7, RT = 8.42/8.90 min) and was identified as GC by comparing the RT and accurate mass spectra with those of authentic standards and UV spectrum data (λmax = 271.0 nm). Peak 2 had an [M-H] – with m/z 289.0726 (LRS) or 289.0710 (LRJ) (C15H14O6, RT = 16.05/16.16 min) and was identified as (+)-Catechin by comparing the RT and accurate mass spectra with those of authentic standards and UV spectrum data (λmax = 279.3 nm).[Citation20,Citation21] However, a peak (13.0825 min) in the LRS chromatogram was not assigned to any specific substance, which needs further exploration.
Table 1. Main polyphenols identified in LRS and LRJ by HPLC-QTOF-MS in the negative ionization mode
Figure 1. DAD chromatogram at 280 nm (A) and total ion chromatogram (B) of LRS in the negative ion mode; DAD chromatogram at 280 nm (C) and total ion chromatogram (D) of LRJ in the negative ion mode.
Analysis of chromogenic substances
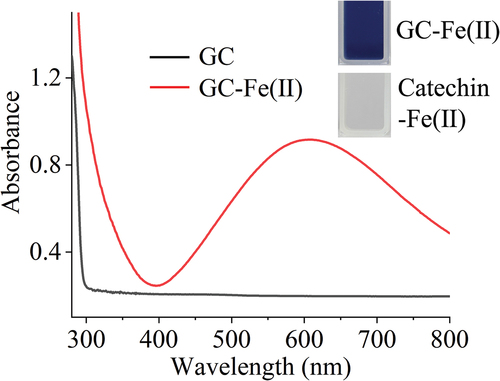
shows that the solution obviously turned to blue when GC reacted with FS, and the resultant GC-Fe(II) complex had an absorption peak at 601 nm, but the product from the reaction of catechin and FS was colorless. It has been reported that ferric ions can combine with two or three gallic acid ligands to form a blue-violet complex under slightly acidic (pH 5–5.6) conditions.[Citation22,Citation23]
Figure 2. UV spectra of GC and GC-Fe (II) complex. Insert shows the solution of GC-Fe(II) and catechin-Fe(II) complex.
Effects of different ferric ions on the color development of LRS
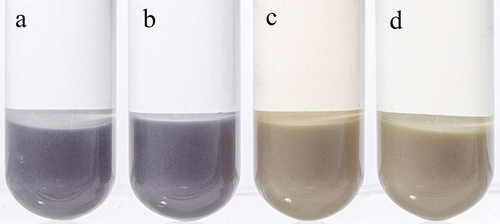
The catechol or gallic acyl groups in polyphenol compounds provide binding sites for metal ion chelation to form blue purple complexes.[Citation24,Citation25] The starch exhibited a blue color when the LRS was mixed with FS and ferrous chloride solution as shown in , which did not appear after the addition of ferric sulfate solution and ferric chloride solution, and the mixture solution showed a light yellow color of Fe(III) solution itself. Since FS and ferrous chloride exhibited the same color development effect, we selected FS as the color developing agent considering that the price of ferrous chloride is three-fold that of FS (Sinopharm Chemical Reagent Co., Ltd.).
Figure 3. Color development photos of LRS with (A) ferrous sulfate solution, (B) ferrous chloride solution, (C) ferric sulfate solution, and (D) ferric chloride solution.
Effect of ferrous sulfate concentration on the color development
Supplementary Fig. 1 shows that an obvious blue color would appear when FS solution was added at the concentrations of 0.1–0.001 mol/L; however, at the FS concentration of 0.0001 mol/L, the blue color was not obvious and the LRS aqueous solution showed the original pink color (Supplementary Fig. 1D). These results indicated that LRS and FS can have sensitive color reaction. At the FS concentration of 0.01 mol/L, the mixture solution could be stored in the brown reagent bottle for a long time and was not easily oxidized. Therefore, the FS concentration of 0.01 mol/L was chosen for further study.
Evaluation of the influencing factors of the established method
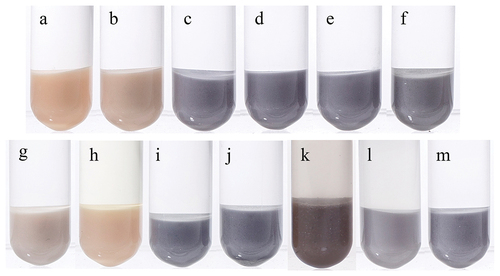
The existing state of iron ions will change with variations in pH, oxidation and reducing agent in the solution.[Citation26] The pH of the FS solution at the concentration of 0.01 mol/L was determined to be 4.1. Color reaction completely disappeared when the pH was decreased to 2 (), which resulted in the original pink color of LRS. These results indicate that an acidic environment will inhibit the color reaction between FS and LRS. The colored LRS at other pH remained blue after being placed at room temperature (25°C) for 1 day, suggesting the stability of this method for color reaction. Ligands with stronger binding capacities can weaken the coordination between iron and polyphenols, and affect the color reaction between iron ions and LRS.[Citation27,Citation28] As shown in , the blue color disappeared after the addition of metal ion-chelating reagents (such as EDTA-2Na), indicating that the chelating agent chelates with the iron ions bound to LRS, resulting in the disappearance of blue color. Besides, the addition of ascorbic acid also led to the disappearance of the blue color (). When the pH of ascorbic acid was adjusted to 5 with 10% Na2CO3, there was still no development of color, indicating that the color development requires the oxidation of Fe (II). The stability constant for the binding of polyphenols with Fe(III) is several orders of magnitude larger than that with Fe(II). Therefore, upon the complexation of iron ions and polyphenols, Fe(II) will be spontaneously oxidized to Fe(III),[Citation29] which also verifies that an acidic environment inhibits the color development of LRS by preventing the oxidation of Fe(II) to Fe(III). During the processing of LRS, supplementary materials such as sugar and maltodextrin are usually added to improve the consumption convenience and flavor of LRS. shows that the addition of these two substances to LRS did not affect the color development with FS. To test the effect of storage time on the color reaction, we added FS solution to LRS produced in different years to observe the color development. shows that when the LRS produced in 2018 was reacted with FS solution, the mixture showed no blue color, possibly due to the serious oxidation of polyphenols in the LRS. For the LRS produced in 2019, a slight blue color was observed in the mixture solution. For the LRS produced in 2020, the mixture solution showed an obvious blue color. Therefore, this method can also be used to distinguish LRS samples produced in different years.
Figure 4. Color development of FS solution and LRS under different conditions. The pH of the FS solution was 1 (A), 2 (B), 3 (C), 4 (D), 5 (E) and 6 (F). Effects of ascorbic acid (G), EDTA-2Na (H), maltodextrin (I) and sucrose (J) on the color development system. Color development of LRS produced in different years with FS solution: 2018 (K), 2019 (L) and 2020 (M).
Chromogenic reaction of different starches with FS
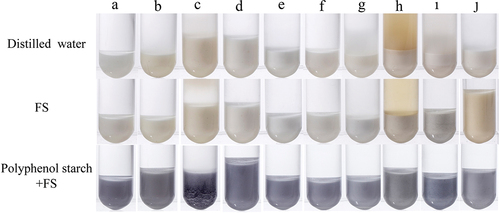
shows that all other starches except for LRS generally showed no blue color after the addition of FS solution or water. The addition of water or FS solution turned the supernatant of pueraria starch into a brown color (), which may be ascribed to the oxidation of isoflavones such as puerarin.[Citation30] Therefore, the data in indicate that the color development with FS can effectively distinguish LRS from other starches. When different starches were soaked in LRJ, the obtained polyphenol-rich starches could react with FS and develop a blue color, indicating that the starches used in this work can adsorb polyphenols from LRJ, and the polyphenols cannot be washed away just by distilled water. The hydroxyl and carbonyl groups in polyphenols can interact with the hydroxyl groups in starch molecules, and induce the aggregation of starch molecules through hydrogen bonding and van der Waals force.[Citation31] The polyphenols in LRJ may also be adsorbed to the starch in the process of production and processing, so as to affect the gelatinization, rheology and retrogradation properties of starches, which may expand the application of LRJ in the future.
Figure 5. Color photos of 10 starches. The colors of Mung bean starch (A), maize starch (B), wheat starch (C), glutinous rice starch (D), sweet potato starch (E), potato starch (F), cassava starch (G), kudzu starch (H), buckwheat starch (I) and water chestnut starch (J) dissolved in distilled water are presented in the first row. The colors of the mixture of starches and FS are presented in the second row. The colors of the mixture of polyphenol-rich starches and FS are presented in the third row.
Application of the method for adulteration detection in simulated LRS
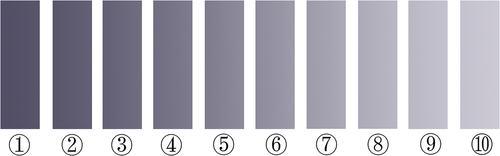
shows that with increasing proportion of maize starch or cassava starch adulterated in LRS, the blue color gradually became lighter. When maize starch or cassava starch was adulterated in LRS at the ratio of 6:4, the change in blue color was obvious. Since the pure LRS content in many adulterated LRS in the market is only 5%–29%,[Citation32] this semi-quantitative method can be used for rapid field inspection of LRS adulteration.The partial least squares class model (PLSCM) could detect LRS samples mixed with 5% (w/w) or more other cheaper starches.[Citation6] Another method for detecting adulteration of LRS by particle size determination of mixed starch has a detection limit of 15%.[Citation33] Although both the methods have lower detection limits than the semi-quantitative method proposed in this paper, the assay in this study can be applied to non-researchers and can meet the market demand. According to the color developing photos, a colorimetric card was made and shown in . The proportion of adulterated other starches that corresponds to each color band in the color card is ①0 ②10% ③20% ④30% ⑤40% ⑥50% ⑦60% ⑧70% ⑨80% ⑩90%
Figure 6. Colorimetric card based on the color development of LRS and FS.
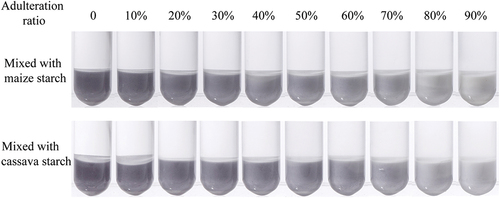
Figure 7. Colorimetric card.
Application of the method for adulteration detection in real LRS samples
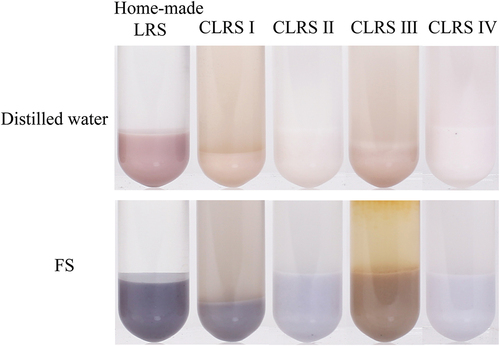
shows that the reaction between CLRS I and FS solution resulted in a blue color. The content of LRS ranged from 70% to 80% according to the colorimetric card in . However, due to the presence of a large amount of water-soluble substances (white sugar) in CLRS I, the starch precipitate after dissolution in water became only half that of CLRS I in volume, possibly due to the dissolution of white sugar; CLRS II and IV showed a light blue color after the addition of the FS solution, and the content of LRS was lower than 30% as calculated from the color card. CLRS III showed a yellow color after the addition of FS solution, which is similar to the reaction between pueraria starch and FS solution (). Hence, CLRS III may be LRS mixed with pueraria starch or aged LRS ().
Figure 8. Photos of the color before (upper) and after (lower) reaction with FS.
The granules of LRS are larger in size and mostly of a long-rod shape.[Citation16] Supplementary Fig. 2 shows that native LRS granules are of a typical rod structure, with some small round or irregular shapes.[Citation9] There were also a large number of rod-shaped starch granules in CLRS I, which is consistent with the color development results. CLRS I is composed of 50% LRS and 50% white sugar, and is thus classified into instant LRS according to National Food Safety Standard (GB/T 25733). There were only very few rod-shaped starch granules in CLRS II and almost no rod-shaped starch granules in CLRS IV, which is also consistent with the color development results. There were numerous broken starch granules in CLRS III. This may also be the reason for the yellow color because CLRS III might be aged LRS, which would not generate an obvious blue color. In general, the results of the four CLRS indicated that the established method can clearly distinguish the quality of LRS.
Conclusion
In this study, 0.01 mol/L FS solution was selected as the color developer to react with a variety of edible starches. It was found that only LRS can react with the FS solution to show a blue color, which can be taken as a characteristic indicator. LRS adulterated at different proportions showed an obvious color gradient when reacting with FS solution. A colorimetric card can be made to accurately detect the adulteration of four commercial LRS. GC was identified as the color-developing polyphenol in LRS. This novel adulteration detection method overcomes the shortcomings of the existing methods such as the requirement of professional equipment and technicians and low detection efficiency, and can achieve field, fast, accurate and low-cost detection of LRS adulteration.
Data availability
The datasets generated during and/or analysed during the current study are available from the corresponding author on reasonable request.
Supplemental Material
Download ()Disclosure statement
No potential conflict of interest was reported by the author(s).
Supplementary material
Supplemental data for this article can be accessed online at https://doi.org/10.1080/10942912.2022.2074035.
Additional information
Funding
References
- Man, J.; Cai, J.; Cai, C.; Xu, B.; Huai, H.; Wei, C. Comparison of Physicochemical Properties of Starches from Seed and Rhizome of Lotus. Carbohydr. Polym. 2012, 88(2), 676–683. DOI: 10.1016/j.carbpol.2012.01.016.
- Bao, N.; Wang, D.; Fu, X.; Xie, H.; Gao, G.; Luo, Z. Green Extraction of Phenolic Compounds from Lotus Seedpod (Receptaculum Nelumbinis) Assisted by Ultrasound Coupled with Glycerol. Foods. 2021, 10(2). DOI: 10.3390/foods10020239.
- Pei, H.; Su, W.; Gui, M.; Dou, M.; Zhang, Y.; Wang, C.; Lu, D. Comparative Analysis of Chemical Constituents in Different Parts of Lotus by UPLC and QToF-MS. Molecules. 2021, 26(7), 1855. DOI: 10.3390/molecules26071855.
- Min, Y.; Chen, Z.; Zhong, G.; Chen, L.; Wang, C. Processing Properties of Lotus Starch. Trans. Chin. Soc. Agric. Eng. 2007, 23(1), 259–263. DOI: 10.3321/j.1002-6819.2007.01.051.
- Liu, J.; Wen, Y.; Dong, N.; Lai, C.; Zhao, G. Authentication of Lotus Root Powder Adulterated with Potato Starch And/or Sweet Potato Starch Using Fourier Transform Mid-infrared Spectroscopy. Food Chem. 2013, 141(3), 3103–3109. DOI: 10.1016/j.foodchem.2013.05.155.
- Xu, L.; Shi, P. T.; Ye, Z. H.; Yan, S. M.; Yu, X. P. Rapid Analysis of Adulterations in Chinese Lotus Root Powder (LRP) by Near-infrared (NIR) Spectroscopy Coupled with Chemometric Class Modeling Techniques. Food Chem. 2013, 141(3), 2434–2439. DOI: 10.1016/j.foodchem.2013.05.104.
- Wang, S. Q.; Gao, X.; Lan, Q. F.; Li, L.; Wang, L. L.; Yang, Y. L.; Sun, H. B.; Yang, J. J.; Ren, H. Y.; Cao, H. Detection of Cassava and Sweet Potato Starch in Adulterated Lotus Root Starch by Differential Scanning Calorimetry. Sci. Technol. Food Industry. 2015, 036, 325–328. DOI:10.13386/j.1002-0306.2015.13.059.
- Qin, Z.; Xu, R.; Wang, Q.; Zheng, L. Study on Properties of Lotus Root Starch Granule and Identification of Oufen Products. Food. Ferment. Ind. 2005, 31(1), 136–138. DOI: 10.1007/s11769-005-0030-x.
- Lin, L.; Huang, J.; Zhao, L.; Wang, J.; Wang, Z.; Wei, C. Effect of Granule Size on the Properties of Lotus Rhizome C-type Starch. Carbohydr. Polym. 2015, 134, 448–457. DOI: 10.1016/j.carbpol.2015.08.026.
- Nilghaz, A.; Mousavi, S. M.; Li, M. S.; Tian, J. F.; Cao, R.; Wang, X. G. Paper-based Microfluidics for Food Safety and Quality Analysis. Trends Food Sci. Technol. 2021, 118, 273–284. DOI: 10.1016/j.tifs.2021.08.029.
- Guan, T.; Xu, Z.; Wang, J.; Liu, Y.; Shen, X.; Li, X.; Sun, Y.; Lei, H. Multiplex Optical Bioassays for Food Safety Analysis: Toward On-site Detection. Compr. Rev. Food Sci. Food Saf. 2022, 21(2), 1627–1656. DOI: 10.1111/1541-4337.12914.
- Cardoso, T.; Channon, R. B.; Adkins, J. A.; Talhavini, M.; Coltro, W.; Henry, C. S. A Paper-based Colorimetric Spot Test for the Identification of Adulterated Whiskeys. Chem. Commun. 2017, 56, 7957. DOI: 10.1039/c7cc02271a.
- Yi, Y.; Sun, J.; Xie, J.; Min, T.; Wang, L. M.; Wang, H. X. Phenolic Profiles and Antioxidant Activity of Lotus Root Varieties. Molecules. 2016, 21(7), 863. DOI: 10.3390/molecules21070863.
- Bertleff-Zieschang, N.; Rahim, M. A.; Ju, Y.; Braunger, J. A.; Suma, T.; Dai, Y.; Pan, S.; Cavalieri, F.; Caruso, F. Biofunctional Metal–phenolic Films from Dietary Flavonoids. Chem. Commun. 2017, 53(6), 1068–1071. DOI: 10.1039/c6cc08607a.
- Ganguly, S.; Mantha, S.; Panda, K.; Mukhopadhyay, P. Simultaneous Determination of Black Tea-derived Catechins and Theaflavins in Tissues of Tea Consuming Animals Using Ultra-Performance Liquid-chromatography Tandem Mass Spectrometry. PLoS ONE. 2016, 11(10), e0163498. DOI: 10.1371/journal.pone.0163498.
- Yu, H.; Cheng, L.; Yin, J.; Yan, S.; Liu, K.; Zhang, F.; Xu, B.; Li, L. Structure and Physicochemical Properties of Starches in Lotus (Nelumbo Nucifera Gaertn.) Rhizome. Food Sci. Nutr. 2013, 1(4), 273–283. DOI: 10.1002/fsn3.37.
- Lee, D.-B.; Kim, D.-H.; Je, J.-Y. Antioxidant and Cytoprotective Effects of Lotus (Nelumbo Nucifera) Leaves Phenolic Fraction. Preventive Nutr. Food Sci. 2015, 20(1), 22–28. DOI: 10.3746/pnf.2015.20.1.22.
- Lv, Q.; Luo, F.; Zhao, X.; Liu, Y.; Hu, G.; Sun, C.; Li, X.; Chen, K. Identification of Proanthocyanidins from Litchi (Litchi Chinensis Sonn.) Pulp by LC-ESI-Q-TOF-MS and Their Antioxidant Activity. PLoS ONE. 2015, 10(3), e0120480. DOI: 10.1371/journal.pone.0120480.
- Zhu, F. Interactions between Starch and Phenolic Compound. Trends Food Sci. Technol 43, 2, 129–143). Elsevier Ltd. 2015. DOI:10.1016/j.tifs.2015.02.003.
- Deng, J. et al . (2021). Identification and Quantification of Free, Esterified, and Insoluble-Bound Phenolics in Grains of Hulless Barley Varieties and Their Antioxidant Activities. Lwt, 151 112001 10.1016/j.lwt.2021.112001
- Li, Y.-F.; Ouyang, S.-H.; Chang, Y.-Q.; Wang, T.-M.; Li, W.-X.; Tian, H.-Y.; Cao, H.; Kurihara, H.; He, -R.-R. A Comparative Analysis of Chemical Compositions in Camellia Sinensis Var. Puanensis Kurihara, A Novel Chinese Tea, by HPLC and UFLC-Q-TOF-MS/MS. Food Chem. 2017, 216, 282–288. DOI: 10.1016/j.foodchem.2016.08.017.
- Erdogan, G.; Karadag, R.; Dolen, E. Potentiometrie and Spectrophotometric Determination of the Stability Constants of Quercetin Complexes with Aluminium(III) and Iron(II). Rev. Anal. Chem. 2005, 24(4). DOI: 10.1515/REVAC.2005.24.4.247.
- Perron, N. R.; Brumaghim, J. L. A Review of the Antioxidant Mechanisms of Polyphenol Compounds Related to Iron Binding. Cell Biochem. Biophys. 2009, 53(2), 75–100. DOI: 10.1007/s12013-009-9043-x.
- Andjelković, M.; Vancamp, J.; Demeulenaer, B.; Depaemelaere, G.; Socaciu, C.; Verloo, M.; Verhe, R. Iron-chelation Properties of Phenolic Acids Bearing Catechol and Galloyl Groups. Food Chem. 2006, 98(1), 23–31. DOI: 10.1016/j.foodchem.2005.05.044.
- Perron, N. R.; Wang, H. C.; DeGuire, S. N.; Jenkins, M.; Lawson, M.; Brumaghim, J. L. (2010). Kinetics of Iron Oxidation Upon Polyphenol Binding. Dalton Trans., 39(41), 9982. DOI:10.1039/c0dt00752h
- South, P. K.; Miller, D. D. Iron Binding by Tannic Acid: Selected Ligands. Food Chemistry. 1998, 63, 2. DOI: 10.1016/S0308-8146(98)00040-5
- Dueik, V.; Chen, B. K.; Diosady, L. L. Iron-polyphenol Interaction Reduces Iron Bioavailability in Fortified Tea: Competing Complexation to Ensure Iron Bioavailability. J. Food Qual. 2017, 2017, 1–7. DOI: 10.1155/2017/1805047.
- Habeych, E.; van Kogelenberg, V.; Sagalowicz, L.; Michel, M.; Galaffu, N. Strategies to Limit Colour Changes When Fortifying Food Products with Iron. Food Res. Int. 2016, 88, 122–128. DOI: 10.1016/j.foodres.2016.05.017.
- Mellican, R. I.; Li, J.; Mehansho, H.; Nielsen, S. S. The Role of Iron and the Factors Affecting Off-color Development of Polyphenols. J. Agric. Food Chem. 2003, 51(8), 2304–2316. DOI: 10.1021/jf020681c.
- Zhang, Y. N.; Zhu, S. J.; Li, N.; Jing, Y. N.; Yue, X. F. Screening and Identification of the Active Components from Puerariae Radix by HUVEC/CMC-LC-MS2. J Chromatogr B: Anal. Technol. Biomed. Life Sci. 2019, 1132. DOI: 10.1016/j.jchromb.2019.121825.
- Chai, Y.; Wang, M.; Zhang, G. Interaction between Amylose and Tea Polyphenols Modulates the Postprandial Glycemic Response to High-amylose Maize Starch. J. Agric. Food Chem. 2013, 61(36), 8608–8615. DOI: 10.1021/jf402821r.
- Hu, X.; Lin, C.; Lin, Z. Study on the Identification of Real and Fake Lotus Root Starch. Jiangsu Condiment Subsidiary Food. 2010, 276, 1–3. DOI:10.16782/j.cnki.32-1235/ts.2010.06.001.
- Chang, Y. C.; Hu, H. Y.; Ren, S. C. Study on Particle Characteristics and Adulteration Detection of Edible Starches. J. Henan Univ. Technol. 2019, 40, 45–52. DOI: 10.16433/j.cnki.1673-2383.2019.05.008.