
ABSTRACT
Blueberries are particularly rich in anthocyanins and are favored extensively for their health benefits. In this study, the anthocyanin profiles of fruits of four blueberry cultivars (Gardenblue, Legacy, Misty, and Brightwell) were investigated. Total anthocyanin content gradually increased in all four cultivars during development, but mature fruits of Brightwell and Gardenblue had a higher anthocyanin content than those of Legacy and Misty. Thirty-two kinds of anthocyanins were quantified using UPLC-ESI-MS/MS. Principal component analysis showed that the anthocyanin profiles of Gardenblue and Legacy were similar to those of Misty and Brightwell, respectively. Levels of malvidin 3-O-galactoside, malvidin 3-O-glucoside, malvidin 3-O-rutinoside, delphinidin 3-O-glucoside, delphinidin 3,5-O-diglucoside(delphin), petunidin 3-O-glucoside, and petunidin 3-O-rutinoside in mature fruits of Gardenblue were higher than those in the other three cultivars. The content of delphinidin 3-O-(6”-O-malonyl)-beta-D-glucoside, petunidin 3-O-(6-O-malonyl-beta-D-glucoside), petunidin 3-O-arabinoside, delphinidin 3-O-arabinoside, and delphinidin 3-O-galactoside was the highest in mature fruits of Misty. Levels of petunidin 3,5-diglucoside and petunidin 3-O-galactoside in mature fruits of Brightwell were higher than those in the other three cultivars. Quantitative real-time reverse transcription-polymerase chain reaction analysis showed that ANS, F3ʹ5’H, and UFGT were preferentially expressed in fruits of Gardenblue, possibly attributing to higher levels of delphinidin 3-O-glucoside and delphinidin 3,5-O-diglucoside (delphin) in this cultivar. This study adds to our knowledge of anthocyanin content and profiles in the four important blueberry cultivars grown in China.
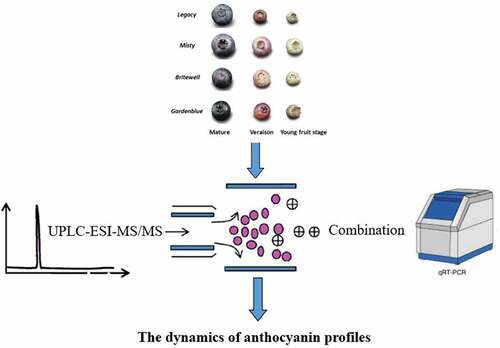
Graphical abstract
Introduction
Blueberry (Vaccinium sp.) is one of the most popular fruits in North America and is rich in anthocyanins. As a functional food and dietary supplement, it has gradually become a part of the daily diet.[Citation1] Its anthocyanin content contributes to beneficial effects against several oxidative stress-related diseases, including cardiovascular disorders, neurodegenerative diseases, diabetes, and cancer. [Citation1–3] Increased research in diets has gained the attention of the scientific community owing to their crucial role in health, as well as in disease treatment and prevention. Therefore, the anthocyanin profiles of blueberry are worthy of further research.
There are abundant wild blueberry relatives in China including Vaccinium uliginosum in northeast China, V. bracteatum in southwest China, and V. in Jiangnan. At present, the three main species of cultivated blueberry in China are V. angustifolium, V. ashei, and V. corymbosum. [Citation4] Previous studies have demonstrated that anthocyanin accumulation is mainly related to an interaction between the cultivar and climate.[Citation5] Guizhou Province is the most important blueberry growing region in China. Compared to similar latitudes in the world, the Yangtze River basin in the south of China does not experience severe cold in winter and has abundant rainfall, sufficient light and heat, four distinct seasons, and a large area of acidic soil.[Citation6] These natural resources are similar to those in the blueberry cultivation areas in the Middle East and the south of the United States.[Citation7] Therefore, Guizhou has unique advantages and prospects for the cultivation of blueberry in China. Current research on blueberry in Guizhou has mainly focused on the extraction, isolation, identification, and antioxidant analyses of anthocyanins.[Citation8–10] However, due to limitations such as low separation efficiency, low-resolution mass spectrometry, and an incomplete database, some major anthocyanins could not be identified.[Citation11] The application of UPLC-HR-ESI-MS (Ultra High Liquid Chromatography-High Resolution-Electron Spray Ionization-Mass Spectrometry) was shown to not only improve the separation of anthocyanins but also identify anthocyanins more accurately.[Citation12] In addition, UPLC-HR-ESI-MS can be used for accurate qualitative and quantitative analyses.
Metabonomics also plays an important role in improving crop yield and food quality. [Citation13,Citation14] The metabonomic analysis is used to detect and screen metabolites with important biological significance and provides statistically significant differences between biological samples. The metabonomic analysis includes two parts: metabonomic experiments and data analysis. Data analysis includes differential metabolite screening and metabolic pathway analysis. Based on the metabonomic data obtained from experiments, sample collection and processing, metabolite extraction, and metabolite detection and analysis, we can identify metabolites and analyze the quality of sample data, and screen out different metabolites to predict and analyze the function of metabolites in samples. Previous studies have shown that the application of metabonomics in the study of anthocyanin biosynthesis has produced useful results.[Citation15,Citation16] Color is also an important external quality parameter of blueberries, and anthocyanins are the major color pigments of the fruit. Therefore, the application of metabonomics in blueberry anthocyanin research would be beneficial for breeding to improve the fruit color and fruit quality of blueberry. Such knowledge will be very important to lay the foundation for blueberry industrialization in China.[Citation17]
Therefore, this study aimed to analyze the composition of anthocyanins in blueberries cultivated in Majiang, Guizhou, at different growth stages, and explore the biosynthesis of anthocyanins to thoroughly analyze the composition and variety of blueberry anthocyanins in Guizhou using UPLC-HR-ESI-MS and metabonomics.
Materials and methods
Chemicals and reagents
HPLC-grade acetonitrile (ACN) and methanol (MeOH) were purchased from Merck (Darmstadt, Germany). Milli-Q water (Millipore, Bradford, USA) was used for all experiments. All standards were purchased from Olchemim Ltd. (Olomouc, Czech Republic). Hydrochloric acid and formic acid were purchased from Xinyang Chemical Reagent (China). Stock solutions of standards were prepared at a concentration of 1 mg/mL in 50% MeOH and all stock solutions were stored at −20°C. Stock solutions were diluted with 50% MeOH to prepare working solutions for analysis.
Plants and fruit sampling
Four types of blueberry cultivars from two species; V. corymbosum (Legacy, Misty) and V. ashei (Brightwell, Gardenblue) were harvested and transported at 4°C from the Yisheng blueberry base of Qiandongnan Autonomous Prefecture of Guizhou Province (107°43′14″E, 26°22′52″N, Majiang, Guizhou) from March to June 2020. The young fruits were picked 5 days after fruit setting, the color-transition fruits were picked 30 days after fruit setting, and the mature fruits were picked 55 days after fruit setting. The Yishen blueberry base is located in the transition zone from Yunnan Guizhou Plateau to the hilly region of Hunan Guangxi in the east of Guizhou Province. The soil is acidic and yellow. The regions have a subtropical monsoon humid climate with an annual average temperature of 15.7°C, annual average rainfall of 1266 mm, annual sunshine of 1057 h, and a frost-free period of 293 days.
Sample preparation and extraction
The samples were stored at the School of Food and Pharmaceutical Engineering in Guiyang College at −80°C (for a maximum of three months) before use. Fruits were picked at the young fruit stage, color-transition stage, and mature stage, and randomly picked thrice for each stage (). The freeze-dried sample was crushed using a mixer mill (MM 400, Retsch) with zirconia beads for 1.5 min at 30 Hz. Exactly, 50 mg of powder was weighed and extracted with 0.5 ml methanol/water/hydrochloric acid (799:200:1, V/V/V). The extract was vortexed for 10 min and ultrasonicated for 10 min. The extracts were centrifuged at 12,000 r and 4°C for 3 min. The extraction was repeated twice. The supernatants were collected and filtrated (PTFE, 0.22 μm; Anpel) before LC-MS/MS analysis.
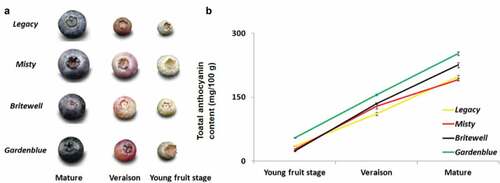
Figure 1. Total anthocyanin content of the fruits of four blueberry cultivars during development A. Young fruits, fruits at veraison and mature fruits of Legacy, Misty, Brightwell and Gardenblue. B. The total anthocyanin content of similar stages of fruit development of Legacy, Misty, Brightwell and Gardenblue. Three biological replications were performed, Means ± SD are shown.
UPLC conditions
The sample extracts were analyzed using a UPLC-ESI-MS/MS system (UPLC, Shim-pack UFLC SHIMADZU CBM30A system). The analytical conditions for UPLC were as follows: column, WatersAC-QUITY BEH C18 (1.7 µm, 2.1 mm*100 mm); solvent system, water (0.1% formic acid):MeOH (0.1% formic acid); gradient program, 95:5 V/V at 0 min, 50:50 V/V at 6 min, 5:95 V/V at 12 min, hold for 2 min, 95:5 V/V at 14 min, hold for 2 min; flow rate, 0.35 mL/min; temperature, 40°C: injection volume, 2 μL. The effluent was alternatively connected to an ESI-triple quadrupole linear ion trap (QTRAP)-MS.
ESI-Q TRAP-MS/MS
LIT and triple quadrupole (QQQ) scans were acquired on a triple quadrupole-linear ion trap mass spectrometer (Q TRAP), API 6500 Q TRAP UPLC/MS/MS System, equipped with an ESI Turbo Ion-Spray interface, operating in positive and negative ion mode and controlled by Analyst 1.6.3 software (AB Sciex,). The ESI source operation parameters were as follows: an ion source, turbo spray; source temperature, 550°C; ion spray voltage, 5500 V (positive ion mode); curtain gas was set at 35 psi; collision gas was high: DP and CE for individual MRM transitions were performed with further DP and CE optimization. A specific set of MRM transitions was monitored for each period, according to the metabolites eluted within that period.
Qualitative and quantitative analysis of metabolites
The material was characterized according to the secondary spectrum information, based on the self-built database MWDB (MetWare database) and the metabolite information public database. Meanwhile, to ensure the accuracy of the qualitative analysis, the isotope signal; the repeated signals of K+, Na+, and NH4+ ions: the repetitive signals of fragment ions comprised of other substances with larger molecular weights, were all removed during the analysis. Metabolite quantification was performed using MRM analysis of QQQ mass spectrometry .[Citation18] In the MRM mode, the quadrupole rod first screens the precursor ions (parent ions) of the target substance and excludes ions corresponding to other substances with different molecular weights to initially eliminate interference. The precursor ions break through the collision chamber to form many fragment ions after ionization, which are filtered by QQQ to select a desired characteristic fragment ion to eliminate non-target ion interference for more accurate and reproducible quantification. Finally, after obtaining the metabolite mass spectrometry data of different samples, the peak area was integrated to reveal the mass spectrum peaks of all the substances, and the mass spectrum peaks of the same metabolites in different samples were integrated and corrected, to ensure the accuracy of the quantification.
Analysis of metabolite differences and metabolic pathways
Differential metabolites were screened by combining the multiple changes of the opls-da model.[Citation19] The screening criteria were as follows: select metabolites with 2 ≤ fold change ≤ 0.5. If the difference in metabolites between the control group and the test group is greater than or less than twice, then the difference is considered to be significant.
De DNA treatment and reverse transcription
RNA sample system: 6.8 μL, DNase 0.4 μL (2 U/μL), 10 x buffer (1 μL) was incubated at 37°C for 30 min and inactivated at 75°C for 10 min. Configuration system on ice bath: template RNA 10 μL, Oligo (dt) Primer (1.0 μL), Radom primer 1.0 μ 50. Centrifuged after mixing, incubated at 65°C for 5 min after centrifugation, and immediately placed in an ice bath for 5 min; Then, 5 × Reaction Buffer (4 μL), 10 mM dNTP Mix (2 μL), RiboLock RNase Inhibitior (20 U/µL) (1.0 µL), and RevertAid M-MuLV RT (200 U/µL) (1.0 µL) were added. The mixture was centrifuged at 25°C for 10 min, 42°C for 60 min, and 70°C for 5 min.
Real-Time PCR
The cDNA obtained by reverse transcription was used as the template and amplified by fluorescence quantitative PCR. The reaction system was 10 µL, in which the cDNA template was 1 µL and the upstream and downstream primers were 0.7 respectively μ 50. SYBR Green master mix 5 µL, and then make up to 10 µL with ddH2O. The reaction conditions were: PCR 95°C for 2 min, 65°C for 5 s, 60°C for 30s, 40 cycles. Finally, qPCR was used for fluorescence quantitative analysis, and the relative expression of each differentially expressed gene was calculated by the ∆∆ CT method. The primers used are shown in .
Table 1. qRT-PCR quantitative primers
Bioinformatics and multivariate analysis
Principal component analysis (PCA) and hierarchical clustering analyses were performed using R (http://www.r-project.org/), as previously described .[Citation20] The variation analysis of total anthocyanin content and gene expression was performed using Student’s t-test.
Results and discussion
Dynamics of total anthocyanin content during fruit development of four blueberry cultivars
The changes in the total anthocyanin content of various growth stages of blueberry fruits from the cultivars Gardenblue, Legacy, Misty, and Brightwell were analyzed ( and ). At the young fruit stage, Misty (C1), Legacy (B1), and Brightwell (D1) were green, and Gardenblue (F1) was red (). The Gardenblue (F2) fruits were rabbit-eye colored, whereas those of Brightwell (D2), Misty (C2), and Legacy (B2) were fuchsia at veraison (). The mature fruits of Gardenblue (F3) and Brightwell (D3) were smaller and darker than those of Legacy (B3) and Misty (C3) (). Throughout development, the total anthocyanin content of Gardenblue was higher than that of Legacy, Misty, and Brightwell (). The young fruits of Legacy, Misty, and Brightwell had a similar anthocyanin content. At veraison, Misty and Brightwell had the same anthocyanin content, which was higher than that of Legacy (). The mature fruits of Legacy and Misty had a similar anthocyanin content, which was lower than that of Brightwell (). Overall, comparing the different growth periods of the same fruit, the anthocyanin content increased significantly with the transition from partially to fully pigmented fruit in all the analyzed cultivars. When comparing the same growth period of the different fruits, Gardenblue had the darkest color and the highest amount of anthocyanin. This is consistent with the results of a previous study.[Citation21]
Table 2. Content changes of anthocyanins monomers of different blueberry at different developmental stages
Dynamics of anthocyanin profiles during fruit development of four blueberry cultivars
Extensive metabolic profiling of anthocyanins during the development of Gardenblue, Legacy, Misty, and Brightwell fruits produced a total of 32 kinds of anthocyanins (), including cyanidin, delphinidin, malvidin, pelargonidin, peonidin, and petunidin. Using UPLC-ESI-MS/MS, combined with a local metabolic database, the anthocyanins that were successfully separated and identified included cyanidin 3-O-(6-O-malonyl-beta-D-glucoside), cyanidin 3-O-arabinoside, cyanidin 3-O-galactoside, cyanidin 3-O-glucoside, cyanidin 3-O-rutinoside, delphinidin 3,5-O-diglucoside, delphinidin 3-O-(6”-O-malonyl)-beta-D-glucoside, delphinidin 3-O-arabinoside, delphinidin 3-O-galactoside, delphinidin 3-O-glucoside, malvidin 3-O-arabinoside, malvidin 3-O-galactoside, malvidin 3-O-glucoside, malvidin 3-O-rutinoside, pelargonidin 3-O-(6-O-malonyl-beta-D-glucoside), pelargonidin 3-O-arabinoside, pelargonidin 3-O-galactoside, pelargonidin 3-O-glucoside, pelargonidin 3-O-rutinoside, pelargonidin 3,5-O-diglucoside, Peonidin 3,5-O-diglucoside, peonidin 3-O-(6-O-malonyl-beta-D-glucoside), peonidin 3-O-glucoside, peonidin 3-O-arabinoside, peonidin 3-O-galactoside, peonidin 3-O-rutinoside, Petunidin 3,5-diglucoside, petunidin 3-O-[6-O-malonyl-beta-D-glucoside), petunidin 3-O-arabinoside, petunidin 3-O-galactoside, petunidin 3-O-glucoside, and petunidin 3-O-rutinoside. In addition, six proanthocyanidins; procyanidin A1, procyanidin A2, procyanidin B1, procyanidin B2, procyanidin B3, and procyanidin C1 were also detected. Compared with previous studies, the structure of anthocyanins detected in this study is richer, which fully shows the diversity of anthocyanins in Guizhou blueberry. Guizhou blueberry will be a good source of anthocyanins and worthy of further study.
Table 3. The statistical of metabolites quantity
At present, several studies have been carried out on the identification of anthocyanins in blueberries.,[Citation22]identified 14 anthocyanins in four blueberry cultivars using a qualitative and quantitative analysis. In the lowbush blueberry, 15 anthocyanin pigments, including delphinidin, malvidin, petunidin, peonidin, and cyanidin, were identified [Citation23] In another study, a total of 17 anthocyanins, including cyanidin, delphinidin, malvidin, peonidin, and petunidin, were identified from highbush blueberries using HPLC-MS/MS analysis.[Citation24] The 32 kinds of anthocyanins successfully separated and identified from the four cultivars in this study add to the diversity of anthocyanins in blueberries from Guizhou.
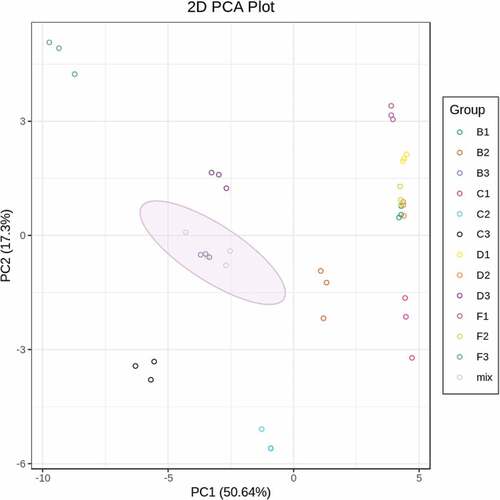
To uncover the variability and overall trend of anthocyanin separation among the samples, PCA was performed. PCA analysis showed that the three biological repetitions of each sample clustered together, which demonstrates that our metabonomic analysis was repeatable and reliable (). Moreover, the PCA showed that the PC1 (50.64%) values of the fruits in the same period were close, although there was great diversity in PC2 (17.3%) (). The PC2 values of Gardenblue, Brightwell, Misty, and Legacy decreased at all three developmental stages (). The above results indicate that the content of anthocyanin metabolites in blueberry fruit changes significantly during fruit development and that the anthocyanin profiles of Gardenblue and Legacy are similar to those of Misty and Brightwell.
Figure 2. Principal component analysis of the level of anthocyanin metabolites identified in young fruits, fruits at veraison and mature fruits of Legacy, Misty, Brightwell and Gardenblue. B1, C1, D1 and F1 represent the young fruits; B2, C2, D2 and F2 represent the fruits at veraison: B3, C3, D3 and F3 represent the mature fruits of the cultivars, respectively.
Differential analysis of anthocyanins in different growth stages of blueberry
Subsequently, the differential anthocyanin metabolites were screened according to the following criteria: fold change ≥ 2 or fold change ≤ 0.5, p ≤ .05. As shown in , 34 significantly different anthocyanins (SDAs, including 32 upregulated and two downregulated) were identified in B1-vs-B2; 34 SDAs (32 upregulated and two downregulated) were identified in C1-vs-C2; 26 SDAs (eight upregulated and 18 downregulated) were identified in D1-vs-D2: 22 SDAs (four upregulated and 18 downregulated) were identified in F1-vs-F2. The number of upregulated anthocyanins in B1-vs-B2 and C1-vs-C2 was much higher than that of D1-vs-D2 and F1-vs-F2, while the opposite was true for the number of down-regulated anthocyanins. Thirty-one SDAs (24 upregulated and seven downregulated) were identified in B2-vs-B3; 25 SDAs (20 upregulated and five downregulated) were identified in C2-vs-C3; 32 SDAs (31 upregulated and two downregulated) were identified in D2-vs-D3: 39 SDAs (31 upregulated and eight downregulated) were identified in F2-vs-F3. Most of the anthocyanins were upregulated between the veraison and mature stages, and the number of upregulated anthocyanins in D2-vs-D3 and F2-vs-F3 was much higher than that of D1-vs-D2 and F1-vs-F2.
Figure 3. The differential anthocyanin metabolites in different group. B1, C1, D1 and F1 represent the young fruits of Legacy, Misty, Brightwell and Gardenblue, respectively; B2, C2, D2 and F2 represent the fruits at veraison; B3, C3, D3 and F3 represent the mature fruits.
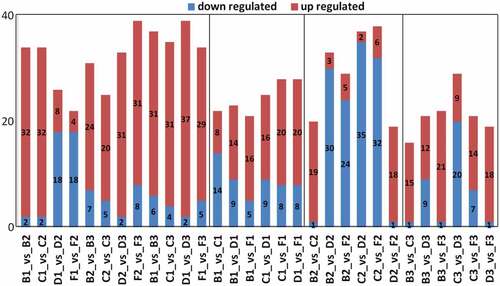
At maturity, 15 upregulated and one downregulated anthocyanins were identified in B3-vs-C3; 12 upregulated and nine downregulated anthocyanins were identified in B3-vs-D3; 21 up-regulated and one downregulated anthocyanins were identified in B3-vs-F3; nine upregulated and 20 downregulated anthocyanins were identified in C3-vs-D3; 14 upregulated and seven downregulated anthocyanins were identified in C3-vs-F3: 18 upregulated and one downregulated anthocyanin were identified in D3-vs-F3 (). The number of upregulated anthocyanins was much higher than that of the downregulated anthocyanins in B3-vs-F3, C3-vs-F3, and D3-vs-F3, indicating that the content of most of the anthocyanins in F3 was higher than that of B3, C3, and D3. This is consistent with the above results.
Analysis of differential delphinidins, malvidins, and petunidins
To demonstrate the overall trend in anthocyanins during the development of the four blueberry cultivar fruits, hierarchical clustering of all anthocyanins was performed and the distance metric for the patterns of anthocyanin levels. As shown in , the content of pelargonidin 3-O-(6-O-malonyl-beta-D-glucoside), petunidin 3-O-rutinoside, petunidin 3-O-arabinoside, petunidin 3-O-galactoside, petunidin 3,5-diglucoside, petunidin 3-O-(6-O-malonyl-beta-D-glucoside), petunidin 3-O-glucoside, delphinidin 3,5-O-diglucoside, delphinidin 3-O-(6”-O-malonyl)-beta-D-glucoside, delphinidin 3-O-arabinoside, delphinidin 3-O-galactoside, delphinidin 3-O-glucoside, malvidin 3-O-arabinoside, malvidin 3-O-galactoside, malvidin 3-O-glucoside, and malvidin 3-O-rutinoside in the fruits of all four cultivars increased during development. These results suggest that the three pigments (delphinidins, malvidins, and petunidins) may be the main color components of the fruits of Gardenblue, Brightwell, Misty, and Legacy. Previous studies have shown that delphinidin shows violet/blue hues, delphinidin has been found in different purple cultivars of blueberry, and color deepening was strongly associated with increased levels of delphinidin.[Citation25,Citation26] Therefore, we infer that delphinidins are the main color components of the fruits of Gardenblue, Brightwell, Misty, and Legacy fruits, and malvidins and petunidins may play a secondary role in the coloring of these cultivars.
Figure 4. A. The hierarchical clustering analysis according to the level of anthocyanin metabolites identified in young fruits, fruits at veraison and mature fruits of Legacy, Misty, Brightwell and Gardenblue. B. The hierarchical clustering analysis according to the level of delphinidins, malvidins and petunidins in mature fruits of Legacy, Misty, Brightwell and Gardenblue. B1, C1, D1 and F1 represent the young fruits; B2, C2, D2 and F2 represent the fruits at veraison: B3, C3, D3 and F3 represent the mature fruits of cultivars, respectively.
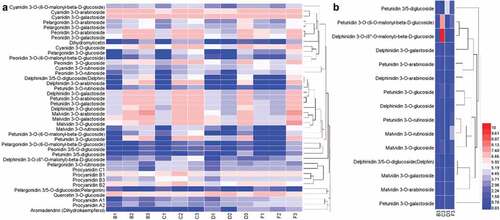
Furthermore, the hierarchical clustering of all delphinidins, malvidins, and petunidins showed that the levels of malvidin 3-O-galactoside, malvidin 3-O-glucoside, malvidin 3-O-rutinoside, delphinidin 3-O-glucoside, delphinidin 3,5-O-diglucoside(delphin), petunidin 3-O-glucoside, and petunidin 3-O-rutinoside were higher in the mature fruits of Gardenblue than those in Brightwell, Misty, and Legacy (). The highest level of delphinidin 3-O-(6”-O-malonyl)-beta-D-glucoside, petunidin 3-O-(6-O-malonyl-beta-D-glucoside), petunidin 3-O-arabinoside, delphinidin 3-O-arabinoside, and delphinidin 3-O-galactoside was found in the mature fruits of Misty (). Brightwell had higher levels of petunidin 3,5-diglucoside and petunidin 3-O-galactoside in its mature fruits than those found in the other three cultivars ().
Expression of genes related to anthocyanins biosynthesis in different growth stages of blueberry
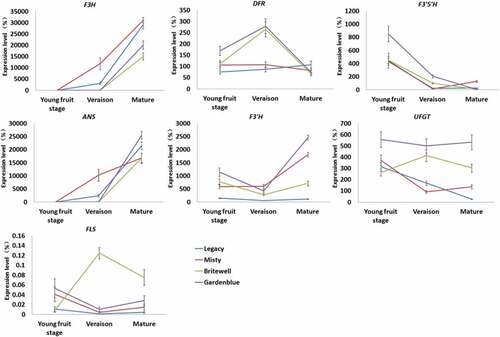
The expression of several genes related to the anthocyanin biosynthetic pathway,[Citation27] including the genes encoding dihydroflavonol 4-reductase (DFR), anthocyanidin synthase (ANS), flavanone 3-hydroxylase (F3H), flavonoid 3’ hydroxylase (F3ʹH), flavonoid 3ʹ5’ hydroxylase (F3ʹ5’H), UDPG-flavonoid glucosyl transferase (UFGT), and flavonol synthase (FLS), was analyzed by quantitative real-time reverse transcription-polymerase chain reaction (qRT-PCR) at different developmental stages of Gardenblue, Brightwell, Misty, and Legacy fruits.
As shown in , the expression level of ANS gradually increased in the fruits of all four cultivars during development. Moreover, the expression level of ANS in mature fruits of Gardenblue was higher than that in Brightwell, Misty, and Legacy (). The transcriptional level of F3H also gradually increased in the fruits of all four cultivars during development (). The transcriptional level of ANS in mature fruits of Misty was higher than that in Brightwell, Gardenblue, and Legacy (). Overall, the transcriptional levels of F3ʹ5’H, DFR, F3ʹH, and UFGT in fruits of Gardenblue were higher than those in Brightwell, Misty, and Legacy during development (). In addition, the transcriptional level of FLS, responsible for the synthesis of flavonol, was higher in fruits of Brightwell than in Gardenblue, Misty, and Legacy during development (). Since F3ʹH and F3ʹ5’H are the primary enzymes responsible for the diversification of anthocyanins,[Citation28] the preferential expression of ANS, F3ʹ5’H, and UFGT was largely responsible for the high levels of delphinidin 3-O-glucoside and delphinidin 3,5-O-diglucoside(delphin) in fruits of Gardenblue. Moreover, the high expression levels of DFR, F3ʹ5’H, F3ʹH, and UFGT may be the main reason for the higher level of malvidin 3-O-galactoside, malvidin 3-O-glucoside, malvidin 3-O-rutinoside, petunidin 3-O-glucoside, and petunidin 3-O-rutinoside in Gardenblue fruit. This is a major finding of our study.
Figure 5. Quantitative RT-PCR analysis of the expressions of F3H, FLS, ANS, DFR, F3ʹ5’H, F3ʹH and UFGT in different development stages of Gardenblue, Brightwell, Misty and Legacy fruits. The relative quantity of the gene transcriptional level was determined according to the internal control (SAND). Three biological replicates were performed. Means ± SE are shown. Gene names are abbreviated as follows: dihydroflavonol 4-reductase (DFR), anthocyanidin synthase (ANS), flavanone 3-hydroxylase (F3H), flavonoid 3’ hydroxylase (F3ʹH), flavonoid 3ʹ5’ hydroxylase (F3ʹ5’H), UDPG-flavonoid glucosyl transferase (UFGT), flavonol synthase (FLS).
Conclusion
To summarize, the anthocyanin profiles of the fruits of four blueberry cultivars (Gardenblue, Legacy, Misty, and Brightwell) were systematically investigated at different developmental stages. Based on metabonomics, a total of 32 kinds of anthocyanins were quantified using UPLC-ESI-MS/MS. The anthocyanin content increased significantly in all four cultivars during development from immature to mature fruits. Gardenblue, which had the darkest color, also had the highest anthocyanin content. Delphinidins were the main color substance found in the fruit of all the cultivars, whereas malvidins and petunidins may play important secondary roles in the color process. Based on qRT-PCR analysis of several genes related to the anthocyanin biosynthetic pathway, F3ʹH and F3ʹ5’H are the primary enzymes responsible for the diversification of anthocyanins. The preferential expression of ANS, F3ʹ5’H, and UFGT was largely responsible for the high levels of delphinidin 3-O-glucoside and delphinidin 3,5-O-diglucoside (delphin) in the fruits of Gardenblue. Moreover, the higher expression of DFR, F3ʹ5’H, F3ʹH, and UFGT may be the main reason for the higher level of malvidin 3-O-galactoside, malvidin 3-O-glucoside, malvidin 3-O-rutinoside, petunidin 3-O-glucoside, and petunidin 3-O-rutinoside in the fruits of Gardenblue. Manipulation of these structural genes may be a mechanism to improve the sensory quality of blueberries through the selective expression of color by controlling the accumulation of anthocyanins.
Highlights
Anthocyanin profiles of fruits of four blueberry cultivars were investigated
Thirty three kinds of anthocyanins were quantified using UPLC-ESI-MS/MS
F3’H and F3’5’H are the primary enzymes responsible for anthocyanin diversification
ANS, F3’5’H, and UFGT preferential expression may lead to higher levels of pigments
Anthocyanins and sensory quality may be improved in blueberry by gene modification
Disclosure statement
No potential conflict of interest was reported by the author(s).
Additional information
Funding
References
- Norberto, S.; Silva, S.; Meireles, M.; Faria, A.; Pintado, M.; Calhau, C. Blueberry Anthocyanins in Health Promotion: A Metabolic Overview. J. Funct. Foods. 2013, 5(4), 1518–1528. DOI: 10.1016/j.jff.2013.08.015.
- Grace, M. H.; Ribnicky, D. M.; Kuhn, P.; Poulev, A.; Logendra, S.; Yousef, G. G.; Lila, M. A.; Lila, M. A. Hypoglycemic Activity of a Novel anthocyanin-rich Formulation from Lowbush Blueberry, Vaccinium Angustifolium Aiton. Phytomedicine. 2009, 16(5), 406–415. DOI: 10.1016/j.phymed.2009.02.018.
- Neto, C. C. Cranberry and Blueberry: Evidence for Protective Effects against Cancer and Vascular Diseases. Mol. Nutr. Food Res. 2007, 51(6), 652–664. DOI: 10.1002/mnfr.200600279.
- Fei, N.; Jing, F. A. N. G. X.; Ying, Z. H. O. U. H.; Yan, Z. (2010). Current Situation of Blueberry Cultivation in China and Its Industrialization Development Prospect in Guizhou. Guizhou Agric. Sci., 38(010), 69–71.
- Simeone, A. M.; Nota, P.; Ceccarelli, D.; Del Toro, A.; Piazza, G.; De Salvador, F. R.; Caboni, E.; Krupa, T. Anthocyanins in Blueberry Cultivars: Effect of the Growing Area. Acta Hortic. 2012, 926(926), 713–716. DOI: 10.17660/ActaHortic.2012.926.103.
- Zhang Shuai, G. U.; Fei, X. M. J. Y. Ecological Suitability Regionalization of Vaccinium Ashei in Guizhou Based on GIS. Guizhou Agric. Sci. 2014, 10, 255–257. DOI: 10.3969/j.1001-3601.2014.10.066.
- Schick, C. Overview of the Blueberry Industry in South America. Acta Hortic. 1993, 346(346), 27–32. DOI: 10.17660/ActaHortic.1993.346.2.
- Zhou, . L.; Du, B.; Zhou, Y., Xie, G. F., Lan, G. H., Xiao, N, et al. Study on Antioxidant Activity of Anthocyanins from Crude Extract of Blueberry Pomace. Food Ferment. Ind. 2017, 43(6), 181–186.
- Xu, Q.; Zhou, Y.; Wu, Y.; Jia, Q.; Gao, G.; Nie, F. Enzyme‐assisted Solvent Extraction for Extraction of Blueberry Anthocyanins and Separation Using Resin Adsorption Combined with Extraction Technologies. Int. J. Food Sci. Technol. 2016, 51(12), 2567–2573. DOI: 10.1111/ijfs.13240.
- Zhang, R. F.; Wang, S. Y. Study on Extraction and Determination of Anthocyanins from Blueberry of Qiandongnan, Guizhou Province. China Food Additiv. 2016, 11, 190–194.
- Ma, Z. L.; Tang, L. Z.; Gao, X. M., and Yan, C. M., et al. Analysis of Anthocyanins in Different Parts of Michelia with high-performance Liquid Chromatography. IOP Conference Series: Earth and Environmental Science. 2020, 546, 42063. DOI: 10.1088/1755-1315/546/4/042063.
- He, Y. K.; Yao, Y. Y.; Chang, Y. N. Characterization of Anthocyanins in Perilla Frutescens Var. Acuta Extract by Advanced UPLC-ESI-IT-TOF-MSn Method and Their Anticancer Bioactivity. Molecules. 2015, 20(5), 9155–9169. DOI: 10.3390/molecules20059155.
- Li, N.; Song, Y.; Tang, H.; Wang, Y. Recent Developments in Sample Preparation and Data pre-treatment in Metabonomics Research. Arch. Biochem. Biophys. 2016, 589, 4–9. DOI: 10.1016/j.abb.2015.08.024.
- Wang, Q.; Zhang, F.; Wang, X. Study Achievements on the Nature of TCM Syndromes Based on Metabonomics. World Sci. Technol. (Modernization of Traditional Chinese Medicine and Materia Medica). 2011, 13, 541–545.
- Wang, X.; Wei, Z.; Ma, F. The Effects of Fruit Bagging on Levels of Phenolic Compounds and Expression by Anthocyanin Biosynthetic and Regulatory Genes in red-fleshed Apples. Process Biochem. 2015, 50(11), 1774–1782. DOI: 10.1016/j.procbio.2015.06.024.
- Wang, Y.; Wang, Y.; Song, Z.; Zhang, H. S1674205216301356. Repression of MYBL2 by Both microRNA858a and HY5 Leads to the Activation of Anthocyanin Biosynthetic Pathway in Arabidopsis. Mol. Plant. 2016, 9(10), 1395–1405. DOI: 10.1016/j.molp.2016.07.003.
- Rustioni, L.; Meo, F. D.; Guillaume, M.; Failla, O., and Trouillas, P. Tuning Color Variation in Grape Anthocyanins at the Molecular Scale. Food Chem. 2013, 141, 4349–4357. DOI: 10.1016/j.foodchem.2013.07.006.
- Chen, W.; Gong, L.; Guo, Z.; Wang, W.; Zhang, H.; Liu, X.; Yu, S.; Xiong, L.; Luo, J. A Novel Integrated Method for large-scale Detection, Identification, and Quantification of Widely Targeted Metabolites: Application in the Study of Rice Metabolomics. Mol. Plant. 2013, 6(6), 1769–1780. DOI: 10.1093/mp/sst080.
- Thévenot, E. A.; Roux, A.; Xu, Y.; Ezan, E., and Junot, C. Analysis of the Human Adult Urinary Metabolome Variations with Age, Body Mass Index, and Gender by Implementing a Comprehensive Workflow for Univariate and OPLS Statistical Analyses. J. Proteome Res. 2015, 14, 3322–3335. DOI: 10.1021/acs.jproteome.5b00354.
- Wang, F.; Chen, L.; Chen, H.; Chen, S.; Liu, Y. Analysis of Flavonoid Metabolites in Citrus Peels (Citrus Reticulata ‘Dahongpao’) Using UPLC-ESI-MS/MS. Molecules. 2019, 24(15), 2680. DOI: 10.3390/molecules24152680.
- Slatnar, A.; Mikulic-Petkovsek, M.; Veberic, R.; Stampar, F.; Schmitzer, V. Anthocyanin and Chlorophyll Content during Poinsettia Bract Development. Sci. Hortic. 2013, 150, 142–145. DOI: 10.1016/j.scienta.2012.10.014.
- Zhang, M. J.; Tian, M. X.; Wei, Y. S. D. N. University. Identification and Analysis for Anthocyanins Compositions in Blueberry. Storage Process. 2017, 17(3), 107–110.
- Francis, F. J.; Harborne, J. B.; Barker, W. G. Anthocyanins in the Lowbush Blueberry, Vaccinium Angustifolium. J. Food Sci. 1966, 31(4), 583–587. DOI: 10.1111/j.1365-2621.1966.tb01908.x.
- Lee, M. K.; Kim, H. W.; Lee, S. H.; Kim, Y. J.; Jang, H.; Jung, H.; Kim, J.; Choe, J.-S.; Kim, J.-B. Compositions and Contents Anthocyanins in Blueberry (Vaccinium Corymbosum L.) Varieties. Korean J. Environ. Agric. 2016, 35, 184–190. DOI: 10.5338/KJEA.2016.35.3.25.
- Jiang, Z.; Chen, C.; Wang, J.; Xie, W.; Wang, M.; Li, X.; Zhang, X. Purple Potato (Solanum Tuberosum L.) Anthocyanins Attenuate alcohol-induced Hepatic Injury by Enhancing Antioxidant Defense. J. Nat. Med. 2016, 70(1), 45–53. DOI: 10.1007/s11418-015-0935-3.
- Lachman, J.; Hamouz, K.; Orsák, M.; Pivec, V.; Hejtmánková, K.; Pazderů, K.; Čepl, J.; Čepl, J. Impact of Selected factors—Cultivar, Storage, Cooking and Baking on the Content of Anthocyanins in coloured-flesh Potatoes. Food Chem. 2012, 133(4), 1107–1116. DOI: 10.1016/j.foodchem.2011.07.077.
- Liu, Y.; Hua, H.; Jiang, X.; Wang, P.; Dai, X.; Chen, W.; Gao, L., and Xia, T., et al. A WD40 Repeat Protein from Camellia Sinensis Regulates Anthocyanin and Proanthocyanidin Accumulation through the Formation of MYB–bHLH–WD40 Ternary Complexes[J]. Int. J. Mol. Sci. 2018, 19, 1686. DOI: 10.3390/ijms19061686.
- Yang, Y. N.; Yao, G. F.; Zheng, D.; Zhang, S.L.; ; , and Wu, J., et al. Expression Differences of Anthocyanin Biosynthesis Genes Reveal Regulation Patterns for Red Pear Coloration. Plant Cell Rep. 2014, 34, 189–198. DOI: 10.1007/s00299-014-1698-0.