
 ?Mathematical formulae have been encoded as MathML and are displayed in this HTML version using MathJax in order to improve their display. Uncheck the box to turn MathJax off. This feature requires Javascript. Click on a formula to zoom.
ABSTRACT
Wheat flour aging process is considered very important to impart desirable changes in order to get good quality bakery products. It was extensively studied through analytical and rheological variations during storage using conventional methods. In this study, the potential of Fourier Transform Infrared Spectroscopy (FTIR) was determined to monitor the process of wheat aging. FTIR spectroscopy along with chemometrics tools like principal component analysis (PCA) and partial least square regression (PLSR) were used to monitor the aging process of wheat flour during the storage period of two months at room temperature. PCA subjected to spectral, analytical and rheological parameters during storages showed the clear demarcation of wheat flour stored at various intervals using first 2 PCs. PLSR showed the best prediction models for crude protein (R2CV = 0.97 and 0.11 RMSECV) and wet gluten contents (R2CV = 0.88 and 0.41 RMSECV), whereas the other analytical parameters were not accurately predicted from FTIR spectral data. However, it can be concluded that FTIR spectroscopy can be used as an alternative tool to predict the changes in wheat flour during the aging process.
KEYWORDS:
Introduction
Many people in the world obtain their food from wheat and its products. Wheat is normally used after milling in various food items like bread, cakes, cookies and pasta.[Citation1] The composition and characteristics of flour are important to determine the final quality of wheat based products.[Citation2] The main components in flour are starch and non-starch polysaccharides, protein and lipids which predict the quality of finished food item.[Citation3] Normally flour does not use immediately after milling in bakery items. It undergoes aging that is considered a natural process due to the exposure of flour with light and oxygen. It induces some chemical changes in the composition of flour due to the oxidation of proteins and fatty acid present in the flour. These desirable changes in protein structure result in strengthening the gluten network that develops during the dough preparation process.[Citation4] Similarly, the prolonged storage of wheat flour results in alteration of the fatty acid profile that ultimately modifies starch gelatinization temperature and swelling ability of gluten.[Citation5] Proteolytic enzymes present in the wheat flour also modify the elasticity and extensibility of dough during the aging process.[Citation6] These alterations in the rheological parameters may be correlated with the final product quality of wheat-based food items. Secondly, it is also important to ensure the keeping quality of wheat flour during storage to get the high-quality wheat-based food items. The standard methods are being used to monitor the characteristics of the wheat flour, which are conventional and time consuming. Therefore, there is need to develop rapid and non invasive technologies due to enhancement of consumer’s awareness about quality and safety issues in the food discipline in the modern times. For this purpose, spectroscopic techniques can be an alternative. There are different types of spectroscopic methodologies, which are being used to develop rapid and nondestructive ways to determine the quality of final product. Among these spectroscopic techniques, vibrational spectroscopic methods including Raman and Fourier transform infrared (FTIR) spectroscopy have widely been used in qualitative and quantitative analysis of food and agricultural products. Such as, Raman spectroscopy along with chemomaterics have been used for the evaluation of extra virgin olive oil obtained at different maturation stages.[Citation7] Similarly, Fourier transform infrared spectroscopy (FTIR) coupled with chemometrics (multivariate analysis) has shown its ability to determine simultaneously various properties of food products with a minimal sample portion and without the use of chemicals or time-consuming sample preparation. For example, it has been used successfully to predict fatty acids in other matrices such as poultry feed lipid extract[Citation8] margarines[Citation9] beef fat[Citation10] vegetable oils[Citation11] and pork fat.[Citation12] Recently, a study was published aimed to characterize coconut testa flour (CTF) of five different Sri Lankan cultivars and to develop statistical models between FTIR data and parameters of CTF, wheat flour (WF) and their admixtures.[Citation13] FTIR is being applied to determine the dough development time of wheat flour accurately that is important to predict the machine ability of the dough and characterization of the quality of wheat-based product. In addition to this, it is being employed to determine the food fraudulent practices which include the detection of starch in onion powder[Citation14] and used in identification of wheat varieties.[Citation15] Hence, it is revealed in the above discussion that FTIR has been utilized in various food applications. But according to the literature, it has not extensively used to monitor the wheat flour aging process. Therefore, different chemometrics tools like PCA and PLSR were being used to evaluate the process of aging in wheat flour after milling. It may be a step toward a sensor development, which is the need of the time to develop rapid, and environment friendly analytical techniques to protect the future generation. Present study is designed to determine the potential of FTIR spectroscopy as a nondestructive and rapid technique to monitor the aging process in wheat flour after milling.
Material and methods
Procurement of raw material
One wheat variety (Faisalabad-2008) was obtained from Ayub Agricultural Research Institute Faisalabad, Pakistan.
Milling of wheat varieties
The wheat grains were first tempered on 14% moisture basis. After tempering process, wheat milling was done by Quadumat Senior Mill.
Storage of wheat flour
After milling process, wheat flour was stored in polyethylene bags for a period of 60 days at room temperature. During storage, wheat flour was analyzed for determination of different analytical and rheological parameters at intervals of 0, 3, 6, 10, 20, 30, 45, and 60 days to monitor the changes during the aging process.
Chemical analysis
Moisture Content
Moisture content in each sample was estimated through the process outlined in method No. 44–15A .[Citation16] In this experiment, 5 grams well-ground flour sample was taken in China dish and placed it in hot air oven at 105°C ± 5°C for 24 h to attain a constant weight. Moisture percentage was calculated according to the formula in EquationEquation 1(1)
(1) :
Ash Content
Ash content in each sample were measured according to method No. 08–01 mentioned in .[Citation16] Three grams sample of flour was taken in crucible and incinerated in muffle furnace at 550–600°C for 5–6 h.
Crude Protein Content
Crude protein content estimation in each sample was carried out through Kjeldahl’s process as describe in method No 46–10.[Citation16] In this context 2 g sample was digested with 5 g digestion mixture (FeSO4, CuSO4 and K2SO4 with 5:10:15 separately) in the presence of 25 mL concentrated H2SO4 till transparent mixture was obtained. The digested sample was then diluted to make 100 mL. The 10 mL of diluted sample was distilled in a distillation apparatus with 40% NaOH and 4% boric acid solution-containing indicator. Then it was titrated against 0.1 N H2SO4 solution till light pink color. Crude protein was estimated considering nitrogen factor as 5.7.
Crude Fat Content
Fat content was determined employing Soxhlet apparatus according to process outlined in method No. 30–25.[Citation16] In this context, 2 g of moisture free sample was placed in an extraction tube containing separate thimble. The temperature adjustment permits continuous drops of solvent n-Hexane trickled down in the extraction tube containing sample. The extraction process was carried out with n-Hexane (B.P. 40–60°C) for 3–4 hours. The solvent containing fat was placed into a clean and pre-weighed Petri plates. Then the Petri plates were placed for 1–2 hours in a hot air oven for evaporation of n-Hexane.
Crude Fiber Content
Crude fiber content was measured through following protocol defined in method No. 32–10.[Citation16] In this context, 2 g moisture free and defatted sample was digested for 30 minutes with 200 mL of 1.25% H2SO4 followed by 200 mL of 1.25% sodium hydroxide. Contents were filtered after treating with sulfuric acid and sodium hydroxide and gave 2–3 washings with distilled water (150 mL) until the contents were acid and alkali free. The contents were carefully placed in a hot air oven and dried for 2 hours at 130°C. The weight of the contents was noted before ignition and placed in a muffle furnace at 550°C for 4 h.
Gluten contents
The gluten contents in the sample were estimated according to the process mentioned in method No. 38–12A.[Citation16] In this test, 10 g flour sample was placed on top of the polyester screen coupled with glutomatic apparatus (model no. GM 2200, Preten Instruments, Sweden). For 5 minutes, the sample was mixed with 2% solution of salt. The wet gluten was separated, placed in the centrifugation container, and centrifuged. The contents retained on upper part of the screen and through the screen are weighed.
Farinograph
Flour dough physical properties were measured according to the process outlined in method No. 54–21 employing farinograph (Brabender D-4100 SEW; Germany).[Citation16] In this test, 300 g of flour sample on 14% moisture content was taken and placed in resultant farinograph mixing container. The curve is centered at 500 Brabender unit (BU) line ±20 BU through the addition of appropriate water amount and run the test for 20 min. This indicates that the quantity of water required for the flour to be processed optimally into end product.
FTIR spectra of wheat flour
Fourier Transform Infrared spectrophotometer (Tensor 27, Bruker Optics, Germany) was used to take the spectra of wheat flour during various interval of storage, which was connected to computer and controlled by OPUS software (Optical V 5.5 Bruker, Ettlingen, Germany). The spectra were taken in the mid infrared region (4000 to 800 cm−1) with resolution 8 cm−1. The speed of scanning the sample was set at 10 kHz with aperture size of was 6 mm. The wheat flour was placed on ATR crystal, which is made up of zinc selenide. A single beam spectrum of sample was obtained to show a spectrum in absorbance units. The crystal ATR was cleaned using methanol thoroughly between successive analyses. Ten spectra were taken for wheat flour at various intervals of 0, 3, 6, 10, 20, 30, 45, and 60 days of storage. In this way 80 spectra for wheat flour were taken for 60 days storage.
Data analysis
Preprocessing of data
The raw spectral data, as obtained by a spectrometer, are not necessarily suitable for subsequent chemometric treatment. The pretreatments are aimed at improving the signal and data reduction. Among the pretreatments used, baseline correction for spectra is very important, baseline corrections were applied on spectral data. After the visual inspection, the detection of anomalous spectra was accomplished using Hotelling T2, which indicates how different a sample spectrum is from the average spectrum of the set. Hotelling T2 test is the modified form of Student’s t-test statistics, which is used for multivariate analysis and is used when two or more variables exist in the analysis. This test was used to make the assumptions of equal variances and normally distributed residuals in the spectral data set to remove the outliers from the collected FTIR spectra.
Principle component analysis (PCA)
PCA is a non-supervised chemometric tool, which is used to display the large number of uncorrelated variables into a smaller number of components without loss of information. It can also be used to describe pattern recognition present in the dataset. In this study, PCA was applied not only to spectral dataset but also on analytical and rheological parameters of wheat flour during various interval of storage by using Unscrambler software.
Partial least square regression (PLSR)
PLSR model is a strong statistical tool, which is being used for prediction of different parameters in food analytics. PLSR is a form of predictive spectral data analysis for comparing the traditional data set with the spectral data set in order to determine the competence of spectral data. In this study, different analytical and rheological parameters were predicted out of FTIR spectral data using the PLSR models. The dataset was divided into eight groups as ten FTIR spectra were taken at eight different intervals during storage of wheat flour. After grouping of datasets, PLSR model was calculated by using leave one group out method to predict the analytical and rheological changes taken place during the wheat flour aging process. The Unscrambler software was used to build PLSR model. Root mean square errors of cross validation (RMSECV) and coefficient of determination of cross validation (R2) were determined. Moreover, the RMSECV and R2 were calculated by using the EquationEquation 2(2)
(2) and Equation3
(3)
(3) respectively.
where n, mi, pi and stand for number of samples, measured, predicted and mean value respectively.
Results and discussion
Effect on chemical parameters of wheat flour
The results regarding the chemical parameters of wheat flour during aging process have been presented in . The moisture is an important parameter of wheat flour that tells about the keeping quality.[Citation17] The initial moisture was found 13.09% that significantly reduces during the storage. The final moisture content of 11.07% was recorded at 60 days. The results regarding the moisture content are in line with the previous findings who describe the reduction in moisture content during short term storage of wheat flour at two different temperatures.[Citation18] Similarly, proteins show the same trend. The protein was recorded 13.57% at 0 day that significantly reduces and found 12.19% at 60 days of storage. This reduction in protein is due to the presence of proteolytic enzymes that plays their role in breakdown of proteins.[Citation19] The gluten also shows some structural changes. Firstly, it increases due to natural maturation of wheat flour in air up to 6 days but then it reduces. The changes in gluten structure is important that it imparts the elasticity to the dough due to the natural oxidation of wheat flour that is ultimately helpful to attain better quality baked products with appropriate volume.[Citation20] The fat is present in minute quantity in wheat flour. At 0 day, it was found 1.48% whereas it decreases and recorded 1.01% at 60 days which is due to oxidation. The lipase activity is low in fresh wheat flour as compared to matured one. Hence this reduction of fat content of wheat flour can also be correlated with this phenomenon.[Citation21] The ash and fiber contents were the least affected parameters during the storage of wheat flour. As these two parameters are well stable and does not significantly affect during short-term storage of wheat flour.
Table 1. Effect on the chemical composition of wheat flour during storage.
Effect on farinographic parameters of wheat flour
Flour dough rheological properties were estimated through conducting farinogpahic studies as presented in . It tells about the water absorption and dough profile like dough development time, dough stability and dough softening.[Citation2] All these parameters are important as it calculates not only optimum amount of water but also tells the strength of wheat flour and suitability for high volume baked products like bread and cakes. Water absorption was recorded 54.35% at 0 day that significantly increases during storage and was found 55.48% at 60 days. This increase in water absorption is due to proteolysis that ultimately results in more water absorption. Similarly, dough development time was found 6.75 min, 6.85 min, 6.93 min and 6.98 min at 0, 3, 6 and 10 days of storage respectively showing non-significantly increasing trend which may be attributed due to the short storage intervals. However, it shows the decreasing trend during the rest of the intervals, which may be allocated due to the activity of proteolytic enzymes.[Citation19] Dough stability is an important parameter that describes the strength of wheat flour during the mixing process. The strong flour has high value of dough stability that is suitable for having bread with optimum loaf volume.[Citation22] At 0, 3 and 6 days of storage it was recorded as 8.1 min, 8.21 min and 8.29 min respectively. Hence, there is increasing trend, but it decreases for the rest of storage period and was reported 7.45 min at 60th day of storage. The behavior of wheat flour is due to the structural rearrangement of gluten network during the process of storage that was also described by the previous researchers during the accelerated aging of wheat grain and flour.[Citation23] The softening of dough was measured as the difference in Brabender Unit from center of curve at peak and center of curve 12 min after peak. The dough softening was recorded lesser as compared to matured flour. The development of gluten network during the aging process of wheat may result in strengthening of the wheat flour that is less prone to softening during the storage intervals.
Table 2. Effect on farinographic parameters of wheat flour during storage.
FTIR spectra of wheat flour during aging process
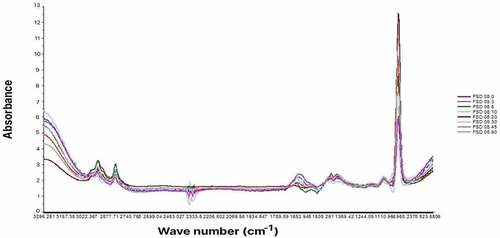
presents the FTIR spectra of wheat flour taken during various storage intervals. One can see the changes in the spectral signature of the wheat flour taken at various storage intervals. It has observed various peaks in different regions of the spectra that can be used to elaborate the structural changes in the wheat flour due to the maturation process of 60 days. The strong peaks of H and OH bonds were seen on 1640 cm−1 to 3300 cm−1. These peaks represent the moisture contents of the wheat flour that may change during the storage intervals. Similar, some peaks were also observed at 1500 cm−1 to 1700 cm−1. These bands belong to the proteins for amide I and II bands, and recorded at 1660 cm−1 and 1550 cm−1, respectively.[Citation15] In the protein, amide I band emerge from the stretching of carbon and oxygen section of peptide group. The amide II band is mainly emerge from the bending of NH and secondarily to the effect of stretching of CN. In the spectrum, the strong spectral absorbance of NH stretching indicates that the wheat variety contains higher protein contents. The protein contents were measured with the spectral peaks of amide I band at 1600 cm−1 to 1700 cm−1 and amide II band at 1550 cm−1 to 1570 cm−1 in the mid-infrared region. One can see the changes in this spectral region during the various storage intervals that clearly demonstrate the structural development of proteins during maturation process. The highest peaks were observed at 900 cm−1 to 1000 cm−1 that belong stretching of carbon and oxygen bond that is the part of protein molecules and presents the changes in the wheat flour during storage.[Citation24]
Figure 1. FTIR spectral signatures of wheat flour aging process during storage.
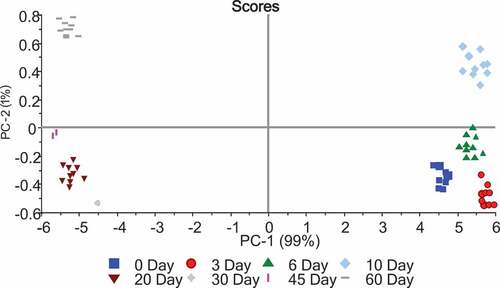
PCA on FTIR spectra of wheat flours during aging process
PCA was performed on wheat variety (Faisalabad-2008) during 60 days of aging process at ambient room temperature. It was observed that PC-1 and PC-2 retains the 99% and 1% variation in the dataset respectively. Against PC-1, the spectral data shows higher score at 0, 3, 6, and 10 days of interval whereas extended storage interval present lower score against this principal component. On the other hand, PC-2 also shows the same trend as it was observed in the first principal component. However, the results demonstrate the effect of wheat flour aging process during the various storage intervals by showing different score plot in PC analysis (). This variation represents that most of the variations in the structure of wheat flour is taken place in the first three days of storage. It is also recommended that after milling process, wheat flour should undergo aging process, which helps to strengthen the gluten network structure upon hydration. If the wheat flour is used for processing immediately after milling process, it will not show desirable baking properties in the finished product. The bread developed with flour without aging process has lesser loaf volume than the bread baked with aged flour.[Citation25] Hence the most changes were observed during aging process that is why it has shown different scores in the PCA graphical representation. Therefore, it can be assumed from the above discussion that PCA may be used for the monitoring of aging process of wheat flour, which is important to impart the required processing and baking parameters to get a high quality end product.
Figure 2. PCA score plot on FTIR spectral data to monitor the changes in wheat flour aging process during storage.
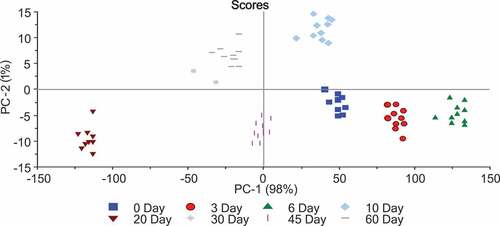
PCA on chemical and farinographic parameters of wheat flour during aging process
PCA was also performed on chemical and farinographic parameters of wheat flour (Faisalabad-2008) which were observed during the various interval of aging process. PCA score plot was calculated and observed that the first two PCs contain the 99% information. It was observed that PC-1 shows 98% whereas PC-2 presents 1% variation in the data shown in . It was observed a clear demarcation of intervals of aging process during storage of wheat flour at ambient temperature. These differences in the chemical and farinographic parameters observed in PCA score plot can be connected to the chemical transformation of starch and strengthening of wheat flour gluten network which ultimately results in the strong variation during processing and baking of wheat based product development. Hence, it can be assumed that PCA score plot successfully monitor the changes in analytical and rheological parameters of wheat flour during the process of aging.
Figure 3. PCA score plot on chemical and farinographic parameters measured during various storage interval of wheat flour to monitor its aging process.
PLSR model to predict chemical and farinographic parameters
PLSR models were calculated from FTIR spectral dataset to predict the chemical and farinographic parameters of wheat flour during the process of aging (). It was observed that moisture, ash, crude fat and fiber show moderately high value of R2 whereas protein and gluten showed excellent correlation by using the PLSR model out of spectral data. The ash contents show no absorption bands in FTIR spectral signatures but the chelating of these inorganic components with the organic compounds may results in their prediction as described in previous literature. The cadmium in brown rice[Citation26] arsenic in prostrate amaranth[Citation27] and red Crayfish[Citation28] were determined using near infrared spectroscopy coupled with chemometrics.The farinographic parameters were poorly predicted from the spectral information using PLSR model. This poor prediction for different chemical and rheological parameters may be due to the smaller number of samples used for development of PLSR model. Therefore, it can be concluded that the FTIR spectra showed some potential and can be used to determine the protein and gluten contents of the wheat flour using PLSR model.
Table 3. Prediction of chemical and farinographic parameters of wheat flour during storage through FTIR spectral data.
Conclusion
The maturation of the wheat flour is an important step for having structural changes in gluten network that can give viscoelastic properties to the dough which is helpful to get high volume baked goods. The present study successfully elaborates the potential of FTIR spectroscopy for monitoring of wheat flour aging process. The applied PCA can clearly classify the wheat flour based on FTIR spectral signatures as well as the chemical and farinographic parameters. The PLSR model can predict only protein and gluten content of wheat flour while other chemical and rheological parameters are poorly predicted. The poor prediction of these chemical and farinographic parameters may be attributed due to less number of samples used for the development of PLSR models. The prediction of these parameters can be improved using flour samples differing in chemical composition as well as in gluten quality and quantity. However, this study shows the potential of FTIR spectroscopy for the development of rapid and nondestructive analytical method for monitoring the wheat flour aging process. This will ultimately be helpful for the cereal processing industry in future to eliminate the conventional analytical methodologies for better quality control, as it is also an environment friendly technology.
Disclosure statement
No potential conflict of interest was reported by the author(s).
Data Availability Statement
The data generated for this study is availabe in the manuscript.
Additional information
Funding
References
- Ahmad, M. H.; Nache, M.; Waffenschmidt, S.; Hitzmann, B. A Fluorescence Spectroscopic Approach to Predict Analytical, Rheological and Baking Parameters of Wheat Flours Using Chemometrics. J. Food Eng. 2016, 182, 65–71. DOI: 10.1016/j.jfoodeng.2016.03.006.
- Ahmad, M. H.; Nache, M.; Waffenschmidt, S.; Hitzmann, B. Characterization of Farinographic Kneading Process for Different Types of Wheat Flours Using Fluorescence Spectroscopy and Chemometrics. Food Control. 2016, 66, 44–52. DOI: 10.1016/j.foodcont.2016.01.029.
- Shewry, P. R.; Hey, S. J. The Contribution of Wheat to Human Diet and Health. Food and energy secur. 2015, 4(3), 178–202. DOI: 10.1002/fes3.64.
- Wang, N.; Ma, S.; Li, L.; Zheng, X. Aggregation Characteristics of Protein during Wheat Flour Maturation. J. Sci. Food Agric. 2019, 99(2), 719–725. DOI: 10.1002/jsfa.9239.
- Fierens, E.; Helsmoortel, L.; Joye, I. J.; Courtin, C. M.; Delcour, J. A. Changes in Wheat (Triticum Aestivum L.) Flour Pasting Characteristics as a Result of Storage and Their Underlying Mechanisms. J. Cereal Sci. 2015, 65, 81–87. DOI: 10.1016/j.jcs.2015.06.009.
- Wang, L.; Flores, R. A. The Effects of Storage on Flour Quality and Baking Performance. Food Rev. Int. 1999, 15(2), 215–234. DOI: 10.1080/87559129909541187.
- Gouvinhas, I.; Machado, N.; Carvalho, T.; de Almeida, J. M. M. M.; Airna, B. Short Wavelength Raman Spectroscopy Applied to the Discrimination and Characterization of Three Cultivars of Extra Virgin Olive Oils in Different Maturation Stages. Talanta. 2015, 132, 829–835. DOI: 10.1016/j.talanta.2014.10.042.
- Mahesar, S. A.; Sherazi, S. T. H.; Kandhro, A. A.; Bhanger, M. I.; Khaskheli, A. R.; Talpur, M. Y. Evaluation of Important Fatty Acid Ratios in Poultry Feed Lipids by ATR FTIR Spectroscopy. Vib. Spectrosc. 2011, 57(2), 177–181. DOI: 10.1016/j.vibspec.2011.06.009.
- Hernández-Martínez, M.; Gallardo-Velázquez, T.; Osorio-Revilla, G. Rapid Characterization and Identification of Fatty Acids in Margarines Using Horizontal Attenuate Total Reflectance Fourier Transform Infrared Spectroscopy (HATR-FTIR). Eur. Food Res. Technol. 2010, 231(2), 321–329. DOI: 10.1007/s00217-010-1284-9.
- Hu, X.; Toyoda, K.; Yamanoue, M.; Ihara, I.; Nakai, K. Evaluation of Fatty Acid Profile of Wagyu Beef by ATR-FTIR Spectroscopy. Food Bioprocess. Technol. 2010, 3(6), 883–891. DOI: 10.1007/s11947-010-0375-8.
- Sherazi, S. T. H.; Kandhro, A.; Mahesar, S. A.; Bhanger, M. I.; Talpur, M. Y.; Arain, S. Application of Transmission FT-IR Spectroscopy for the Trans Fat Determination in the Industrially Processed Edible Oils. Food Chem. 2009, 114(1), 323–327. DOI: 10.1016/j.foodchem.2008.09.058.
- Olsen, E. F.; Rukke, E.-O.; Egelandsdal, B.; Isaksson, T. Determination of Omega-6 and Omega-3 Fatty Acids in Pork Adipose Tissue with Nondestructive Raman and Fourier Transform Infrared Spectroscopy. Appl. Spectrosc. 2008, 62(9), 968–974. DOI: 10.1366/000370208785793371.
- Gunarathne, R.; Marikkar, N.; Yalegama, C.; Mendis, E. FTIR Spectral Analysis Combined with Chemometrics in Evaluation of Composite Mixtures of Coconut Testa Flour and Wheat Flour. J. Food Meas. Charact. 2022, 16(3), 1796–1806. DOI: 10.1007/s11694-022-01287-4.
- Lohumi, S.; Lee, S.; Lee, W.-H.; Kim, M. S.; Mo, C.; Bae, H.; Cho, B.-K. Detection of Starch Adulteration in Onion Powder by FT-NIR and FT-IR Spectroscopy. J. Agric. Food Chem. 2014, 62(38), 9246–9251. DOI: 10.1021/jf500574m.
- Amir, R. M.; Anjum, F. M.; Khan, M. I.; Khan, M. R.; Pasha, I.; Nadeem, M. Application of Fourier Transform Infrared (FTIR) Spectroscopy for the Identification of Wheat Varieties. J. Food Sci. Technol. 2013, 50(5), 1018–1023. DOI: 10.1007/s13197-011-0424-y.
- AACC. Approved Methods of American Association of Cereal Chemists. St; Paul, MN, U.S.A: AACC Press, 2000.
- Nasir, M.; Butt, M. S.; Anjum, F. M.; Sharif, K.; Minhas, R. Effect of Moisture on the Shelf Life of Wheat Flour. Int. J. Agric. Biol. 2003, 5, 458–459.
- Ahmed, M. S. H. Effect of Storage Temperature and Periods on Some Characteristics of Wheat Flour Quality. Food Nutr. Sci. 2015, 6(12), 1148. DOI: 10.4236/fns.2015.612120.
- Turksoy, S.; Erturk, M. Y.; Bonilla, J.; Turasan, H.; Kokini, J. L. Effect of Aging at Different Temperatures on LAOS Properties and Secondary Protein Structure of Hard Wheat Flour Dough. J. Cereal Sci. 2020, 92, 102926.
- Móré, M.; Diósi, G.; Győri, Z. Sipos, P. Changes of Gluten Properties of Wheat during Storage. Anale Universităţii din Oradea, Fascicula: Ecotoxicologie, Zootehnie şi Tehnologii de Industrie Alimentară, XII/B. 2013, 285–290.
- Salman, H.; Copeland, L. Effect of Storage on Fat Acidity and Pasting Characteristics of Wheat Flour. Cereal Chem. 2007, 84(6), 600–606. DOI: 10.1094/CCHEM-84-6-0600.
- Song, Y.; Zheng, Q. Dynamic Rheological Properties of Wheat Flour Dough and Proteins. Trends Food Sci. Technol. 2007, 18(3), 132–138. DOI: 10.1016/j.tifs.2006.11.003.
- Aghababaei, A.; Maftoonazad, N.; Elhamirad, A.; Badii, F. Accelerated Ageing of Wheat Grains: Part I- Influence on Rheological Properties of Wheat Flour. J. Cereal Sci. 2017, 77, 147–156. DOI: 10.1016/j.jcs.2017.08.009.
- Rodriguez-Saona, L. E.; Koca, N.; Harper, W. J.; Alvarez, V. B. Rapid Determination of Swiss Cheese Composition by Fourier Transform Infrared/Attenuated Total Reflectance Spectroscopy. J. Dairy Sci. 2006, 89(5), 1407–1412. DOI: 10.3168/jds.S0022-0302(06)72209-3.
- Tebben, L.; Shen, Y.; Li, Y. Improvers and Functional Ingredients in Whole Wheat Bread: A Review of Their Effects on Dough Properties and Bread Quality. Trends Food Sci. Technol. 2018, 81, 10–24. DOI: 10.1016/j.tifs.2018.08.015.
- Zhu, X.; Li, G.; Shan, Y. Prediction of Cadmium Content in Brown Rice Using near-infrared Spectroscopy and Regression Modelling Techniques. Int. J. Food Sci. Technol. 2015, 50(5), 1123–1129. DOI: 10.1111/ijfs.12756.
- Font, R.; Del Rı́o, M.; Vélez, D.; Montoro, R.; De Haro, A. Use of near-infrared Spectroscopy for Determining the Total Arsenic Content in Prostrate Amaranth. Sci. Total Environ. 2004, 327(1–3), 93–104. DOI: 10.1016/j.scitotenv.2004.01.008.
- Font, R.; Del Río-Celestino, M.; Vélez, D.; De Haro-Bailón, A.; Montoro, R. Visible and Near-Infrared Spectroscopy as a Technique for Screening the Inorganic Arsenic Content in the Red Crayfish (Procambarus C Larkii Girard). Anal. Chem. 2004, 76(14), 3893–3898. DOI: 10.1021/ac035377c.