
 ?Mathematical formulae have been encoded as MathML and are displayed in this HTML version using MathJax in order to improve their display. Uncheck the box to turn MathJax off. This feature requires Javascript. Click on a formula to zoom.
ABSTRACT
The nondestructive detection of kiwifruit texture has become an important necessity that influences kiwifruit economic efficiency and consumer recognition of the kiwifruit. This study investigated the feasibility of using hyperspectral imaging technology to identify textural characteristics of kiwifruit, and to establish the model with best performance. Firstly, a near-infrared hyperspectral online grading system (1000–2500 nm) was constructed to acquire spectral images. Textural characteristics were measured via three different textural analysis tests: textural profile analysis, puncture test, and shear test. Then, samples were divided into a calibration set and a prediction set based on rank sampling at a ratio of 3:1. Mean centralization, standard normal variate, and multiplicative scatter correction methods were applied to pre-process obtained spectra. Finally, the partial least squares method was used to establish prediction models of kiwifruit textural characteristics. The models of hardness1, chewiness, resilience, peel hardness, average hardness, and corrected hardness achieved good performance. Both the correlation coefficients of calibration (rc) and prediction (rp) values exceeded 0.9. The difference between the root mean square error (RMSE) of calibration and prediction was small, and the ratio of prediction to deviation (RPD) value exceeded 2, which was used to predict kiwifruit quality. However, the model of average shear force had a low accuracy with an RPD of 1.680 and the model of shear force also had an RPD below 1.5 and a low RMSE. The results showed that near-infrared hyperspectral imaging technique can be used as a nondestructive method for the textural characteristics kiwifruit.
Introduction
As the “King of Fruits,” the kiwifruit remains very popular among consumers because of its delicious flavor and high nutritional value .[Citation1,Citation2] Compared with other, commonly consumed fruits, the kiwifruit is rich in potassium, polyphenols, fiber, and vitamin C, which ameliorates sleeping quality of consumers[Citation3] and aids their health.
With the rapid development of society and economy, and the improvement of people’s living standards, the requirements for the quality of kiwifruits are also constantly increasing. These requirements are no longer limited to fruit traits such as appearance and long shelf life. Instead, delicious taste and high nutritional value have become important factors that attracting consumers and increase their consumption. To satisfy these demands, textural characteristics are used to assess fruit quality. Textural characteristic are important indicators with which to evaluate fruit. These parameters present relatively complex traits, and are used as a comprehensive reflection of the hardness, tenderness, and taste of fruits. Thus, textural characteristics can directly affect fruit quality and thus, the commercial value of fruit .[Citation4] How to determine and evaluate the textural characteristics of kiwifruit is evidently important during their shelf life or storage period.
At present, there are two traditional methods with which to assess fruit quality: sensory evaluation and instrumental analysis. Pressing with hands and chewing of food with the mouth are typically adopted for sensory evaluation, which are subject to large human errors. Therefore, using such methods that suffer from strong subjectivity cannot be properly repeated or quantified. Instrumental analysis addresses the deficiency of this method[Citation5] and different probes and tests apply different descriptive analyses .[Citation6] However, currently available methods of instrumental analysis are also limited and require skilled operators. The process is time consuming, cumbersome, and inefficient. All samples that are subjected to the currently available evaluation methods are damaged during the test, even cannot be offered for secondary consumption. It is therefore very urgent to develop an efficient, accurate, and nondestructive method for the kiwifruit industry to meet the consumer demand for high-quality agricultural products, establish prime-quality kiwifruit grades, and improve the overall economic efficiency of the process.
Hyperspectral imaging (HSI) is a nondestructive emerging technique developed during recent years, which does not require sample uptake and processing,[Citation7,Citation8] and the advantages are nondestructive assessment, fast detection, simple operation, and optional region of interest .[Citation9–12] The HSI technique is successfully used for quality identification of fruits and vegetables,[Citation13–15] such as “Nanfeng” Mandarins,[Citation16] germ contaminations,[Citation17–21] cherries,[Citation22] and peach pulp .[Citation23] Thus, the HSI technique has gradually developed into a useful food-quality assessment method. Scholars in China and internationally have investigated the relationship between spectra and textural characteristics. The HSI technique has been shown to have potential for the detection of spatial variations of the firmness in peaches,[Citation23] the prediction of both textural profile analysis (TPA) and puncture analysis (PA) parameters of blueberries,[Citation24] and sweetness and hardness prediction of melons .[Citation25] Interestingly, not only fruits can be assessed with this method but also other agricultural products. HSI has been used for hardness prediction of wheat,[Citation26] classification of fresh and frozen-thawed pork meat,[Citation27] and textural firmness assessment on freshness fish .[Citation28]
These studies identified, the HSI technique to offer significant potential for the evaluation of food quality, emphasizing the feasibility of the technology. Little research used the HSI technique to more comprehensively predict the textural characteristics of fruit. First, current techniques focus predominantly on bruising, disease resistance, sweetness, and further traits of the fruit, while little consideration is given on fruit textural. Second, several of the studies on textural characteristics have concentrated on the assessment of firmness. The firmness parameters measurement generally uses conventional measurement methods that do not offer innovation or novelty. Finally, and most importantly, these studies did not comprehensively assess the textural characteristics of food. In Hu et al’s experiments, although it was shown that it is more comprehensive to evaluate the mechanical properties of food compared with other properties, the fruit shear parameters were not considered .[Citation24] In summary, the HSI technique has not been employed for predictions of textural characteristics of kiwifruits to date. To overcome these above-mentioned problems and to assess the textural characteristics of fruits more comprehensively, accurately, and purposefully, this study used the HSI technology to evaluate kiwifruit.
This study investigated the feasibility of using HSI technology to identify textural characteristics of kiwifruit. The main objectives of the current study are as follows: (i) to acquire spectral images using HSI system and to select fitting region of interest from images; (ii) to measure textural parameters via the tests of TPA, puncture and shear; (iii) to pre-process spectra with chemometrics methods; and (iv) to use pre-processed spectra to develop PLS prediction models for finding an approach to assess textural characteristics of kiwifruit.
Materials and methods
Kiwifruit samples
This study used “Fenghuang-1” kiwifruits as samples. On September 27, 2018, after maturity, kiwifruits were picked from a kiwifruit orchard in Fengxin, Jiangxi, China. After the fruits were transported to the laboratory, all dirt was washed off from the surface. Samples with pests, damage, or malformations were excluded and only normal fruits (normal fruits are generally oval in shape, uniform in size, and intact on surface) were selected for experiments.
All the samples were cover with plastic film and refrigerated with the temperature of 4°C. Before each experiment, 10–15 samples were placed on an experiment bench for 12 h to ensure samples have uniform temperature and the temperature in the laboratory is 22 ± 3°C.
A total of 324 kiwifruit samples were used for this study, including 110 TPA test samples, 105 puncture test samples, and 109 shear test samples. Later, these samples will be divided into calibration set and prediction set according to the ratio of 3:1 using the content gradient method, according to their texture characteristic value.
Hyperspectral image acquisition
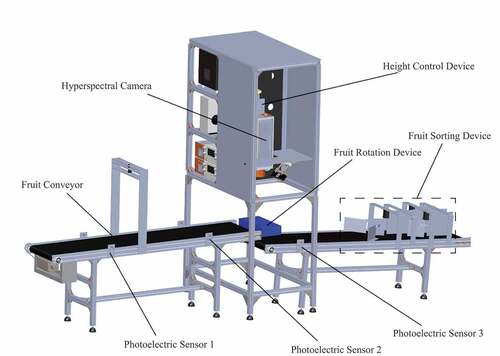
The spectral data were acquired by a hyperspectral online grading system shown in . The system is mainly composed of four parts: an industrial camera (JHUM500m, Shenzhen Jinghang Technology Co., Ltd., China), a hyperspectral camera (SWIR-CL-400-N25E, SPECIM, Finland) with a spectral resolution of 12 nm, a light source (500 W tungsten lamps, Huizhou Guancheng Thermal Energy Technology Co., Ltd., China), three photoelectric sensors and other devices (e.g. fruit conveyor, fruit sorting device, fruit rotating device, and height control device, all of which were designed and manufactured in our laboratory). The major parameters of the HSI system are: the movement speed of the fruit conveyer was set to 150 mm/s, the gain time and the exposure time of industrial camera were 15 ms and 20 ms, respectively, the frame rate of the hyperspectral camera was set to 90 f/s, the exposure time was set to 4.5 ms, and the calibration height was 60 mm. The samples were placed on the fruit conveyor of the HSI system. When the sample reached photoelectric sensor1 at a uniform speed, the industrial camera was triggered and collected a visible image of the fruit after a specific time delay. When the sample moved to the photoelectric sensor2, the HSI system started the hyperspectral camera. This hyperspectral camera was triggered to collect a complete HSI of the fruit after a specific time delay. When the sample reached photoelectric sensor3, the fruit sorting device was opened on the basis of the processing results of HSI. The ultimate purpose was fruit grading according to different processing results.
Figure 1. Hyperspectral online grading system.
Hyperspectral image calibration
Prior to the experiment, the HSI system was preheated for 30 min and various parameters were set. The samples were individually numbered using tags. The HSI acquisition was conducted where kiwifruits were put on the fruit conveyor and upon entering the field of view. To reduce the effects of light, the acquired original image (Iorigial) had to be corrected. A 99.9% reflectance whiteboard (Spectralon SRT-99-100, Labsphere Inc., USA) was used to obtain a white calibration image (Iwhite), while a black calibration image (Iblack) was obtained by turning off the camera lens. The corrected image (I) was calculated via EquationEq. 1(1)
(1) :
The resulting corrected images were used for the subsequent pre-processing and analysis.
Measurement of textural parameters
A food textural analyzer (TL-Pro, Food Technology Corporation, USA) was used to measure the textural parameters of kiwifruit via three different tests. A TPA test, also called as two-bite-test, can be used to quantify the taste of food by compressing samples twice. It simulates the chewing movement of a human mouth. Puncture test can be used to evaluate the hardness of fruit by piercing samples, using a millimeter-diameter cylindrical probe. Shear tests are mainly used to detect tenderness, using a blunt metal knife to cut the fiber pulp into two parts. The textural parameter values were calculated by the software Textural Lab Pro (Version 1.18–408, Food Technology Corporation, USA).
Instrumental TPA test
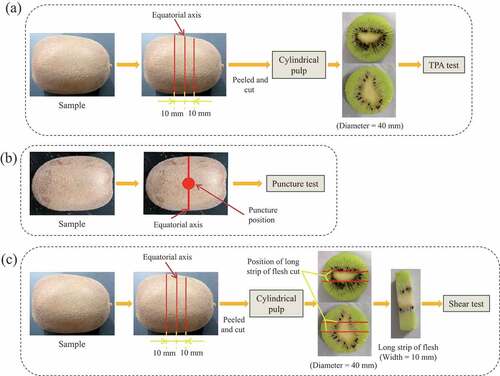
Each sample was peeled and two slices of flesh (10 mm thickness) were cut along the equator of the sample (one for testing and the other for comparison and as backup). Then, a piece of cylindrical pulp was cut off with a 40-mm diameter ring blade. During measurement, each slice of cylindrical pulp was placed on the stage of the textural analyzer, and was compressed by a P75 probe (Φ75 mm plate). The sample preparation process is shown in ). The test parameters in the TPA test were test speed of 0.5 mm/s, holding time between two compression of 5.0 s, sample deformation of 30%, and a trigger force of 0.5 N .[Citation29]
Figure 2. Sample preparation of three textural test methods of (a) TPA (b) puncture (c) shear.
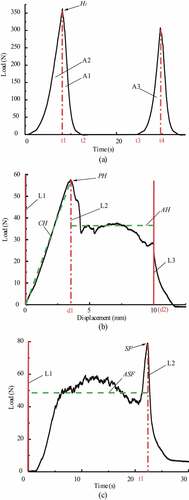
In the TPA test, textural parameters of hardness1, resilience, and chewiness were detected. A typical curve of the textural test by TPA is shown in ). Hardness1 (H1) represented the force that achieved a specific deformation of fruit under certain conditions. This represented the peak force during the first compression. Resilience indicated the ability that flesh could recover from the applied external force. Resilience is the ratio of the work done in the first return (the areas of A1 between t1 and t2) to the first compression (the areas of A2 between 0 and t1), as A1/A2. Chewiness was used to describe the sensation, when people chew and swallow a piece of fruit. It comprehensively reflected the continuous resistance of flesh during chewing. In particular, Chewiness was the product of hardness1, cohesiveness (A3/A2, A3 for the areas between t4 and t3), and elasticity (t4-t3). Chewiness was calculated via EquationEq. 2(2)
(2) (unit: mj):
Figure 3. The characteristic curves kiwifruit texture properties by (a) TPA test (b) puncture test and (c) shear test.
Puncture test
The whole sample was placed on the stage of the textural analyzer, and was measured with surface[Citation30] on by probe P6 (Φ6 mm stainless steel cylindrical probe). ) shows the sample preparation process. Test parameters in the puncture test used a preload speed and test speed of 0.5 mm/s, a return speed after finishing of 1.0 mm/s, a puncture depth of 10 mm of the sample, and a trigger force of 0.5 N .[Citation31] Three points were uniformly measured near the equator of the sample and were calculated to determine the result of the measurement.
The textural characteristic curve of puncture is shown in ). Peel hardness (PH) represents the maximum force (unit: N) during the experiment, when the peel was pierced. Average hardness (AH) represents the average load between the maximum force (d1) and the maximum puncture distance (d2), i.e., the average value between L2 and L3 (unit: N). Corrected hardness (CH) represents the slope value from the start of the test to the maximum forces (d1), i.e., the value of the slope between L1 and L2 (unit: N/mm).
Shear test
The preparation method for cylindrical pulp was the same as that used in the TPA test. A long strip of flesh with 10 mm width was taken out through cores of fruits. It was placed on shearing platform, where it was cut with a shearing cutter, in a direction perpendicular to the pulp fibers. The sample preparation process is shown in ). The test parameters of the shear test were a shear speed of 0.5 mm/s, a return speed of 3 mm/s, a return height of 40 mm, and a trigger force of 0.5 N. Each sample was tested twice and the results were averaged.
A typical shear test curve is shown in ). Shear force (SF) is the maximum force (unit: N) during the shearing process. Average shear force (ASF) represents the average of the starting force and the maximum force (t1) (unit: N), i.e., the average value of L1 and L2.
Sample set division method
A rational division of the sample is important to improve the model performance. The rank sampling (RS) method was applied in this study, to divide the calibration set and the prediction set from samples based on the content gradient method. First, the response values were arranged in ascending order and the maximum and minimum response values were removed. The remaining samples were then divided into a calibration set and a prediction set at a ratio of 3:1. Finally, the calibration set included samples of the calibration set, as well as maximum and minimum values .[Citation32]
Because the three tests would destroy the samples during experiments, those samples cannot be reused. Therefore, according to , the H1, chewiness, and resilience parameters obtained via the TPA test, the total number of samples for calibration and prediction is 110. The PH, AH and CH parameters obtained via the puncture test, the total number of samples for calibration and prediction is 105. The SF and ASF parameters obtained via the shear test, the total number of samples for calibration and prediction is 109. The total number of these three tests is 324. shows that the samples number of each parameter was clear and visible in the calibration and prediction sets. Moreover, the calibration set had a wider distribution range and more representative values. In other words, it contained the range of prediction set to be analyzed. Thus, a model was established with the calibration set, and the accuracy and reliability of the model was verified using the prediction set.
Table 1. Statistical results of kiwifruit texture characteristics in the calibration and prediction.
Pre-processing of spectra
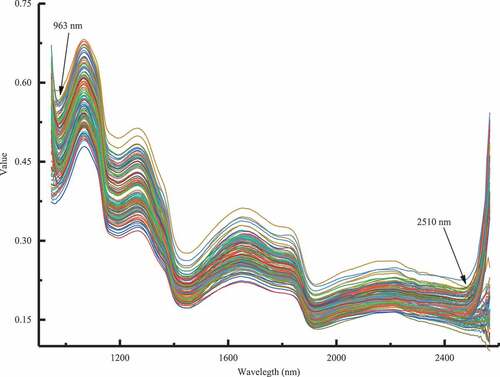
Each hyperspectral image contained a wealth of spectral information and the spectral values varied in the positions of the image surface. 30 ×30 pixels were chosen as region of interest (ROI) to achieve better accuracy. Therefore, a ROI of 30 ×30 pixels in the center of each corrected image of kiwifruit was calculated and the average value was used for further analysis .[Citation2] The results of the average spectra are shown in . The three methods mean centralization (MC), standard normal variate (SNV), and multiplicative scatter correction (MSC) were used to individually process the average spectrum .[Citation33]
Figure 4. Average spectra of kiwifruit samples.
The MC method can be simply expressed as the raw spectra minus the mean of the raw spectra. It is used to remove the errors caused by different dimensions, own variables, or large numerical differences. MC is calculated according to EquationEq. 3(3)
(3) and Equation4
(4)
(4) :
where is the kth raw spectra, and m is equal to the total number of spectral bands. x are the raw spectrum, and
are the mean spectrum.
are the spectrum with MC pre-processing. The SNV method is capable of correcting multiplicative noise, e.g., particle size influence, scatter interference and path length effect arising from the physical structure of samples. This scatter correction represents a row-oriented transformation that standardizes the spectra by individually using its mean and standard deviation. Therefore, it is used to remove the baseline effect of both translation and offset in the spectra. SNV can be mathematically expressed as EquationEq. 5
(5)
(5) :
where are the spectrum with SNV pre-processing. The MSC method offers a similar benefit to the SNV and was used to eliminate the effects of scattering and to enhance the spectral absorption information related to the content of components. Correction is achieved by the following steps. First, the mean of the raw spectrum is calculated. Through this calculation, the corrected spectra received a relatively consistent baseline. Then, simple linear regressions are performed. The regression coefficient is used to correct the baseline scatter by subtracting the regression constant and dividing it the regression coefficient as shown in EquationEq. 6
(6)
(6) and Equation7
(7)
(7) :
where is regression coefficient parameter,
is regression constant parameter, and
are the spectrum with MSC pre-processing.
Modeling method
Partial least squares (PLS) is a popular multivariate statistical analysis .[Citation34] The advantage of this typical linear method is its capability to solve multicollinearity problems, reduce the dimension, and compress the original spectral data. PLS creates a mathematical description of the relationship between the spectral variables (the X-matrix) and the attribute variables (the Y-matrix). First, the X-matrix and the Y-matrix are simultaneously principally decomposed to obtain U of the principal components T and Y of X, as shown in EquationEq. 8(8)
(8) and Equation9
(9)
(9) . Then T and U are regressed to obtain the regression coefficient matrix B (Eq. 10) .[Citation35,Citation36]
where T and U are the scoring matrices of X and Y. P and Q are the load matrices of X and Y. E and F are the introduced errors when the PLS method is used to fit matrices X and Y.
Model evaluation
The performances of models were evaluated by correlation coefficient of calibration (rc), root mean square error of calibration (RMSEC), correlation coefficient of prediction (rp), root mean square error of prediction (RMSEP), and ratio of prediction to deviation (RPD). RPD is derived from the ratio of the standard deviation (Std) of the prediction to the RMSEP value, which was used to measure the prediction performance of models:
where and
are the predicted values of the
sample,
is the measured value of the
sample,
and
are the mean values of sample of calibration and predicted, and nc and np are the numbers of samples of calibration set and prediction set, respectively.
It is noted that, a model with higher correlation coefficient, smaller RMSEC and RMSEP and larger RPD value will has a better performance. A value for the RPD above 2 indicates that the prediction model has a good accuracy. Values for RPD between 1.5 and 2.0 reveal a possibility of non-quantitative prediction, while a value below 1.5 indicates that the calibration is not usable .[Citation37,Citation38]
Results
Textural characteristics
The results of textural parameters are listed in . Under the same parameters, the textural parameter measurement range of each sample set differed, and the range of the calibration set was larger than that of the prediction, thus ensuring that the calibration set could be modeled under suitable conditions. Appropriate range sample data were added to further train and optimize the model and ensure the credibility and efficiency of the model. However, the sample range can be used to predict an unknown sample data range. The model was used for the prediction, and then compared with the sample range to obtain the unknown sample range. In addition, both standard error and average were used to describe the degree of data dispersion. shows that except for H1 (190–200 N) and chewiness (150–230mj), the standard errors of other parameters were small, and the resilience value was the smallest (0.1–0.2). The values of the averages and standard errors were close, indicating that the overall range of the data was large and scattered. The data were not concentrated in one area, which met the conditions required for modeling.
Modeling results
The corrected spectra were acquired at the range of 946 to 2566 nm. To decrease the influence of noise, the spectra at the beginning and at the end were eliminated. Therefore, the range of 963–2510 nm that contained 275 bands was used in the study. Four methods of NONE (named as unprocessed spectrum, i.e., the original spectrum), MC, SNV, and MSC were used to process the spectra, respectively. The results are shown in .
Table 2. Prediction results of kiwifruit texture characteristics by PLS.
shows that the models achieved good accuracy, using four pre-processing methods. In the TPA test, the H1 model worked well, and the values of rc and rp both exceeded 0.9. The effect was best with NONE processing. rc and rp were largest (0.9480 and 0.9352, respectively) and RMSEC and RMSEP were smallest (60.79 N and 72.54 N, respectively). For the chewiness model, the values of rc exceeded 0.9 except for the SNV method. However, the model with MC processing had the largest rp value and the smallest RMSEP (111.32 mj); therefore, the model with MC processing achieved the best effect. In the resilience model, the values of rc and RMSEC were close, and the models using NONE, MC and MSC methods were the same. However, the rp of the former was larger than that of the latter two, and RMSEP was smallest (0.05).
In the puncture test, textural parameters consisted of PH, AH, and CH. The overall effect of the PH model was good (rc value above 0.96). The value of rp was largest under NONE processing, and the RMSEP value was smallest. Comprehensive comparison indicated that the best model was found with the NONE method. For the AH model, the effects of the model were close to 0.95 after NONE, MC and MSC pre-processing methods. However, the rp values of the first two were smaller than that of the latter, and RMSEP only achieved 5.20 N. This indicated that the model with MSC processing was better. For the CH prediction model, although the value of rc with MC processing was slightly lower than that of MSC, the value of rp and RMSEP exceeded those of MSC. Therefore, The CH model with MC processing was considered more effective.
Shear tests used the two textural parameters of SF and ASF. shows that the model with MC pre-processing had the best effect on SF. The rc and rp values were the largest (0.8040 and 0.8572, respectively), and RMSEC and RMSEP values were smallest (13.18 N and 11.33 N, respectively). In the ASF model, it was clear that the NONE pre-processing method was best (rc 0.9901 and rp 0.7960).
The identified optimal model was used to verify the accuracy of the models. In the predicted set, the correlations between predicted and measured values of H1, chewiness, resilience, PH, AH, CH, SF, and ASF are shown in . The correlation coefficient was high between the predicted value and the measured value in each prediction model as shown in ). All values exceeded 0.9, indicating that the predicted value was close to the measured value, which could accurately and reliably predict the quality of samples. The last two prediction models in ) were ordinary, and the correlation coefficients were low. In this way, samples could not be accurately predicted.
Figure 5. Correlation between predicted and measured values of (a) H1 (b) Chewiness (c) Resilience (d) PH (e) AH (f) CH (g) SF (h) ASF.
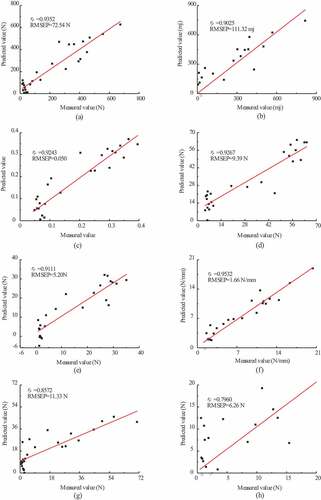
In the optimal model, the RPD values of H1, chewiness, resilience, PH, AH, and CH were 2.72, 2.35, 2.65, 2.19, 2.35, and 3.23, respectively, all of which exceeded 2, and indicated better performance. In the shear test, the RPD values of SF and ASF were 1.21 and 1.68, respectively. In the ASF model, the RPD value ranged between 1.5 and 2, which identified the quality of samples with low requirements. The SF detection model could not be used for the quality detection of samples.
Discussion
In this study, eight textural parameters (H1, chewiness, resilience, PH, AH, CH, SF, and ASF) of kiwifruits were assessed. Among them, chewiness and resilience were found to be the most suitable indexes for the evaluation of fruit quality, which have often been used to assess fruit quality. The hardness indexes (H1, PH, AH and CH) reflected the fruit maturity, freshness, and storage characteristics. SF and ASF also roughly characterized the tenderness of fruit pulp.
These results showed that PH, AH and CH prediction models all achieved good results, CH was the best, followed by PH, while AH was the worst. This result was similar to the conclusion of Shimomura et al’ .[Citation39] Both CH and crispness achieved the best results. The CH model achieved better performance in other fruit quality evaluations. Moreover, three hardness parameters represented different hardness qualities of fruit. PH characterized the freshness of fruit, AH could be used to evaluate maturity of fruit, and CH was used to predict quality changes during storage. If only one hardness parameter was required to directly assess fruit hardness, CH would be the most suitable parameter. Because the calculation of CH not only includes the puncture force but also the puncture displacement, it offers a great advantage for the prediction of fruit quality.
However, the SF and ASF models were not ideal, despite the rp value of 0.8572 and the RMSEP value of 11.33 N of the SF model. This indicated the existence of a correlation between the spectra of samples and the SF parameter. Moreover, the SF model could also be used for the lower undemanding prediction.
Furthermore, the reasons for the poor performance of the shear test parameters were explored. By analyzing the shear test process and combining the problems that occurred in the study of Dahdouh et al,[Citation40] the flesh was hard with little juice at early stage of test, which was conducive to conduct the test. The friction between the cutter and the bottom groove was small, and the error was negligible. At the middle and late stages of the test, the flesh gradually softened and more juice appeared. Consequently, the friction improved and, in the shear process, several samples were squeezed before cutting. The measured value became small, and the relative error was also amplified. This indicates that, they may include systematic errors and accidental errors.
Firstly, instrumental errors will be a main factor. The shear test consisted of a shearing platform and a shearing cutter. The shearing platform was fixed on an experimental platform, the surface of which was slightly inclined. This was a defect of the equipment and could not be remedied. Therefore, it may affect the results.
Secondly, operating errors are a secondary factor. Independent of the type of fruit, their surfaces were always irregular and almost round. During the cutting process, the fruit could therefore easily slip and cause errors. During sample preparation, it is possible that the thickness of a cylindrical pulp was uneven or that the width of a long strip of flesh did not reach or exceed a given width, even when a skilled operator cut the samples. Because of these problems, further experiments will be conducted, where samples will cut with machines instead of manually, to decrease the errors of sample preparation. If all these problems were to be solved, shear test parameters will hold potential for further development into high-precision prediction models in the future.
Methodological errors can also cause poor model results. shows that the fitting degree of each model differed. Some curves fitted better, while others deviated slightly from the true values. Therefore, the fitting degrees of the models were evaluated by the bias, the slope, and the correlation coefficient (rc,rp) to identify models with better generalization performance. The bias and slope were calculated by the results of the selected optimal model, and the results are listed in . For the slope index, the slopes of the regression curves of the PH and SF models were small (below 0.8), while the slopes of other models were closer to 1, indicating an approximately directly proportional function. This indicated that the predicted values of these models were close to the true values and thus, that the performance of the models was good. With regard to the correlation coefficient, the rc value of the SF model was small (only 0.8040), and the rp value of the ASF model was below 0.8. This showed that the correlation between SF, ASF, and the spectrum was low. Moreover, the data points were scattered and thus, the model needs to be improved. Nevertheless, the correlation of other models was still good. With regard to the bias, the values of the H1 and chewiness models were large (indicating large bias). The predicted value deviated from the true value, and an underfitting situation may thus occur. Comprehensive analysis showed that the resilience, AH, and CH models had low bias, with a slope closer to 1 and good correlation. The resilience, PH, AH, CH, SF, and ASF models all had low bias. The slopes of the H1, chewiness, resilience, AH, CH and ASF models were close to 1. H1, chewiness, resilience, PH, AH, and CH models had better correlations. Subsequent research will focus on increasing or decreasing the number of calibration samples to obtain a model with stronger generalization capabilities.
shows that in the preprocessing method, there were more models of the NONE processing and MC processing, and only the AH model used MSC processing. Considering the differences between different pretreatment approaches, the results of the pretreatment method of the optimal model and the original spectral processing method were analyzed. The results are shown in . Comparison showed that, except for the chewiness and AH models, the pretreatment effects of other models did not differ much. More importantly, the use of NONE processing (i.e., the original spectrum) achieved a good effect, and exerted a positive effect on the unified development of multiple models.
These factors may affect the performance of the model and decrease model quality. Therefore, in the future, the shearing conditions will be improved and appropriate methods to analyze the models will be selected to decrease the systematic errors of the model and improve both the accuracy and applicability of the model.
Conclusion
A feasibility study was conducted on the textural characteristics of kiwifruit using HSI technology. Different preprocessing methods (NONE, MC, SNV and MSC) were used to establish PLS prediction models. The results showed that each preprocessing method had a certain effect and could increase the performance of the models. According to bias and slope parameters, and with the exception of the chewiness and AH models, the results showed that the pretreatment effects of other models did not differ much. The model with NONE processing achieved a good effect, which had a positive effect on the unified development of multiple models. The H1, chewiness, resilience, PH, AH, and CH prediction models of kiwifruit were established by the PLS method. The rc values were 0.9480, 0.9768, 0.9452, 0.9642, 0.9504, and 0.9705, respectively. The RMSEC values were 60.79 N, 44.66 mj, 0.039, 6.50 N, 4.08 N, and 1.52 N/mm, respectively. The rp values were 0.9352, 0.9025, 0.9243, 0.9267, 0.9111, and 0.9532, respectively. The RMSEP values were 72.54 N, 111.32 mj, 0.050, 9.39 N, 5.20 N, and 1.66 N/mm, respectively. The values of RPD were 2.72, 2.35, 2.65, 2.19, 2.35, and 3.23, respectively. This indicated that these models had an excellent ability to predict samples. In the ASF model, the former was considered as a quantitative analysis model with low accuracy (rp 0.7960, RPD 1.68). The values of rc and rp were smaller in the SF model (0.8040 and 0.8572, respectively). The RMSEC and RMSEP values were 13.18 N, 11.33 N, respectively, while the RPD value was only 1.21. Therefore, it could not be used to predict the SF of samples. The performance of SF and ASF models should be further studied to increase their accuracy.
It is well known that the textural characteristics of agricultural and sideline products can largely reflect their freshness and maturity, and in the process of harvesting, taking kiwifruit[Citation41] and eggplant[Citation42] as examples, the texture characteristics can be used as the basis for harvesting.In the next study, we further studied the application of spectral-textural modeling in the field beyond agricultural product classification, especially the key technology of unmanned operation in agricultural production and harvesting process, based on the experience of combining textural characteristics and spectral image information of kiwifruit.
Ehtical approval
This article does not contain any studies with human participants or animals performed by any of the authors.
Disclosure statement
No potential conflict of interest was reported by the author(s).
Additional information
Funding
References
- Huang, Z.; Jian, L.; Zhang, J.; Gao, Y.; Hui, G. Physicochemical Properties Enhancement of Chinese Kiwi Fruit (Actinidia Chinensis Planch) via Chitosan Coating Enriched with Salicylic Acid Treatment. J. Food Meas. Charact 2017, 11(1), 184–191. DOI: 10.1007/s11694-016-9385-1.
- Liu, D.; Guo, W. Identifying CPPU-Treated Kiwifruits Using Near-Infrared Hyperspectral Imaging Technology. Food Anal. Methods. 2017, 10(5), 1273–1283. DOI: 10.1007/s12161-016-0681-5.
- Nødtvedt, Ø. O.; Hansen, A. L.; Bjorvatn, B.; Pallesen, S. The Effects of Kiwi Fruit Consumption in Students with Chronic Insomnia Symptoms: A Randomized Controlled Trial. Sleep Biol. Rhythms. 2017, 15(2), 159–166. DOI: 10.1007/s41105-017-0095-9.
- Levine, H., and Finley, J.W. Texture. In Principles of Food Chemistry Dennis, R., Jonhn, Coupland, Mario, Ferryzzi, Richard, W. Hartel, Rubén, Morawicki, S.Suzanne, Nielsen, Juan, L. Silva; Springer International Publishing: Cham, 2018; pp 329–363.
- Liu, Y.-X.; Cao, M.-J., and Liu, G.-M. 17 - Texture Analyzers for Food Quality Evaluation. In Evaluation Technologies for Food Quality Xichang, Zhong, Xichang, Wang; Woodhead Publishing, 2019; pp 441–463.
- Paula, A. M.; Conti-Silva, A. C. Texture Profile and Correlation between Sensory and Instrumental Analyses on Extruded Snacks. J. Food Eng 2014, 121(1), 9–14. DOI: 10.1016/j.jfoodeng.2013.08.007.
- Meenu, M.; Xu, B. Application of Vibrational Spectroscopy for Classification, Authentication and Quality Analysis of Mushroom: A Concise Review. Food Chem 2019, 289, 545–557. DOI: 10.1016/j.foodchem.2019.03.091.
- Vejarano, R.; Siche, R.; Tesfaye, W. Evaluation of Biological Contaminants in Foods by Hyperspectral Imaging: A Review. Int. J. Food Prop 2017, 20(sup2), 1264–1297. DOI: 10.1080/10942912.2017.1338729.
- Feng, C.-H.; Makino, Y.; Oshita, S.; García Martín, J. F. Hyperspectral Imaging and Multispectral Imaging as the Novel Techniques for Detecting Defects in Raw and Processed Meat Products: Current state-of-the-art Research Advances. Food Control. 2018, 84, 165–176. DOI: 10.1016/j.foodcont.2017.07.013.
- Lan, W.; Jaillais, B.; Renard, C. M. G. C.; Leca, A.; Chen, S.; Le Bourvellec, C.; Bureau, S. A Method Using near Infrared Hyperspectral Imaging to Highlight the Internal Quality of Apple Fruit Slices. Postharvest. Biol. Technol 2021, 175, 111497. DOI: 10.1016/j.postharvbio.2021.111497.
- ElMasry, M. G.; Nakauchi, S. Image Analysis Operations Applied to Hyperspectral Images for non-invasive Sensing of Food Quality – A Comprehensive Review. Biosyst. Eng 2016, 142, 53–82. DOI: 10.1016/j.biosystemseng.2015.11.009.
- Weng, S.; Yu, S.; Dong, R.; Pan, F.; Liang, D. Nondestructive Detection of Storage Time of Strawberries Using visible/near-infrared Hyperspectral Imaging. Int. J. Food Prop 2020, 23(1), 269–281. DOI: 10.1080/10942912.2020.1716793.
- Li, Y.; Ma, B.; Li, C.; Yu, G. Accurate Prediction of Soluble Solid Content in Dried Hami Jujube Using SWIR Hyperspectral Imaging with Comparative Analysis of Models. Comput. Electron. Agric 2022, 193, 106655. DOI: 10.1016/j.compag.2021.106655.
- Phuangsombut, K.; Ma, T.; Inagaki, T.; Tsuchikawa, S.; Terdwongworakul, A. Near-infrared Hyperspectral Imaging for Classification of Mung Bean Seeds. Int. J. Food Prop 2018, 21(1), 799–807. DOI: 10.1080/10942912.2018.1476378.
- Steinbrener, J.; Posch, K.; Leitner, R. Hyperspectral Fruit and Vegetable Classification Using Convolutional Neural Networks. Comput. Electron. Agric 2019, 162, 364–372. DOI: 10.1016/j.compag.2019.04.019.
- Li, J.; Zhang, Y.; Liu, M.; Chen, J.; Xue, L. Rapid Detection and Visualization of Mechanical Bruises on “Nanfeng” Mandarin Using the Hyperspectral Imaging Combined with ICA_LSQ Method. Food Anal. Methods. 2019, 12(9), 2025–2034. Available. DOI: 10.1007/s12161-019-01546-z.
- Fazari, A.; Pellicer-Valero, O. J.; Gómez-Sanchıs, J.; Bernardi, B.; Cubero, S.; Benalia, S.; Zimbalatti, G.; Blasco, J. Application of Deep Convolutional Neural Networks for the Detection of Anthracnose in Olives Using VIS/NIR Hyperspectral Images. Comput. Electron. Agric 2021, 187, 106252. DOI: 10.1016/j.compag.2021.106252.
- Garhwal, A. S.; Pullanagari, R. R.; Li, M.; Reis, M. M.; Archer, R. Hyperspectral Imaging for Identification of Zebra Chip Disease in Potatoes. Biosyst. Eng 2020, 197, 306–317. DOI: 10.1016/j.biosystemseng.2020.07.005.
- Pieczywek, P. M.; Cybulska, J.; Szymańska-Chargot, M.; Siedliska, A.; Zdunek, A.; Nosalewicz, A.; Baranowski, P.; Kurenda, A. Early Detection of Fungal Infection of Stored Apple Fruit with Optical Sensors – Comparison of Biospeckle, Hyperspectral Imaging and Chlorophyll Fluorescence. Food Control. 2018, 85, 327–338. DOI: 10.1016/j.foodcont.2017.10.013.
- Siedliska, A.; Baranowski, P.; Zubik, M.; Mazurek, W.; Sosnowska, B. Detection of Fungal Infections in Strawberry Fruit by VNIR/SWIR Hyperspectral Imaging. Postharvest. Biol. Technol 2018, 139, 115–126. Available DOI: 10.1016/j.postharvbio.2018.01.018.
- Yang, D.; Jiang, J.; Jie, Y.; Li, Q.; Shi, T. Detection of the Moldy Status of the Stored Maize Kernels Using Hyperspectral Imaging and Deep Learning Algorithms. Int. J. Food Prop 2022, 25(1), 170–186. DOI: 10.1080/10942912.2022.2027963.
- Li, X.; Wei, Y.; Jie, X.; Feng, X.; Wu, F.; Zhou, R.; Jin, J.; Xu, K.; Yu, X.; Yong, H. SSC and pH for Sweet Assessment and Maturity Classification of Harvested Cherry Fruit Based on NIR Hyperspectral Imaging Technology. Postharvest. Biol. Technol 2018, 143, 112–118. Available DOI: 10.1016/j.postharvbio.2018.05.003.
- Zhu, N.; Lin, M.; Nie, Y.; Wu, D.; Chen, K. Study on the Quantitative Measurement of Firmness Distribution Maps at the Pixel Level inside Peach Pulp. Comput. Electron. Agric 2016, 130, 48–56. DOI: 10.1016/j.compag.2016.09.018.
- Hu, M.-H.; Dong, Q.-L.; Liu, B.-L.; Opara, U. L. Prediction of Mechanical Properties of Blueberry Using Hyperspectral Interactance Imaging. Postharvest. Biol. Technol 2016, 115, 122–131. DOI: 10.1016/j.postharvbio.2015.11.021.
- Sun, M.; Zhang, D.; Liu, L.; Wang, Z. How to Predict the Sugariness and Hardness of Melons: A near-infrared Hyperspectral Imaging Method. Food Chem 2017, 218, 413–421. DOI: 10.1016/j.foodchem.2016.09.023.
- Zhang, H.; Gu, B.; Mu, J.; Ruan, P.; Li, D. Wheat Hardness Prediction Research Based on NIR Hyperspectral Analysis Combined with Ant Colony Optimization Algorithm. Procedia Engineering. 2017, 174, 648–656. DOI: 10.1016/j.proeng.2017.01.202.
- Pu, H.; Sun, D.-W.; Ma, J.; Cheng, J.-H. Classification of Fresh and frozen-thawed Pork Muscles Using Visible and near Infrared Hyperspectral Imaging and Textural Analysis. Meat Sci 2015, 99, 81–88. DOI: 10.1016/j.meatsci.2014.09.001.
- Cheng, J.-H.; Qu, J.-H.; Sun, D.-W.; Zeng, X.-A. Visible/near-infrared Hyperspectral Imaging Prediction of Textural Firmness of Grass Carp (Ctenopharyngodon Idella) as Affected by Frozen Storage. Food Res. Int 2014, 56, 190–198. DOI: 10.1016/j.foodres.2013.12.009.
- Wu, D.; Sun, D.-W.; He, Y. Novel non-invasive Distribution Measurement of Texture Profile Analysis (TPA) in Salmon Fillet by Using Visible and near Infrared Hyperspectral Imaging. Food Chem 2014, 145, 417–426. DOI: 10.1016/j.foodchem.2013.08.063.
- Shiu, J. W.; Slaughter, D. C.; Boyden, L. E.; Barrett, D. M. Effect of the shear-to-compressive Force Ratio in Puncture Tests Quantifying Watermelon Mechanical Properties. J. Food Eng 2015, 150, 125–131. DOI: 10.1016/j.jfoodeng.2014.11.007.
- Zhang, W.; Cui, D.; Ying, Y. Nondestructive Measurement of Pear Texture by Acoustic Vibration Method. Postharvest. Biol. Technol 2014, 96, 99–105. DOI: 10.1016/j.postharvbio.2014.05.006.
- Zhang, L.; Li, G.; Sun, M.; Li, H.; Wang, Z.; Li, Y.; Lin, L. Kennard-Stone Combined with Least Square Support Vector Machine Method for Noncontact Discriminating Human Blood Species. Infrared. Phys. Technol. 2017, 86, 116–119. DOI: 10.1016/j.infrared.2017.08.020.
- Zhao, N.; Wu, Z.; Cheng, Y.; Shi, X.; Qiao, Y. MDL and RMSEP Assessment of Spectral Pretreatments by Adding Different Noises in calibration/validation Datasets. Spectrochim. Acta, Part A: Mol. Biomol. Spectrosc 2016, 163, 20–27. DOI: 10.1016/j.saa.2016.03.017.
- Du, C.; Dai, S.; Qiao, Y.; Wu, Z. Error Propagation of Partial Least Squares for Parameters Optimization in NIR Modeling. Spectrochim. Acta, Part A: Mol. Biomol. Spectrosc 2018, 192, 244–250. DOI: 10.1016/j.saa.2017.10.069.
- Meacham-Hensold, K.; Montes, C. M.; Wu, J.; Guan, K.; Fu, P.; Ainsworth, E. A.; Pederson, T.; Moore, C. E.; Brown, K. L.; Raines, C.; et al. High-throughput Field Phenotyping Using Hyperspectral Reflectance and Partial Least Squares Regression (PLSR) Reveals Genetic Modifications to Photosynthetic Capacity. Remote Sens. Environ. 2019, 231, 111176. DOI: 10.1016/j.rse.2019.04.029.
- Zhang, G.; Peng, S.; Cao, S.; Zhao, J.; Xie, Q.; Han, Q.; Wu, Y.; Huang, Q. A Fast Progressive Spectrum Denoising Combined with Partial Least Squares Algorithm and Its Application in Online Fourier Transform Infrared Quantitative Analysis. Anal. Chim. Acta. 2019, 1074, 62–68. DOI: 10.1016/j.aca.2019.04.055.
- Zhao, Z.; Yan, W.; Yin, H.; Batool, A.; Wang, H.; Yu, H. Quantitative Detection of Turbid Media Components Using Textural Features Extracted from Hyperspectral Images. Microchem. J 2019, 149, 104009. DOI: 10.1016/j.microc.2019.104009.
- Zou, A., and Qu, Y. Identification of Singular Samples in near Infrared Spectrum Correction Set by Using Monte Carlo Cross Validation. In. 2016 4th International Conference on Machinery, Materials and Information Technology Applications Xi'an, China; 2016.
- Shimomura, K.; Horie, H.; Sugiyama, M.; Kawazu, Y.; Yoshioka, Y. Quantitative Evaluation of Cucumber Fruit Texture and Shape Traits Reveals Extensive Diversity and Differentiation. Sci. Hortic 2016, 199, 133–141. DOI: 10.1016/j.scienta.2015.12.033.
- Dahdouh, L.; Delalonde, M.; Ricci, J.; Ruiz, E.; Wisnewski, C. Influence of High Shear Rate on Particles Size, Rheological Behavior and Fouling Propensity of Fruit Juices during Crossflow Microfiltration: Case of Orange Juice. Innovative Food Sci. Emerging Technol 2018, 48, 304–312. DOI: 10.1016/j.ifset.2018.07.006.
- Burdon, J.; Punter, M.; Billing, D.; Pidakala, P.; Kerr, K. Shrivel Development in Kiwifruit. Postharvest. Biol. Technol 2014, 87, 1–5. DOI: 10.1016/j.postharvbio.2013.07.031.
- Valerga, L.; Darré, M.; Zaro, M. J.; Vicente, A. R.; Lemoine, M. L.; Concellón, A. The Plant Age Influences Eggplant Fruit Growth, Metabolic Activity, Texture and shelf-life. Sci. Hortic 2020, 272, 109590. Available. DOI: 10.1016/j.scienta.2020.109590.