
ABSTRACT
The purpose of this study was to determine the heat resistance of isolated Staphylococcus aureus, Salmonella sp., and Escherichia coli bacterial strains obtained from frequently consumed foods (chicken sandwiches, cheese, raw chicken, tahini, and raw meat) in Lebanon. The isolated bacterial strains were heat-treated at 55, 60, 65, 70, and 75°C. The colony-forming unit per gram (CFU.g−1) was recorded for each temperature every minute for 10 min. Survival curves were plotted, and D- and z-values were calculated and compared using a two-sample T-test. All bacterial strains exhibited total resistance to heat at 55°C. Their D60 ranged from 3.00 to 28.80 min, D65 from 0.47 to 1.78 min, D70 from 0.19 to 1.91 min, and D75 from 0.11 to 0.46 min. Their z-values ranged from 4.74 to 19.65°C. When comparing these results to previous years, the need for combined interventions, such as active packaging solution, seems necessary as S. aureus, Salmonella sp., and E. coli are continually developing resistance to thermal processing. This study highlights emerging concerns regarding the safety of certain food products in the market. These results suggest further revising of the associated processing conditions to ensure compliance with food safety standards and avoid foodborne disease outbreaks.
Introduction
According to the Centers for Disease Control and Prevention (CDC), “a foodborne disease outbreak is defined as an incident in which two or more persons experience a similar illness resulting from the ingestion of a common food” .[Citation1] Those diseases involve a large and diverse range of agents, the number of which continues to increase yearly as new agents are identified. Agents like, but not limited to, Staphylococcus aureus, Salmonella sp., Clostridium perfringens, Campylobacter, Listeria monocytogenes, Vibrio parahaemolyticus, Bacillus cereus, and Escherichia coli are considered to be involved in diseases transmitted by foods.[Citation2] C-1: References should be number format? It is estimated that in the United States, around 5 million people get sick each year due to foodborne illnesses, of which 31 known species of pathogens cause around 10 million cases, more than 100,000 are hospitalized, and 3,000 result in fatalities.[Citation3] In Lebanon, the number of food poisoning marked an increase going from 57 cases in 2005, to 510 cases in 2010 and 1,204 cases in 2021. These numbers still hide scores of unreported cases.[Citation4–7]
Public health researchers are of specific interest as they are still strongly associated with foodborne illnesses triggered by consuming contaminated raw food and cross-contamination.[Citation8] When investigating the source of those foodborne diseases, studies indicated the presence of S. aureus, Salmonella, and E. coli in food products from developing countries,[Citation8] including Lebanon.[Citation9–14] Staphylococcus aureus is the cause of 2.6% of foodborne illnesses each year in the U.S. In Europe, the number of staphylococcal food poisoning incidents is also rising. In 2018, there were 114 reported outbreaks caused by staphylococcal toxins, with 1,124 human cases, where only 167 required hospitalizations.[Citation15] Salmonella sp. and E. coli were the cause of 13.3% and 3.6% of the infections in the U.S. in 2020, respectively.[Citation3]
Pasteurization is a relatively mild heat treatment in which liquid foods are mostly heated to below 100°C. It is used to minimize public health hazards from pathogenic microorganisms and to extend the shelf-life of foods for several days or weeks. In general, it has shown to be effective in destroying mesophilic microorganisms such as S. aureus, Salmonella, and E. coli.[Citation16] However, studies showed that bacteria develop resistance to heat when exposed to sub-lethal levels of stress.[Citation17–19] For example, in 2010, a partial increase in resistance of S. aureuswas observed in the presence of many inhibitors (pH, desiccation hydrogen peroxide, etc.) during heat treatment.[Citation17] In fact, during thermal treatment, those three bacterial strains have a heat resistance response to protect themselves from cell destruction. It consists of the production of Heat Shock Proteins that help cells avoid protein denaturation and stabilization of membrane fluidity.[Citation20–22]
Treating foods with higher levels of heat may not constitute an optimal solution, as it tends to negatively alter the sensory and nutritional quality of the food product and therefore hinder consumer acceptance.[Citation16] Therefore, this study aims at determining the current heat resistance attributes of pure S. aureus, Salmonella sp., and E. coli cultures isolated from frequently consumed foods (chicken sandwiches, cheese, chicken, tahini, and raw meat) in Lebanon by exposing them to five temperature levels ranging from 55°C to 75°C, over 10 min. This intends to identify recent changes in the heat level and exposure time needed to eliminate those foodborne pathogens. If such levels were found unreasonable, exploring alternative or synergistic methods to end this vicious thermal resistance cycle would prove necessary.
Materials and methods
Materials
Staphylococcus aureus, Salmonella sp., and E. coli were isolated from highly consumed food products in Lebanon. Staphylococcus aureus and E. coli were isolated using Rapid’Staph Agar (BIO-RAD, France) and RAPID E. coli 2 agar (BIO-RAD, France), respectively. For Salmonella sp., Rappaport Vassiliadis Soya broth (RVSB) (BIO-RAD, France) for enrichment, RAPID’Salmonella agar plates (BIORAD – France) for isolation, Triple Sugar Iron Agar (TSI) (Oxoid Ltd., U.K.) and Lysine Iron Agar (LI) (Oxoid Ltd., U.K.) slants, and API 20E (BioMerieux, France) for confirmation. Latex agglutination test (Pastorex Staph Plus) was used as a confirmation test for S. aureus isolates.
The medium used to grow the conserved bacterial strains was the Brain Heart Infusion (BHI) broth (BIO-RAD, France) and Plate Count Agar (PCA) (BIO-RAD, France) for colony counting. Tryptose Soya Broth (TSB) (OXOID Ltd., U.K.) was the medium employed during the thermal resistance experiment, and peptone water (BIO-RAD, France) was utilized for dilution purposes.
Methods
Food samples collection
A random sample collection of highly consumed food products was accumulated from several sources in the Beirut area. A total of 20 samples were collected from retail and food services, including raw chicken, minced meat, ready-to-eat chicken and meat sandwiches, and tahini in addition to cheese. Bacterial isolation from food samples. Samples were tested according to ISO 16140. Samples were analyzed for the presence of Staphylococcus aureus, Salmonella sp., and E. coli.
For the enumeration of Salmonella sp., selective enrichment was performed in RVSB and incubated at 41.5°C for 8 h. After incubation, 10 µl of the enrichment broth was streaked on RAPID’Salmonella agar plates in duplicates and incubated at 37°C for 24 h. Presumptive colonies were further identified biochemically on TSI, and LI slants were incubated at 37°C for 24 h. Additional confirmation for positive Salmonella spp. colonies were performed by API 20E.
For the enumeration of S. aureus and E. coli, 10 g of the samples were weighed in stomacher bags and homogenized with 90 ml buffered peptone water for 2 min. Serial dilutions were prepared, 0.1 ml was spread in duplicates on Rapid’Staph Agar, and presumptive colonies were further confirmed on the latex agglutination test. Additionally, for the isolation of E. coli, the pour plate technique was adapted; an aliquot of 1 ml was added into Petri dishes using RAPID E. coli 2 agar. All plates were incubated at 37°C for 48 h. Confirmed S. aureus, Salmonella sp., and E. coli isolates were stored in 30% glycerol solution at −20°C to be used in the following tests.
Culture growth
A loop of the bacterial isolate was taken from each frozen isolate, streaked onto PCA, and incubated at 37°C overnight. From the growing bacterial colonies, 5 ml were incubated in a BHI broth test tube at 37°C for 24 h.
Microbial thermal tolerance
A preliminary study was conducted to determine the thermal tolerance of the bacterial isolates at 73°C for 15 s. Among the isolates, the ones that survive this process are considered tolerant and will be tested for thermal resistance. A 10−2 dilution from the BHI tube was done in a TSB that served as a control. A 10−6 dilution in peptone water was prepared to count the colony-forming unit per ml (CFU/ml) in the initial medium; 0.1 ml of the solution was spread on a PCA plate and incubated at 37°C for 24 to 48 h. On the other hand, to test the isolates’ heat tolerance, another 10−2 dilution was done in a TSB medium heated at 73°C for 15 s, and the count of the CFU/ml was done following a serial dilution in peptone water. Viable colonies (25–250) were enumerated, and the most tolerant ones were isolated. Data were obtained in duplicates, and the experiment was done in triplicates.
Heat resistance test
Six serial dilutions from the BHI tube were done in cold peptone water sterile tube. 0.1 ml from the 6th dilution was then spread on a PCA plate and incubated at 37°C for 24 to 48 h for counting. In a preheated water bath, another 10−2 dilution was prepared from the BHI tube in a TSB jar held at 55, 60, 65, 70, and 75°C. Every minute over 10 min, 1 ml was removed from the heated medium and transferred into 9 ml cold peptone water sterile tubes on ice. The bacterial count was done after dilution, plating, and incubation for each temperature and at every minute of sampling. Data were obtained in duplicates, and the experiment was repeated twice.
Calculation of D- and z-values and statistical analysis
The CFU/ml of all bacteria were calculated, and their log10 was plotted against time to obtain their decimal reduction time (D-values) for each temperature. The D-values are the time required to kill 90% of the bacterial population at a specific temperature. In addition, the log D-values were plotted against temperature to obtain the thermal death time (z-values), which is the increase in temperature required to reduce to 10−1 of its previous value, meaning to kill 90% of the bacterial population. Subsequently, the D- and z values were calculated using the following equation: −1/slope (Kennedy et al., 2005). The thermal inactivation reactions of the studied bacteria at different temperatures followed different kinetic models. Statistical analysis using two sample T-test was computed using Excel (Microsoft, USA), considering significance when p < .05, to evaluate differences in bacterial resistance to heat treatments.
Results
Microbial thermal tolerance
Twenty-seven bacteria are isolated from the 20 food samples: 16 Salmonella sp., six E. coli, and five S. aureus. Under pasteurization conditions (73°C for 15 s), only seven out of twenty-seven isolates are considered heat tolerant, and the thermal tolerance data of the seven selected isolates are presented in . In addition, the limits of S. aureus, Salmonella sp., and E. coli in food are 3 to 4, 0, and 2 Log CFU. g−1, respectively. Accordingly, a treatment at 73°C for 15 s is insufficient to reduce the incidence of those three contaminants from the media since the Log CFU. g−1 of all the isolates is still higher than the accepted limits. Therefore, studying their behavior at different temperatures and times is of interest.
Table 1. Log CFU g−1 of S. aureus (St), Salmonella sp. (S), and E. coli (F.C.) isolates before and after heat treatment at 73°C for 15s in TSB medium.
Microbial heat resistance
Staphylococcus aureus: illustrates a higher resilience exhibited by the strain St1 at all temperatures tested compared to St3 (). Heating S. aureus at 55 and 60°C did not affect the death of the two tested isolates (p > .05). after 2 min, a decrease of 1 log cycle was observed at 65 and 70°C with their D-values recordings at 1.91 and 1.78 min, respectively (p < .05). Moreover, St1 did not die off even after 10 min of heating up at 75°C; its D75 was equal to 0.44 min. It was also required to increase the temperature by 12.36°C to inactivate 90% of viable cells of this strain (). The thermal inactivation of ST1 at 60 and 65°C followed a respective 4th and 3rd order polynomial trajectory with an R2 of 0.8, while at 70 and 75°C, it manifested a respective 2nd and 3rd order kinetics with an R2 of 0.9.
Table 2. D-values calculated using the equation D = −1/slope for the plots of surviving cell numbers (log10 CFU) vs. treatment times and z values calculated using the equation z = −1/slope, for the plots of log10 D vs. temperature of S. aureus (St), Salmonella sp. (S) and E. coli (F.C.) isolates at 55, 60, 65, and 75°C. The results of this study were compared to previous studies.
Figure 1. Survivor curves of Staphylococcus aureus isolates a) St1 and b) St3 at 55 (![]()
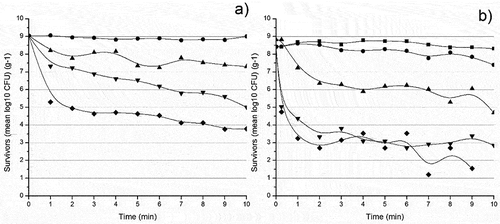
The isolate St3 was considered resilient; however, it did not completely die off at any combination of time and temperature () as well as it was until the temperature reached 65°C that a significant drop in Log CFU.g−1 took place (p < .05). Thermal inactivation of ST2 at 60°C followed a linear trend with a D-value of 11.38 min and continued with 2nd order for 65°C with a D-value of 1.47 min and 3rd order for 70 and 75°C with D70 0.45 min and D75 0.19 min. R2 was equal to 0.8 for all temperature trajectories. As for the z-value, a rise in temperature of 8.57°C was needed to induce a drop of 1 log cycle for this strain ().
Salmonella sp.: Regarding the Salmonella sp. isolates, shows only a slight decrease in the survival rate at 60°C of the S1 isolate, but it becomes more pronounced with the increase in temperature (p < .05). It eventually dies off after 2 min at 70°C. The thermal inactivation of S1 at 60°C followed first-order kinetics with R2 = 0.9 and a D-value of 9.45 min. It continues with a 3rd-order polynomial at 65, 70, and 75°C with R2 of 0.8, 0.9, and 0.9 and D-values of 0.49, 0.19, and 0.19, respectively. The z-value obtained from those D-values was 9.14°C ().
Figure 2. Survivor curves of Salmonella sp. isolates a) S1, b) S4, and c) S7 at 55°C (![]()
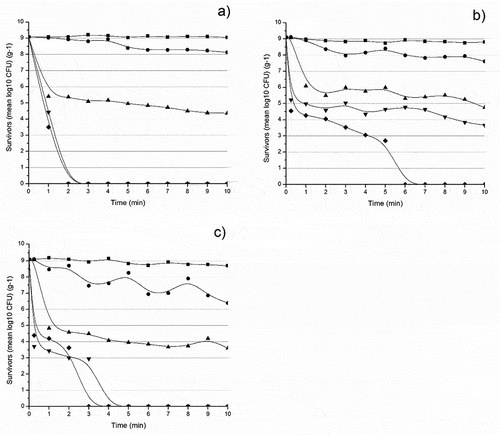
While 55°C still did not affect the death rate of S4 (p > .05), the decreasing trend at 60°C was shown to be a bit steeper; however, it persisted till 6 min at 75°C to completely die off (). The 65°C trajectory represented a 3rd-degree polynomial giving an R2 of 0.9 and a D-value of 0.47 min. The thermal inactivation at 60°C followed a 2nd-order kinetics with R2 equals 0.9 and D-value recording 3.64 min, while 70 and 75°C followed a 5th degree polynomial with their R2 0.8 and 0.9 and their D-values 0.19 and 0.13 min respectively; their calculated z-value was equal to 10.73°C ().
Lastly and again, heating S7 at 55°C for 10 min did not decrease its bacterial log CFU.g−1 (p > .05). However, the 60°C trajectory, as shown in , marked a sharper decline until ultimate death was reached after 4 min at 70°C and after 3 min at 75°C (p < .05). Thermal inactivation at 55°C followed the 4th-order kinetics and continued with 2nd order for 60, 65, 70, and 75°C. All inactivation curves generated a common R2 of 0.8 and D-values of 3.00, 0.69, 0.54, and 0.46 min, respectively, and a z-value of 19.65°C ().
Escherichia coli: Regarding the E. coli isolates, results of FC2 revealed no significant changes at 55 and 60°C (p > .05) in the bacterial behavior, unlike the effect of temperatures 65, 70, and 75°C (p < .05) presented in . The thermal inactivation of FC2 at 60°C followed a linear trend with R2 0.8 and a D-value of 28.8 min. At 65°C, it followed 2nd-order kinetics with an R2 of 0.9 and D-value of 1.02 min, while at 70 and 75°C, it manifested a 6th-order polynomial trajectory with an R2 of 0.8 and a calculated D-value of 0.11 min; their z-value recorded 6.06°C ().
Figure 3. Survivor curves of E. coli isolates a) FC2 and b) FC4 at 55°C (![]()
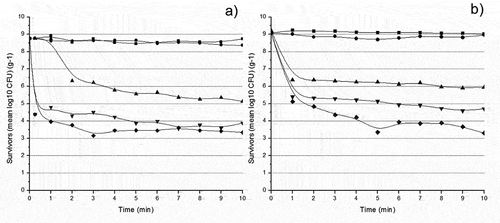
Same as FC2, subjecting FC4 to 55 and 60°C for 10 min did not affect its death rate (p > .05); it was until the temperature increased to 65, 70, and 75°C that we noticed a clear drop in the log CFU.g−1 across the 10 min period (p < .05), as shown in . The thermal inactivation of FC4 at 60, 65, 70, and 75°C followed 3rd-order kinetics with R2 of 0.8, 0.8, 0.8, and 0.9, respectively, and calculated D-values of 7.32, 0.65, 0.50 and 0.38 min respectively. The z-value was calculated from the obtained D-values of 4.74°C ().
Discussion
The studied bacterial isolates of S. aureus, Salmonella sp., and E. coli demonstrate increased heat resistance compared to results obtained in previous studies, which are in accordance with our results presented in . In 2005, the thermal inactivation of S. aureus in TSB resulted in a D55 of 13 to 21.7 min, a D60 of 4.8 to 6.5 min, and a calculated z value ranging from 7.7 to 8.0°C.[Citation23] However, in 2011, the D54 and D55 of several S. aureus isolates obtained from ready-to-eat Indonesian traditional foods logged 13.42–23.8 min and 6.59–14.3 min, respectively, with their z-values ranging from 3.37 to 6.06°C.[Citation24] A recent study on the cell viability of S. aureus in orange juice showed that it needs 60 min to reduce by 5-log the microbial load when the product is treated at 55°C and 35 min to reduce the load by 10-log.[Citation25] In this study, the behavior of the S. aureus isolates at 55°C was similar to their behavior when no heating was involved, and their D60 values were recorded at 10.10 min for St1 and 11.38 min for St3.
The Salmonella isolates S1 isolated from tahini exhibited the highest heat resistance, followed by S7 and S4 isolated from chicken. The former was not affected by thermal heating at 55°C for 10 min and behaved as if no heating intervened. It was until the 5th minute at 60°C that significance was detected, whereas S4 and S7 were significantly affected by heating at 60°C as of the 1st min (). Comparing D60 of S1 (9.45 min), S4 (3.64 min), and S7 (3.00 min) to those of Salmonella Typhimurium isolated from chicken in Jordan in 2013, we notice a remarkable increase in resistance with D58 ranging from 1.06 to 1.30 min, D60 ranging from 0.32 to 0.52 min and z-values ranging from 3.78 to 4.58°C.[Citation26] The z-values in our case were 9.14, 10.73, and 19.65°C for S1, S4, and S7, respectively, which means that it recently requires a minimum of a twofold increase in temperature degrees to reach a 90% decrease in bacterial count. In 2011, thermal inactivation of Salmonella seafood and meat isolates were tested at 55, 60, and 65°C, and their D-values ranged from 7.08 to 7.5 min, 0.45 to 0.86 min, and 0.03 to 0.06 min, respectively with a z value equal to 4.3°C.[Citation27] Moreover, in 2000, to induce a drop of 1 log of Salmonella survival, 1.2 s at 71°C was enough or an increase in temperature by only 5.3°C.[Citation28] In contrast, the heating time should reach 11.4 s for S1 and S4 and 32.4 s for S7 at 70°C to inactivate 1 log of Salmonella cells more than 10 folds.
In 2010, a study reported that at 65°C, E. coli O157:H7 isolated from a traditional South African sausage subsided by 7.5 log CFU in 1.3 min,[Citation29] while results of this study showed a decrease of the FC4 isolate by 3 log CFU in 10 min. Additionally, a temperature of 70°C was used to induce the same drop survival in 1 min, whereas, in this study, 4.5 log CFU decreased in 10 min at the same temperature. As for isolate FC2, the CFU/ml dropped 4 log cycles at 65°C and 5 log cycles at 70°C for up to 10 min. In another study describing the effects of culture conditions on the subsequent heat inactivation of E. coli O157:H7 in apple juice, the highest D55 value among the different treatments was recorded at 4.17 min,[Citation30] while heating at 55°C in this study did not affect the E. coli strains. They behaved as if no heating was involved. The same results were obtained by Gabriel (2012), where the D55 of E. coli from apple juice ranged from 0.9 to 4.43 min.[Citation31] Similarly, in 2011, another strain of E. coli displayed in 10 min a decrease in CFU of around 1 log at 54°C and of about 5 logs at 58°C[Citation32]; whereas FC4 and FC2 strains in this study were affected by thermal treatment neither at 55 nor at 60°C. Their log CFU.g−1 remained constant throughout the 10 min. At 65°C, a clear heat development in heat-resistance of E. coli can be observed, which is explained by a decrease from a 5 log CFU.g−1 drop in 2011[Citation33] to a 3–3.5 log CFU.g−1 drop in the isolates in this study. More evidence of resistance is expressed by D-values comparison over the years. In 2012, D55 ranged from 7 to 9.4 min, D60 from 4.74 to 0.93 min, and D65 from 0.055 to 0.07 min, with a z-value of 4.3°C in a study measuring the inactivation of E. coli O157:H7 from catfish and tilapia[Citation27]; while this present study computed a D60 of 7.32 and 28.82 min and a D65 of 0.65 and 1.02 min, with a z-value of 4.74°C and 6.06°C for FC4 and FC2 respectively. The trend toward higher resistance is obvious as the thermal inactivation of E. coli O157:H7 in coconut liquid endosperm in 2013 was assessed, giving a D55 of 23.20 min .[Citation34] Ma et al. (2020) isolated three E. coli from human cases of acute gastroenteritis that resisted heat inactivation at 60°C; their D60-values exceeded 70 min.[Citation35] When those isolates were tested in grilled ground beef patties, the cell reductions of heat-resistant isolates to 60°C and 71°C remained above 2.8 and 4.9 log CFU/mL, respectively, compared to reductions of 6.1 log CFU/mL and greater in heat-sensitive E. coli .[Citation35]
This study describes the behavior of S. aureus, Salmonella sp., and E. coli isolates in their pure and concentrated state in a liquid-heated medium. This makes them more sensitive and vulnerable to high temperatures as food layers do not protect them. A study on the effect of colony formation on the heat inactivation dynamics of E. coli and Salmonella proved that bacterial cells surrounded by a jellified environment are protected from heat stress and survive longer compared to their presence in a liquid medium.[Citation32] In general, the thermal resistance of bacteria varies due to the complexity of the food matrix. A study showed that the food composition, the water activity, and the drying conditions play a major role in the thermal resistance of Salmonella in food.[Citation36] In another study on an inoculated walnut shell, S. aureus showed higher resistance when the product’s water activity was low. Its D64 value increased from 0.56 to 10.21 min when the product’s water activity decreased from 0.931 to 0.586 .[Citation37]
Critical limits are established for each bacterial species to determine the safety level of food. For S. aureus to induce poisoning and produce symptoms, a minimal amount of less than 1.0 µg of its toxin is enough to be present in the food. This level is reached when S. aureus concentration exceeds 105 CFU.g−1 .[Citation38] Provided the food was initially contaminated with 109 CFU. g−1 before toxin release, as in this study, St3 needs to be heated at 70 or 75°C for more than 15 s and St1 at 75°C for more than 2 min to reach a bacterial population below 105 CFU. g−1. However, S. aureus levels in food should not exceed 103 CFU. g−1 to remain “acceptable” for consumption and should neither exceed 102 CFU.g−1 to be considered “good” for consumption according to the FDA and NSW Food Authority guidelines.[Citation39,Citation40] Therefore, a heat-treatment for ST1 at 75°C for more than 10 min is not enough to reach 103 CFU.g−1. For ST7, a treatment at 70°C for 5 min or 75°C for 2 min is enough to reach the 103 CFU.g−1. To reach 102 CFU. g−1, the medium should be heated at 75°C for 7 min.
According to the Canadian Food Inspection Agency, Salmonella in poultry requires a minimum thermal process that induces a 7D decrease to eliminate this pathogen, as stated in the FDA guidelines.[Citation41] Accordingly, S1 should be treated at 70°C for 2 min, S4 at 75°C for 6 min, and S7 at 70°C for 4 min or 75°C for 2 min to be eliminated from the medium. As for E. coli, its levels should be less than 102 and less than 103 CFU.g−1, respectively, to consider the food satisfactory or acceptable for consumption.[Citation39,Citation40] Unfortunately, FC2 and FC4 could not reach 103 CFU.g−1 even after 10 min heating at 75°C. Thus, the need for exploring and engaging alternative or synergistic methods which are advised to be more effective will ultimately end this vicious thermal resistance cycle and prevent post-cooking recontamination.
Conclusion
The resistance of pathogenic bacterial strains to heat treatments has been widely evaluated over the last few years. Although mesophilic bacteria are considered to be sensitive to pasteurization, they are becoming more resistant due to the heat shock response they are developing and their ability to adapt to environmental stresses such as desiccation, acid, salt, etc. When comparing these results to previous years, the need for combined interventions, such as active packaging solution, seems necessary as pathogens are continually acquiring resistance to heat treatment. This study shows emerging concerns regarding the safety of frequently consumed foods in the Lebanese market. These results highlight further revising of the associated processing conditions to ensure compliance with food safety standards and avoid foodborne disease outbreaks.
Disclosure statement
No potential conflict of interest was reported by the author(s).
References
- CDC. Guide to Confirming an Etiology in Foodborne Disease Outbreak | Foodborne Outbreaks | Food Safety. https://www.cdc.gov/foodsafety/outbreaks/investigating-outbreaks/confirming_diagnosis.html (accessed 2022 February 08).
- Baird-Parker, A. C.;. Food Poisoning: Tracing Origins and Testing. In Encyclopedia of Food and Health; Caballero, B., Finglas, P. M., Toldrá, F., Eds.; Academic Press: Oxford, 2016; pp 72–76. DOI: 10.1016/B978-0-12-384947-2.00318-4.
- Ray, L. C. Decreased Incidence of Infections Caused by Pathogens Transmitted Commonly through Food during the COVID-19 Pandemic — Foodborne Diseases Active Surveillance Network, 10 U.S. Sites, 2017–2020. MMWR Morb. Mortal. Wkly. Rep. 2021, 70. DOI: 10.15585/mmwr.mm7038a4.
- Fadlallah, S. M.; Shehab, M.; Cheaito, K.; Haidar-Ahmad, N.; El Hafi, B.; Saleh, M.; Nasser, Z.; El Hajj, R.; Ghosn, N.; Ammar, W., et al. PulseNet Lebanon: An Overview of Its Activities, Outbreak Investigations, and Challenges. Foodborne Pathog. Dis. 2019, 16(7), 498–503. DOI: 10.1089/fpd.2018.2581.
- MOPH. Notifiable Communicable Diseases. https://www.moph.gov.lb/userfiles/files/Esu_data/Esu_currentyear/Lebanon.htm accessed 2022/February/08.
- MOPH. Ministry of Public Health - Prevention - Surveillance. [cited 2022 May 15]. http://www.moph.gov.lb/Prevention/Surveillance/Pages/Surveillance.aspx.
- Naddaf, A. Food Poisoning Spikes in Lebanon amid Fuel Crisis - Al-Monitor: The Pulse of the Middle East. Al Monitor. Beirut October 16, 2021. https://www.al-monitor.com/originals/2021/10/food-poisoning-spikes-lebanon-amid-fuel-crisis
- Mengistu, D. A.; Tolera, S. T.; Castillo, A. Prevalence of Microorganisms of Public Health Significance in Ready-to-Eat Foods Sold in Developing Countries: Systematic Review and Meta-Analysis. Int. J. Food Sci. 2020, 2020, e8867250. DOI: 10.1155/2020/8867250.
- Al-Mir, H.; Osman, M.; Drapeau, A.; Hamze, M.; Madec, J.-Y.; Haenni, M. WGS Analysis of Clonal and Plasmidic Epidemiology of Colistin-Resistance Mediated by Mcr Genes in the Poultry Sector in Lebanon. Front. Microbiol. 2021, 12, 624194. DOI: 10.3389/fmicb.2021.624194.
- Harb, C.; Mouannes, E.; Zeidan, M. B.; Nour, A. A.; Hanna-Wakim, L. Foodborne Pathogens Dilemma in the Mediterranean Diet: Case of Lebanon. Journal of Food Processing & Technology. 2020. DOI: 10.35248/2157-7110.20.11.832.
- Kassem, I. I.; Nasser, N. A.; Salibi, J. Prevalence and Loads of Fecal Pollution Indicators and the Antibiotic Resistance Phenotypes of Escherichia Coli in Raw Minced Beef in Lebanon. Foods Basel Switz. 2020, 9(11), E1543. DOI: 10.3390/foods9111543.
- Kharroubi, S.; Nasser, N. A.; El-Harakeh, M. D.; Sulaiman, A. A.; Kassem, I. I. First Nation-Wide Analysis of Food Safety and Acceptability Data in Lebanon. Foods. 2020, 9(11), 1717. DOI: 10.3390/foods9111717.
- Malaeb, M.; Bizri, A. R.; Ghosn, N.; Berry, A.; Musharrafieh, U. Salmonella Burden in Lebanon. Epidemiol. Infect. 2016, 144(8), 1761–1769. DOI: 10.1017/S0950268815003076.
- Unicomb, L. E.; Simmons, G.; Merritt, T.; Gregory, J.; Nicol, C.; Jelfs, P.; Kirk, M.; Tan, A.; Thomson, R.; Adamopoulos, J., et al. Sesame Seed Products Contaminated with Salmonella: Three Outbreaks Associated with Tahini. Epidemiol. Infect. 2005, 133(6), 1065–1072. DOI: 10.1017/S0950268805004085.
- EFSA; ECDC. The European Union One Health 2018 Zoonoses Report. EFSA J. 2019, 17(12), e05926. DOI:10.2903/j.efsa.2019.5926.
- Fellows, P. J.;. 2017. 11 - Pasteurization. In Food Processing Technology (Fourth Edition), Fellows, P. J., Ed., 563–580. Sawston, Cambridge: Woodhead Publishing Series in Food Science, Technology and Nutrition; Woodhead Publishing: doi:10.1016/B978-0-08-100522-4.00011-0.
- Cebrián, G.; Sagarzazu, N.; Pagán, R.; Condón, S.; Mañas, P. Development of Stress Resistance in Staphylococcus Aureus after Exposure to Sublethal Environmental Conditions. Int. J. Food Microbiol. 2010, 140(1), 26–33. DOI: 10.1016/j.ijfoodmicro.2010.02.017.
- Lianou, A.; Koutsoumanis, K. P. Evaluation of the Strain Variability of Salmonella Enterica Acid and Heat Resistance. Food Microbiol. 2013, 34(2), 259–267. DOI: 10.1016/j.fm.2012.10.009.
- Ma, L.; Zhang, G.; Gerner-Smidt, P.; Mantripragada, V.; Ezeoke, I.; Doyle, M. P. Thermal Inactivation of Salmonella in Peanut Butter. J. Food Prot. 2009, 72(8), 1596–1601. DOI: 10.4315/0362-028x-72.8.1596.
- Dawoud, T. M.; Davis, M. L.; Park, S. H.; Kim, S. A.; Kwon, Y. M.; Jarvis, N.; O’Bryan, C. A.; Shi, Z.; Crandall, P. G.; Ricke, S. C. The Potential Link between Thermal Resistance and Virulence in Salmonella: A Review. Front. Vet. Sci. 2017, 4, 93. DOI: 10.3389/fvets.2017.00093.
- Li, H.; Gänzle, M. Some like It Hot: Heat Resistance of Escherichia Coli in Food. Front. Microbiol. 2016, 7, 1763. DOI: 10.3389/fmicb.2016.01763.
- Onyango, L. A.; Alreshidi, M. M. Adaptive Metabolism in Staphylococci: Survival and Persistence in Environmental and Clinical Settings. J. Pathog. 2018, 2018, e1092632. DOI: 10.1155/2018/1092632.
- Kennedy, J.; Blair, I. S.; McDowell, D. A.; Bolton, D. J. An Investigation of the Thermal Inactivation of Staphylococcus Aureus and the Potential for Increased Thermotolerance as a Result of Chilled Storage. J. Appl. Microbiol. 2005, 99(5), 1229–1235. DOI: 10.1111/j.1365-2672.2005.02697.x.
- Dewanti-Hariyadi, R.; Hadiyanto, J.; Purnomo, E. H. Thermal Resistance of Local Isolates of Staphylococcus Aureus. As. J. Food Ag-Ind. 2011, 4(4),213-221. http://seafast.ipb.ac.id/publication/journal/thermal-resistance-of-local-isolates-of-staphylococcus-aureus.pdf
- Tahi, A. A.; Sousa, S.; Madani, K.; Silva, C. L. M.; Miller, F. A. Ultrasound and Heat Treatment Effects on Staphylococcus Aureus Cell Viability in Orange Juice. Ultrason. Sonochem. 2021, 78, 105743. DOI: 10.1016/j.ultsonch.2021.105743.
- Osaili, T. M.; Al-Nabulsi, A. A.; Shaker, R. R.; Olaimat, A. N.; Jaradat, Z. W.; Holley, R. A. Thermal Inactivation of Salmonella Typhimurium in Chicken Shawirma (Gyro). Int. J. Food Microbiol. 2013, 166(1), 15–20. DOI: 10.1016/j.ijfoodmicro.2013.06.009.
- Rajkowski, K. T. Thermal Inactivation of Escherichia Coli O157:H7 and Salmonella on Catfish and Tilapia. Food Microbiol. 2012, 30(2), 427–431. DOI: 10.1016/j.fm.2011.12.019.
- Doyle, M. E.; Mazzota, A. S. Review of Studies on the Thermal Resistance of Salmonella. J. Food Prot. 2000, 63(6), 779–795. DOI: 10.4315/0362-028X-63.6.779.
- Charimba, G.; Hugo, C. J.; Hugo, A. The Growth,Survival and Thermal Inactivation of Escherichia Coli O157:H7 in a Traditional South African Sausage. Meat Sci. 2010, 85(1), 89–95. DOI: 10.1016/j.meatsci.2009.12.010.
- Gabriel, A. A.; Nakano, H. Effects of Culture Conditions on the Subsequent Heat Inactivation of E. Coli O157:H7 in Apple Juice. Food Control. 2011, 8(22), 1456–1460. DOI: 10.1016/j.foodcont.2011.03.011.
- Gabriel, A. A. Influences of Heating Temperature,PH, and Soluble Solids on the Decimal Reduction Times of Acid-Adapted and Non-Adapted Escherichia Coli O157:H7 (HCIPH 96055) in a Defined Liquid Heating Medium. Int. J. Food Microbiol. 2012, 160(1), 50–57. DOI: 10.1016/j.ijfoodmicro.2012.09.004.
- Velliou, E. G.; Derlinden, E. V.; Cappuyns, A. M.; Geeraerd, A. H.; Devlieghere, F.; Impe, J. F. V. Heat Inactivation of Escherichia Coli K12 MG1655: Effect of Microbial Metabolites and Acids in Spent Medium. J. Therm. Biol. 2012, 1(37), 72–78. DOI: 10.1016/j.jtherbio.2011.11.001.
- Yoon, Y.; Mukherjee, A.; Geornaras, I.; Belk, K.; Scanga, J.; Smith, G.; Sofos, J. Inactivation of Escherichia Coli O157:H7 during Cooking of Non-Intact Beef Treated with Tenderization/Marination and Flavoring Ingredients. Food Control. 2011, 22(12), 1859–1864. DOI: 10.1016/j.foodcont.2011.04.027.
- Gabriel, A. A.; Arellano, R. U. Decimal Reduction Times of Acid-Adapted and Non-Adapted Escherichia Coli O157:H7,Salmonella Spp., and Listeria Monocytogenes in Young Cocos Nucifera Linn. Liquid Endosperm. Food Control 2014, 37, 21–26. Complete. DOI: 10.1016/j.foodcont.2013.08.019.
- Ma, A.; Glassman, H.; Chui, L. Characterization of Escherichia Coli Possessing the Locus of Heat Resistance Isolated from Human Cases of Acute Gastroenteritis. Food Microbiol. 2020, 88, 103400. DOI: 10.1016/j.fm.2019.103400.
- Dhaliwal, H. K.; Gänzle, M.; Roopesh, M. S. Influence of Drying Conditions, Food Composition, and Water Activity on the Thermal Resistance of Salmonella Enterica. Int. Food Res. J. 2021, 147, 110548. DOI: 10.1016/j.foodres.2021.110548.
- Zhang, L.; Kou, X.; Zhang, S.; Cheng, T.; Wang, S. Effect of Water Activity and Heating Rate on Staphylococcus Aureus Heat Resistance in Walnut Shells. Int. J. Food Microbiol. 2018, 266, 282–288. DOI: 10.1016/j.ijfoodmicro.2017.12.019.
- FDA. Staphylococcus Aureus Toxin Formation in Hydrated Batter Mixes. In Fish and Fishery Products Hazards and Controls Guidance, Chapter 15. USA . 2021, 309-314. https://www.fda.gov/media/80319/download
- FDA. Revised Guidelines for the Assessment of Microbiological Quality of Processed Foods; 2013.
- NSWFA. Microbiological Quality Guide for Ready-to-Eat Foods, A Guide to Interpreting Microbiological Results; NSW/FA/CP028/0906; 2009.
- Silva, F. V. M.; Gibbs, P. A. Thermal Pasteurization Requirements for the Inactivation of Salmonella in Foods. Food Res. Int. 2012, 45(2), 695–699. DOI: 10.1016/j.foodres.2011.06.018.