
 ?Mathematical formulae have been encoded as MathML and are displayed in this HTML version using MathJax in order to improve their display. Uncheck the box to turn MathJax off. This feature requires Javascript. Click on a formula to zoom.
ABSTRACT
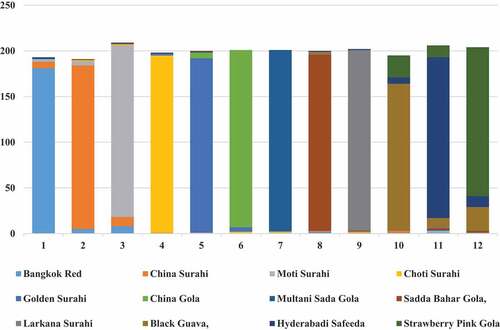
The purpose of this study was to examine the potential of Machine Vision (MV) approaches for the classification and identification of 12 varieties of guava. There are leaf images of the 12 local varieties of guava (Psidium guajava) that include Bangkok Red, China Surahi, Moti Surahi, Choti Surahi, Golden Gola, China Gola, Multani Sada Gola, Sadda Bahar Gola, Larkana Surahi, Black Guava, Hyderabadi Safeeda, Strawberry Pink Gola. A digital camera captured these images of guava varieties in a natural environment. Multi-features were extracted from these images. It was a composite of histograms, binary features, textures, rotational, spectral, and translational features (RST). Total 47 multi-features were collected for each non-overlapping guava leaf image, i.e., and
more, the supervised correlation-based feature selection (CFS) method with the best search algorithm was used to optimize 18 features instead of 47 multi-features. Several ML classifiers, including Instant base Identifier (IBI), Random Forest (RF), and Meta Bagging (MB), using 10-fold cross-validation, were applied to the optimized multi-features. IBI results performed better than other classifiers with an average overall accuracy of 93.01% on AOIs,
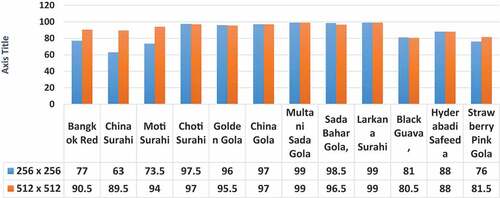
. In addition, IBI detected 90.5%, 89.5%, 94%, 97%, 95.5%, 97%, 99%, 96.5%, 99%, 80.5%, 88%, and 81.5% accuracy values for the 12 varieties of guava leaves, namely Bangkok Red, China Surahi, Moti Surahi, Choti Surahi, Golden Gola, China Gola, Multani Sada Gola, Sadda Bahar Gola, Larkana Surahi, Black Guava, Hyderabadi Safeeda, Strawberry Pink Gola. The proposed study could play a significant role for the early and accurate identification of Guava varieties, and it would also be helpful for export quality measures for the national economy of the country.
Introduction
Precision agriculture includes the accurate classification of plant varieties as one of its primary tasks. Even though plant discrimination requires human skills, knowledge, and expertise, this process is long, labor-intensive, and expensive. Each plant species has its own vein combination that distinguishes it from others and different texture combinations. It has been challenging for an expert’s eyes to distinguish different fruit varieties by observing plant leaves. A computer or mobile-held gadget’s eye (camera) equipped with artificial intelligence may quickly solve this complex problem with high accuracy without incurring huge costs. Several factors identify leaf phenotypes, such as color, shape, venation, tips, roughness, texture, size, and an edge map. The leaves serve as a fingerprint that identifies the type of guava plant.
Machine Vision (MV) techniques can reveal many aspects of natural science to laymen and enhance the expertise of professionals. Morphological features were used to identify plants using inherent methods. It has been found that visual[Citation1] and image analysis are practical tools for identifying diseases on strawberry leaves [anthracnose -resistant germplasm]. A quantitative and qualitative analysis of computer-based images was conducted to determine the percentage of damaged lesion areas on the infected leaves[Citation2] described a pattern recognition method for assessing disease severity and alerting farmers to save their crops.
The recognizing and detecting of the plants and their disease has been discussed in the literature using deep learning techniques.[Citation3] used 35000 infected and healthy leaves for detection and recognition. The mango varieties have been recognized through image processing and their disease identification[Citation4,Citation5] The leaf damaged by different factors has been studied through machine learning algorithms. An analysis of multiclass datasets involving image processing methods and deep learning algorithms has been studied by[Citation6,Citation7] An automatic leaf image-based cultivar label pipeline, namely MFCIS (Multi-Feature Combined Cultivator Identification System), collected through Permanent Homology and a Convolutional Neural Network (CNN) has been proposed by.[Citation8] The olive leaf classification based on their disease through profound convolutional neutral works has been described.[Citation9] Leaf stomatal density (SD) is measured by the number of stomata the leaf image has identified. Leaf thickness is also the feature of the leaf, which has been measured with the proposed model by.[Citation10] The application of deep learning agriculture has been reviewed by.[Citation11]
A variety of approaches, including fusion methods, are used to verify the identification of plants. To identify leaves and flowers, CNN models are used to combine leaf and flower images. The Kernal descriptor (KDES) was applied to leaf-based plant identification on scanned and natural images. KDES worked in three steps as Pixel level, Patch level, and Image level features for the extraction.[Citation12]
Plant leaf recognition through pattern recognition based on shape and multiple-texture features has been discussed in.[Citation13] Deep learning classification needs updating in its functionality and performance. [Citation14,Citation15] Plant phenotyping-driven studies have been well documented by[Citation16] Black rot and chlorosis disease of grapes leaves are identified through a transfer learning approach using a dataset of plant village images. Resnet50 framework is also applied to the same dataset. [Citation17] Image classification of Papaya and disease on leaves are identified by the CNN ResNet50 method.[Citation18 ,Citation19] In this study, they have used various factors to identify damaged areas of the left image, such as image size, image pose, illumination, complex background, different resolution, and image alignment. In addition to extracting guava seed oil, the composition of the fatty acids and their uses have been discussed in.[Citation16]
A guava fruit is considered the fourth (4th) fruit in the world. Guava is also known to be a major source of medical extracts. Among the benefits of guava leaves are anti-inflammatory, antibacterial, anti-oxidant, anti-cough, anti-diabetic, anti-diarrheal, anti-hyperlipidemic, cardio-tective, anti-mutagenic, larvicidal, and hepatoprotective effects. A guava is a fruit that grows in tropical and subtropical regions. Pink guava leaves possess many medicinal properties. The medicinal and nutritional properties of the guava have given the fruit pharmacological significance. It is helpful for the patient who has a deficiency of platelets in the blood and efficient result of recovery from dengue fever. Its fruit contains phytochemical elements, while the leaves contain bacterial and fungi static agents.[Citation20, Citation21] Guava leaves are rich in carotenoids, aldehydes, flavonoids, and tennis vitamins A and C. Its dried leaves powder is entirely medicinal for sugar patients.[Citation22] Pharankrang is also known as red guava. A morphological study of this plant and its future needs as a medicinal plant has been discussed.[Citation23] The principal yields attribute of guava leaf and its by-product through the principal component analysis has been discussed.[Citation24] Due to this, it has become an extraordinary fruit when compared to other types of fruits. Common guava, strawberry, lemon guava, pineapple guava, and apple guava with other local traits of the guava have been discussed. Pakistan, India, Sudan, Egypt, Indonesia, Brazil, Mexico, China, Philippines, Thailand, and Bangladesh are the guava-growing countries of the world. Guava is also considered a commercial plant from leaf to bark.[Citation25] Chemical leaf contents and remedies of the fruit drop of the guava plant have been discussed.[Citation8, Citation11, Citation26–29] Specifically, red guava leaves have a lot of phytochemical elements containing flavonoids, phenolic, tennis, and some essential oils explained in.[Citation30]
Pakistan is a leading exporter of guava pulp and fruit grown in the country. Generally, guava pulp comes in four colors: white, yellow, pink, and red. According to the Economic Wing of the Ministry of National Food Security & Research in Islamabad, Pakistan, April 2020. In Punjab province, Guava ranks sixth in terms of fruit production and has produced 447890 tons. Punjab’s According to the Economic Wing of the Ministry of National Food Security & Research in Islamabad, Pakistan, guavas ranks sixth in fruit production in Punjab province. There were approximately 46650 hectares of guava cultivation in Punjab in 2018. In the last five years, the yield has decreased due to fruit diseases, poor selection of plants, and low fruit quality and quantity. It is necessary to adopt technology (computer vision) to increase the yield of guava fruit. A major challenge facing computer vision and agriculturalists is classifying leaves, particularly guava leaves, which have a higher similarity percentage than other fruits. Domain and expert levels were characterized by complexity, time consumption, and inefficiency.
Guava leaves are largely similar and difficult to identify, even by experts. As detailed in the study, automatic systems are needed to identify guava leaves using fused methods. We can classify and discriminate guava leaves whose shape patterns are complex by using machine learning and deep learning frameworks. We propose a model that is not only useful to growers but also helpful to plant breeders, farmers, seed growers, and pulp manufacturers.
The present study contributes significantly to the field of guava and horticulture in Pakistan and around the world. The results of this study open the door to new research avenues in the field of guava leaves, stems, fruits, and related industries. Through our research farmers and pulp industry professionals will be able to grow better guava fruit by selecting the, best cultivars. This computer vision approach is intended to assist in developing mobile applications for detecting fruit leaves and early diseases. This timely action will assist growers, farmers, and the food industry for sustainable production of the guava fruit.
Materials and methods
This study illustrates the classification of different varieties of guava species with its local names in Pakistan are: Sada Bahar Gola, Moti Surahi, Chotti Surahi, China Gola, Sada Bahar Surahi, Golden Gola, Bangkok Red, Strawberry Pink Gola, Multani Desi Gola, Larkana, Black Guava, Hydrabadi Safeeda. All images have acquired from the fruit farms located at different cities of the Pakistan (Multan, Larkana, Sheikhupura, Lahore, Sharak pur shareef, Sargodha, Rahim Yar khan, Bahawalpur). These varieties are available in Pakistan on this website, https://aari.punjab.gov.pk/” The images were taken with a camera that has a resolution mega pixel. The color and fruit feature of local varieties available in Pakistan are mentioned in . Based on data collected from various guava farms, it has been observed that color is a weak distinguishing feature among varieties of guava. As a result of the analysis, it has been determined that the geometric and texture characteristics of the guava plant leaves are important characteristics for classification. The 200 fresh leaves image of each variety has been subjected to experimental testing after necessary pre-processing. We selected 12 varieties from a pool of locally available varieties.
Table 1. Local Guava Varieties Cultivar in Pakistan.
Preprocessing of the images was carried out in the Anaconda environment using Python to resize images into various sizes like as . Statistics and geometrical features are embedded with spectral features including histogram, second-order statistical texture, binary, rotational, scaling, and translational (RST) features. A fused feature data set of 47 features was developed for each sub-image. A total of
optimized feature spaces were developed through CFS implementation, and a multi-featured dataset for each size of AOIs was generated.
Proposed methodology
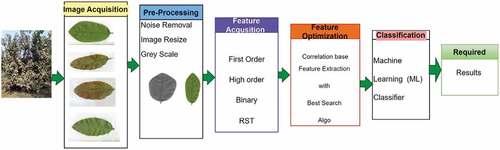
The proposed methodology is described in detail with steps. Image acquisition is followed by pre-processing carried out in the proposed system. A novel segmentation technique, Hybrid Threshold Range-Based Segmentation (HTRS), which is described in Algorithm 1, was successfully applied. Our proposed approach consists of three main steps: First, the HTRS technique was used to calculate the background pixels (BP) values at a particular threshold by considering a complete cluster as the image’s background. Second, this threshold level (BP) was used as a base pixel value to compare all adjacent pixels and complete the entire image. Finally, the gray level pixel value (GP) is considered a foreground pixel (FP) if the gray level value exceeds the background level (BP) and is considered the foreground or AOI. The steps of the proposed methodology are depicted in .
Figure 1. Proposed Methodology of Guava Leaf Discrimination by Classification.
Multi-feature acquisition of the Guava leaf image
Multi-features were acquired for the classification of guava leaves in this study. A series of extracted features include: four first-order histograms, five higher-order texture features, 20 binary features, six spectral features, five geometric features, and seven RST features were extracted by each Area of Interest (AOI). A total of 47 features were extracted for each AOI. A total of 112800 (47x2400) feature space was developed.
First and higher order texture features of Guava leaf
Pixel Intensity value (PIV) is the primary information stored in a pixel of an image. These first and higher order statistical features can be derived by using the probability P(g) described in the Equationequation (i(i)
(i) ) as:
Pixel intensity values were calculated by the five first-order histogram features that were Mean, Standard Deviation, Energy, Skewness, and Entropy. Mean describe the values of PIV in average form. In the above equation: T represents the Total Pixel in the image. L(g) represents the complete instance of the grayscale value of g.
The J represents the gray-scale value range from 0 to 255 while a, and b represents the pixel in the area a and b on the leaf. The next equation is the standard deviation describing the image contrast as:
When the center value is not found symmetric then the asymmetric skew was applied for the above images as in equation (iv)
The distribution of grayscale values is derived by the Energy as in Equationequation (v(v)
(v) ).
The total images of the guava leaves describe the Entropy due to its disorder and uncertainty as in equation (vi)
The texture is a continuous repeating pattern in local variations of image intensity. During the experiment texture feature help out the partitioning of images into their region of interest and classify the specific regions for the identification of the varieties on the basis of arrangements of colors and intensities. Texture features are always based on some common factors such as the gray-level co-occurrence matrix (GLCM). For this study, five second = order features were studied in four different dimensions up to the −3-pixel difference, eight texture features were extracted: Energy, Entropy, Contrast, Homogeneity, Dissimilarity, Correlation, Inertia, and Inverse Difference. The following equations describe some experimental work as:
A GLCM, Pd[I,j] was defined as the first specifying displacement vector d = (dx, dy) and counted all the pairs of pixels separated by d having gray levels i and j.

(viii)
The gray level values obtained by the applying of the Energy. A gray level histogram of an image, measures the gray level. The x-axis shows a gray level from 0 to 255 while the y-axis shows the frequency of the pixels of the image. By using, Energy a threshold was calculated easily in the 12 varieties of guava leaves
Entropy measures the information contents of an image. Entropy was observed, highest when entries in x and y were in the same magnitude, and lowest when entries were found unequal.
Correlation describes the pixel similarity for a particular pixel distance in the above equation (x).
The inverse difference was measured between m and n.
A homogenous image result was in a co-occurrence matrix of guava (Cg) with a combination of high and low P[i,j]s.
By using of Contrast it was easy to measure the local variation in the image. Typically, the k = 2 and n = 1. This contrast describes the inertia.
Some spectral features were used during the classification of the guava leaf images based on texture in the form of power region. These power regions are called rings and the sectors as in the above equation (xvi), which helped in the above study.
Geometric features
The shape features are also called the binary features, such as axis of least second moments, area, Euler number, center area, aspect ratio, projection. Here 36 binary object features were extracted by projection of the normalization of height and width.
The centroid is the intersection of all hyperplanes of symmetry in the image as described in the above equation. The centers are defined by the row and column coordinates. The final orientation is defined in the angle of the axis relative to the vertical axis as described in the (xviii) equation as:
Boundary of the Guava leaf image
Boundaries of the guava leaf images were derived by using the perimeter that defines the total pixels that make the boundary of the image. It was helpful to find the shape also. By labeling it, it counts the number of the pixel ‘1’ with neighboring pixel ‘0.’ The edge detector was used to measure pixel ‘1.’ The thinness ratio was calculated by the ratio of the area and perimeter as described in the equation (xix).
The elongation was observed by the aspect ratio by finding the minimum and maximum values in the columns and rows as shown in the equation (xx). The aspect ratio is the proportional relationship between the width and height of the image.
Topology of the Guava leaf image
The Euler number is the measure of the topology of the image. It describes the total number of the objects and number of the holes in the image.
Euler Number = (Total Number of the Objects – Total Number of the Holes) (xxi)
Projection of the leaf image
The projection describes the shape of the image. The projection profile of an image which one in particular direction always refers to the running sum of pixels in the same direction. This feature helps out to find the varieties of the same species which has a very minor difference. The projection profile basically converts the grayscale image to a binarized/threshold image. The vertical and horizontal projection is shown in the equations (xxii) and (xxiii).
Feature deduction
It was observed that all the extracted features were not equally important for each variety of leaf image. During experimentation, it was noticed that to handle a large dataset was not so easy task for feature optimization purpose and to reduce the dimensionality of large feature space, we have deployed co-relation-based feature selection (CFS) with the best search algorithm on original guava leaf feature space (112800). A reduced 18 multi-feature dataset was acquired, instead of 47 features dataset for each image. A total number of 43200 (18 × 200) optimized feature space was developed by implementing CFS with the best search algorithm. During the optimization process, we have produced the feature space dimensionality without changing the original nature of the guava image’s feature space . describes the list of optimized features
Table 2. Hybrid Threshold Range-Based Segmentation (HTRS).
Table 3. Correlation-based Feature Selection (CFS) List.
Results and discussions
In this study, we applied three machine vision classifiers, namely, Instant base Identifier (IBI), Random Forest (RF), and Meta Bagging (MB) to conduct a comparative analysis of twelve (12), Guava (Psidium Guajava) plant varieties using a fused multi-feature dataset. The proposed result was compared with the review results mentioned above. It was observed that the fusion approach gives outclass results for identifying guava varieties. The leaf images of guava varieties are more similar in their shapes and texture. They cannot be easily identified by the naked eye and simple classifier in their small sizes. For the Area of interest (AOI) the image’s pixel sizes were , the classifiers failed to provide better accuracy and required results were less than 20% accuracy. To acquire better accuracy results, it was decided to increase the AOI size, then we used
and applied the same three classifiers as discussed above in this section. After deploying these classifiers on 256 × 256, we had observed that improvement in results was expectedly were seen. The deployed classifiers, namely IBI, RF, and Meta Bagging were produced accuracy 87.125%, 85.625%, and 80.00%, respectively. These results were satisfactory as per previously acquired results but improvement can be brought by increasing the size of 512 × 512 on same classifiers. It was observed that the results were out performed on AOI size of 512 × 512 and achieved an accuracy of 93.00%, 90.03%, 82.75%, IBI, RF, Meta Bagging, respectively. Furthermore, we tried to enhance the accuracy on the AOI size of (1024 × 1024) but the results dramatically decreased to almost less than 20%. During these experimentations, it was noticed that as AOI size increase and decrease up to some particular extent, It results also variate or change exponentially. Now a specific size of AOI produced better results for the classification. We did perform five experiments on the sample data with a 10-fold cross-validation method. The training and testing data distribution was shown in detail in while image size of (256 × 256) results is in given below .
Table 4. Training and Testing Data Distribution for Experiments.
Table 5. Machine Learning Classifier Performance on Guava Leaves Images of Size (256 × 256).
The different performance measuring parameters like Kappa value, True Positive, False Positive, Receiver-operating characteristics, Mean Absolute Error Values, Root Mean Square Error, Time, Accuracy of image size 256 × 256 illustrated in . The confusion matrix is shown in . The confusion matrix graph of IBI of size (256x256) is shown in .
Figure 2. Machine Learning Classifier Performance on Guava Leaves Images of Size (256 × 256).
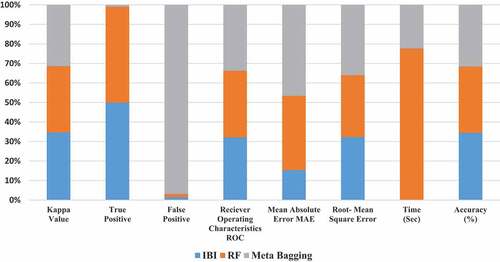
Figure 3. Confusion Matrix Graph of IBI Classifier on Leaves Image Size (256 × 256).
The machine learning classifier performance on Guava leaf images of size (256 × 256) are shown in .
Table 6. Confusion Matrix Table of IBI Classifier on Leaves Image Size (256 × 256).
The machine learning classifier performance on Guava leaf images of size (512 × 512) are shown in . The different performance measuring parameters like Kappa value, True Positive, False Positive, Receiver operating characteristics, Mean Absolute Error Values, Root Mean Square Error, Time, Accuracy of size 512 × 512 are shown in : The Machine learning confusion matrix on Guava leaves images of size (512 × 512) are shown in while graphically performance is shown in .
Table 7. Machine Learning Classifier Performance on Guava Leaves Images of Size (512 × 512).
Figure 4. Confusion Matrix Graph of IBI Classifier on Leaves Image Size (512 × 512).
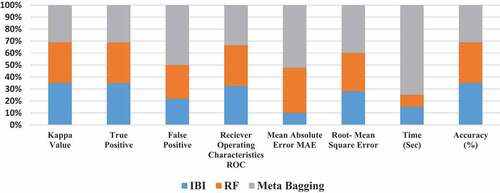
Figure 5. Confusion Matrix Graph of IBI Classifier on Image Size (512 × 512).
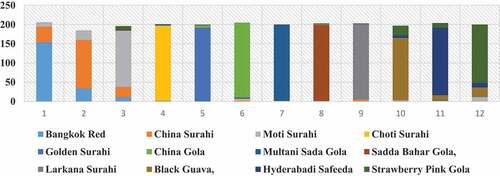
The Comparison of proposed approaches with existing approaches is shown in for guava leaf dataset. The confusion matrix shows the result of 12 varieties of guava plant, namely, Bangkok Red, China Surahi, Moti Surahi, Choti Surahi, Golden Gola, China Gola, Multani Sada Gola, Sadda Bahar Gola, Larkana Surahi, Black Guava, Hyderabadi Safeeda, Strawberry Pink Gola were 90.5%,89.5%,94%,97%,95.5%,97%,99%,96.5%,99%,80.5%,88% and 81.5% in . The Diagonal Values are shaded in the confusion matrix diagonally. Our results were found with better results as compared to the classifiers used before on the different datasets of Flavia, Swedish, LifeClef, and Plant Village datasets. The success of our proposed model is attributed to a few fundamental and prominent factors.
Pre-processing and enhancement of the acquired data to improve accuracy
The multi-feature dataset was developed using fusion methods of the computer vision framework.
Leaf Shape, Texture, Blade Area, and Venation parameters helped to achieve the desired results.
The venation and texture of the leaves were depicted using images of 300–600 dpi.
The background of the leaves was removed in the pre-processing stage, which helped with Blade area findings of 12 species.
Table 8. Confusion Matrix Table for IBI classifier on Image Size (512 × 512).
Table 9. Comparison of Proposed Approaches with Existing Approaches Working on Leaf Dataset.
The following graph in demonstrates the best comparison of the classifier IBI in different sizes of the images include AOI (256 × 256) and (512 × 512).
Figure 6. The Comparison Analysis Graph, on Twelve Varieties of Guava Leaves Images between (256 × 256) and (512 × 512).
Plants play an essential role in medicine, food, industry, and the protection of the environment. Recognizing plants, is beneficial in the agricultural industry from the onset of planting to harvesting the final product. However, identifying plant species that are similar to one another is challenging since it requires a special skill or a more excellent knowledge of that particular plant species. A similar objective to that of the above study was to be achieved. There is a need and value for an automated classification and identification system for plant species since the system can assist specialists and the public in identifying plant species as quickly as possible.
Conclusion
This study focused on classifying “12” different guava fruit plant leaves that describe their diversities, using the most effective Machine Learning (ML) algorithms. The best classifiers were used to accomplish this, including IBI, RF, and Meta Bagging. It has been illustrated that the results of all the classifiers are different. However, IBI performs well, achieving 93.00% accuracy. As a result, the proposed method seems suitable for real-time applications in agricultural fields. The study also led to the development of a mobile application to identify guava leaves for farmers for better production and selection of varieties. There may be an opportunity to utilize data expansion techniques in the future to improve classification accuracy.
Disclosure statement
No potential conflict of interest was reported by the authors.
Correction Statement
This article has been corrected with minor changes. These changes do not impact the academic content of the article.
References
- Yang, J.; Wang, C.; Jiang, B.; Song, H.; Meng, Q. Visual Perception Enabled Industry Intelligence: State of the Art, Challenges and Prospects. IEEE Transactions on Ind. Inf. 2020, 17(3), 2204–2219. DOI: 10.1109/TII.2020.2998818.
- Miller-Butler, M. A.; Smith, B. J.; Curry, K. J.; Blythe, E. K. Evaluation of Detached Strawberry Leaves for Anthracnose Disease Severity Using Image Analysis and Visual Ratings. HortScience. 2019, 54(12), 2111–2117. DOI: 10.21273/HORTSCI14321-19.
- Militante, S. V.; Gerardo, B. D.; Dionisio, N. V. (2019, October). Plant Leaf Detection and Disease Recognition Using Deep Learning. In 2019 IEEE Eurasia Conference on IOT, Communication and Engineering (ECICE), Yunlin, Taiwan (pp. 579–582). IEEE.
- Tabada, W. M.; Beltran, J. G. (2019). Mango Variety Recognizer Using Image Processing and Artificial Neural Network.
- Ullagaddi, S. B.; Raju, S. V. (2017, January). Disease Recognition in Mango Crop Using Modified Rotational Kernel Transform Features. In 2017 4th International conference on advanced computing and communication systems (ICACCS), Coimbatore, India (pp. 1–8). IEEE.
- Sánchez-DelaCruz, E.; Salazar Lopez, J. P.; Lara Alabazares, D.; Tello Leal, E.; Fuentes-Ramos, M. Deep Learning Framework for Leaf Damage Identification. Concurrent Eng. 2021, 29(1), 25–34. DOI: 10.1177/1063293X21994953.
- Tahir, M. B.; Khan, M. A.; Javed, K.; Kadry, S.; Zhang, Y. D.; Akram, T.; Nazir, M. Recognition of Apple Leaf Diseases Using Deep Learning and variances-controlled Features Reduction. Microprocess. Microsyst. 2021, Jan 21, 104027.
- Zhang, Y.; Peng, J.; Yuan, X.; Zhang, L.; Zhu, D.; Hong, P.; Liu, W.; Liu, Q.; Liu, W. MFCIS: An Automatic leaf-based Identification Pipeline for Plant Cultivars Using Deep Learning and Persistent Homology. Hortic. Res. 2021, 8(1), 1–14. DOI: 10.1038/s41438-021-00608-w.
- Uğuz, S.; Uysal, N. Classification of Olive Leaf Diseases Using Deep Convolutional Neural Networks. Neural Comput. Appl. 2021, 33(9), 4133–4149. DOI: 10.1007/s00521-020-05235-5.
- Ciorîță, A.; Tripon, S. C.; Mircea, I. G.; Podar, D.; Barbu-Tudoran, L.; Mircea, C.; Pârvu, M. The Morphological and Anatomical Traits of the Leaf in Representative Vinca Species Observed on Indoor-and Outdoor-Grown Plants. Plants. 2021, 10(4), 622. DOI: 10.3390/plants10040622.
- Zhang, Q.; Liu, Y.; Gong, C.; Chen, Y.; Yu, H. Applications of Deep Learning for Dense Scenes Analysis in Agriculture: A Review. Sensors. 2020, 20(5), 1520. DOI: 10.3390/s20051520.
- Wu, Y. H.; Shang, L.; Huang, Z. K.; Wang, G.; Zhang, X. P. (2016, August). Convolutional Neural Network Application on Leaf Classification. In International Conference on Intelligent Computing (pp. 12–17). Springer, Cham.
- Yang, C. Plant Leaf Recognition by Integrating Shape and Texture Features. Pattern Recognit. 2021, 112, 107809. DOI: 10.1016/j.patcog.2020.107809.
- Hasan, M.; Ullah, S.; Khan, M. J.; Khurshid, K. Comparative Analysis of SVM, ANN and CNN for Classifying Vegetation Species Using Hyperspectral Thermal Infrared Data. In International Archives of the Photogrammetry, Remote Sensing & Spatial Information Sciences 42; Netherland: ISPRS Geospatial, 1861–1868, 2019.
- Tan, C.; Wu, C.; Huang, Y.; Wu, C.; Chen, H.; Zhang, J. Identification of Different Species of Zanthoxyli Pericarpium Based on Convolution Neural Network. PloS one. 2020, 15(4), e0230287. DOI: 10.1371/journal.pone.0230287.
- Goncharov, P.; Ososkov, G.; Nechaevskiy, A.; Uzhinskiy, A.; Nestsiarenia, I. (2018, October). Disease Detection on the Plant Leaves by Deep Learning. In International Conference on Neuroinformatics (pp. 151–159). Springer, Cham.
- Ubbens, J. R.; Stavness, I. Deep Plant Phenomics: A Deep Learning Platform for Complex Plant Phenotyping Tasks. Front. Plant Sci. 2017, 8, 1190. DOI: 10.3389/fpls.2017.01190.
- Veera Balli, R. K.; Nagugari, M. S.; Annavarapu, C. S. R.; Gownipuram, E. V. (2018, December). Deep Learning Based Approach for Classification and Detection of Papaya Leaf Diseases. In International Conference on Intelligent Systems Design and Applications (pp. 291–302). Springer, Cham.
- Tavakoli, H.; Alirezazadeh, P.; Hedayatipour, A.; Nasib, A. B.; Landwehr, N. Leaf image-based Classification of Some Common Bean Cultivars Using Discriminative Convolutional Neural Networks. Computers and Electronics in Agriculture, 181, 105935.techniques. Int. J. Res. Med. Appl. Sci. 2021, 1(4), 46–49.
- Prabhudesai, A. P.; Biyani, D. M.; Umekar, M. J. Psidium Guajava: Multipurpose Medicinal Herb. Int. J. Pharm. Sci. Rev. Res. 2019, 59, 125–132.
- Yu, Y.; Zhang, K.; Yang, L.; Zhang, D. Fruit Detection for Strawberry Harvesting Robot in non-structural Environment Based on Mask-RCNN. Comput. Electron. Agric. 2019, 163, 104846. DOI: 10.1016/j.compag.2019.06.001.
- Chauhan, K.; Negi, S. Anti-Diabetic Property of Catharanthus Roseus Leaves and Psidium Guajava Leaves. J. Adv. Res. in Ayurveda, Yoga, Unani, Siddha and Homeopathy (2394-6547). 2020, 7(1&2), 1–5.
- Kanjanasiri, W. The Knowledge Transfer on Morphology AND the Usefulness of Red Guava Tree “Pharankrang” to Samokae Community, Maung District, Phitsanulok Province. KÉPZÉS ÉS GYAKORLAT: TRAINING AND PRACTICE. 2017, 15(3), 35–42. DOI: 10.17165/TP.2017.3.3.
- Sau, S.; Sarkar, S.; Ghosh, B. Identification of Principal Yield Attributing Traits through Multivariate Analysis of Rainy Season Guava as Influenced by Varied Micronutrient Fertilization. Int. J. Chem. Stud. 2017, 5, 1189–1193.
- Wcdt, S.; Naini, P. A. Review on Utility of an Astonishing Fruit: Psidium Guajava (Guava).2021.
- Vikas, J. K.; Verma, P. Effect of Micronutrients on Growth, Yield and Leaf Nutrient Status in Guava (Psidium Guajava L.) Cultivar Allahabad Safeda. J. Pharmacogn. Phytochem. 2020, 9(6), 392–396.
- Methela, N. J.; Faruk, O.; Islam, M. S.; Mokter, M. Morphological Characterization of Guava Germplasm (Psidium Sp.). J. of Biosc.i and Agric. Res. 2019, 20(1), 1671–1680. DOI: 10.18801/jbar.200119.203.
- Younis, S.; Weiland, C.; Hoehndorf, R.; Dressler, S.; Hickler, T.; Seeger, B.; Schmidt, M. Taxon and Trait Recognition from Digitized Herbarium Specimens Using Deep Convolutional Neural Networks. Botany Letters. 2018, 165(3–4), 377–383. DOI: 10.1080/23818107.2018.1446357.
- Zheng, B.; Zhao, Q.; Wu, H.; Wang, S.; Zou, M. A Comparative Metabolomics Analysis of Guava (Psidium Guajava L.) Fruit with Different Colors. ACS Food. Sci. & Tech. 2020, 1(1), 96–106. DOI: 10.1021/acsfoodscitech.0c00036.
- Hangkaya, F. L.; Priyanto, A. D.; Priyanto, A. D.; Priyanto, A. D. Effects of Solvent to Feed Ratio and Microwave Power on Extraction of Essential Oil from Red Guava Leaves (Psidium Guajava L.) Using Microwave Hydro Distillation Method. Int. J. Eco-Innovation in Sci. Eng. 2020, 1(1), 42–47. DOI: 10.33005/ijeise.v1i01.15.
- Wang, Z.; Sun, X.; Zhang, Y.; Ying, Z.; Ma, Y. Leaf Recognition Based on PCNN. Neural Comput. Appl. 2016, 27(4), 899–908. DOI: 10.1007/s00521-015-1904-1.
- Moraes, P. L. R. D.; Cruz, I. C. L. D.; Coan, A. I.; Tomazello Filho, M. Leaf Venation of Ocotea Species (Lauraceae) from the Reserva Natural Vale; Feddes Repertorium, 132(1): Linhares, Espírito Santo, Brazil, 2021; pp 41–64.
- Pazoki, A.; Pazoki, Z.; Paknejad, F. Leaf Identification of Sesame Varieties Using Artificial Neural Networks (MLP and Neuro-Fuzzy). Int. J. Biosc.| IJB, 3(5): 108–116. 2013.
- Howlader, M. R.; Habiba, U.; Faisal, R. H.; Rahman, M. M. (2019, February). Automatic Recognition of Guava Leaf Diseases Using Deep Convolution Neural Network. In 2019 international conference on electrical, computer and communication engineering (ECCE), Cox'sBazar, Bangladesh (pp. 1–5). IEEE.
- Nagar, P. K.; Satodiya, B. N.; Prajapati, D. G.; Nagar, S. K.; Patel, K. V. (2018).Assessment of Genetic Variability and Morphological Screening of Guava (Psidium Guajava L.) Hybrids.
- Bui, D. Q.; Tran, T. D.; Le, H. T. M.; Nguyen, T. T.; Tran, Y. T. O. Phenotypic Diversity Assessment of Guava (Psidium Guajava L.) Collection in Vietnam. Indian J. Agric. Res. 2021, 55(5), 511–518.
- Srinivas, B.; Satheesh, P.; Rama Santosh Naidu, P.; Neelima, U. Prediction of Guava Plant Diseases Using Deep Learning. In ICCCE 2020 Lecture Notes in Electrical Engineering,vol 698. Springer: Singapore, 2021; pp 1495–1505. https://doi.org/10.1007/978-981-15-7961-5_135
- Reyes, A. K.; Caicedo, J. C.; Camargo, J. E. Fine-tuning Deep Convolutional Networks for Plant Recognition; Colombia: CLEF (Working Notes), 1391, 2015; pp 467–475.
- Thanh-Nhan Nguyen, T.; Le, T. L.; Vu, H.; Nguyen, H. H.; Hoang, V. S. (2017, April). A Combination of Deep Learning and hand-designed Feature for Plant Identification Based on Leaf and Flower Images. In Asian Conference on Intelligent Information and Database Systems (pp. 223–233). Springer, Cham.