
 ?Mathematical formulae have been encoded as MathML and are displayed in this HTML version using MathJax in order to improve their display. Uncheck the box to turn MathJax off. This feature requires Javascript. Click on a formula to zoom.
ABSTRACT
Thirty-four wheat cultivars were used to study the relationship between wheat flour quality and fresh wet noodle (FWN) color when stored at room temperature (25°C) over a 24 h period by the partial least squares regression (PLSR) method. Results showed that quality characteristics of wheat flour and their coefficients of variation differed greatly, and the samples were very representative. During FWN storage, the a* value varied greatly, the L* value decreased, and the b* value increased. The results of the correlation analysis showed that the color of wheat flour had significant correlation with FWN (p <0.05), and FWN color at 0 h had significant correlation with FWN color changes during 24 h storage (p <0.05). Protein, wet gluten, dry gluten, ash content, PPO activity, and water absorption (WA) of wheat flour had significantly negative effects on the L* value of FWN (p <0.05). Peak viscosity (PV), trough viscosity (TV), and breakdown viscosity (BV) of the pasting properties of wheat flour contributed greatly to the L* value (p <0.05), but had significantly negative effects on the a* value (p <0.05). The results showed that quality characteristics of wheat flour profoundly affected FWN color changes during storage, and color, dough strength and pasting properties of wheat flour should be considered comprehensively when selecting the wheat variety for FWN.
Introduction
In China and some other Asian countries, noodles are one of the most important staple foods. In China, about 40% of wheat is used for noodle production.[Citation1,Citation2] Fresh wet noodles (FWNs) are becoming increasingly popular because of their high moisture content and unique flavor compared with other types of noodles.[Citation3] Sensory properties, including color, flavor, texture, and odor, influence what consumers select to eat.[Citation4–6] As consumers’ first sensory impression, color directly affects people’s perceptions of noodles freshness and quality.[Citation1,Citation7] The browning degree of FWN during processing and storage can reflect FWN color stability; browning affects FWN’s sensory quality, worsens noodle flavor, and affects FWN’s shelf life, which is a crucial topic to be solved during FWN’s processing and selling.[Citation8–10]
Noodle color changes are correlated with factors, such as time and temperature,[Citation11–13] processing variables,[Citation14,Citation15] flour proteins,[Citation16,Citation17] milling processes,[Citation18,Citation19] environment,[Citation20,Citation21] and polyphenol oxidase (PPO).[Citation22,Citation23] In general, the recognition that different wheat varieties produce different color noodles, both white salted and alkaline salt, has been well established.[Citation24–26] Our previous research also showed that wheat processing exerted an important influence on FWN color.[Citation27] In order to further study, the relationship between processing quality of wheat and FWN color, different varieties of wheat were selected.
Partial least squares regression (PLSR) is a multivariate statistical analysis method that consists of principal component analysis, canonical correlation analysis, and multiple linear regression analysis.[Citation28,Citation29] This excellent algorithm can establish mathematical models for dependent and independent variables as well as multicollinearity between independent variables.[Citation30] Therefore, PLSR provides outstanding algorithm support for analysis.[Citation31–33] PLSR is widely used for the establishment of quality assessment systems in the food industry[Citation34,Citation35]; however, there is no report about the technology’s application to wheat quality characteristics and FWN.
In this report, 34 wheat cultivars with medium and high gluten contents were selected. After milling, physical, and chemical indexes as well as farinograph, alveograph, and pasting properties were determined. The FWN colors were measured at 0, 1, 4, and 24 h during storage. Descriptive statistical analysis and PLSR were conducted to analyze the influence of these quality characteristics on FWN color during storage, and thus provide theoretical reference for FWN color characteristic improvement and boost the research on FWN special powder.
Materials and methods
Materials
In 2021, 31 widely cultivated wheat varieties from Henan Province and 3 imported wheat varieties (AM, JM1, and JM2) were purchased from Yihai Kerry Arawana Holdings Co., Ltd. (Zhengzhou, Henan, China), and were used in this report.
Flour milling
After the collected wheat varieties were placed for two months, they were cleaned and tempered overnight to 13.5%–14.5% moisture according to wheat hardness (if the hardness index was lower than 60, moisture was adjusted to 13.5%–14.0%, or else moisture was adjusted to 14.0%–14.5%). The wheat was milled to flour by a pilot mill (Model LSM20, Henan, China), with a flour yield of 50%–60%. After the wheat flour was placed at room temperature for one month, various properties were determined, and FWN was made.
Wheat flour’s physicochemical properties: Proteins and moisture contents of flour were determined by a near-infrared spectroscopy (Infratec analyzer 1241, Foss North America) according to the American Association of Cereal Chemists (AACC) methods 39–10 and 46–11 A. Wet gluten, dry gluten, and ash contents were measured according to the approved AACC methods.[Citation36]
PPO activity
PPO activity was determined based on the study of Li et al.;[Citation37] 1.5 g of wheat flour sample was weighed into a 50 mL centrifuge tube, with the addition of 10 mL of 0.2 M Na2HPO4-NaH2PO4 buffer solution (pH 6.0). The sample was vibrated at 4°C for 10 min by an oscillator. The absorbance value A of the reaction system was measured at 410 nm. The same treatments were done with buffer solution instead of enzyme solution as blank control. PPO activity was calculated according to absorbance differences between flour sample and blank control, as follows:
Pasting properties
Pasting properties of different wheat flours were evaluated by a Rapid Visco Analyzer (RVA, Model Super-3, 8Newport Scientific, Warriewood, Australia) referring to the AACC method 76–21.[Citation36] 3 g of wheat flour (14% mb) and 25 mL of distilled water were weighed into an aluminum RVA sample tank, and they were mixed with a plastic paddle before testing. A heating and cooling cycle system was run for testing. The following parameters were determined: pasting temperature (PT) (Unit: °C), peak viscosity (PV) (Unit: cP), trough viscosity (TV) (Unit: cP), final viscosity (FV) (Unit: cP), breakdown viscosity (BV) (Unit: cP), and setback viscosity (SV) (Unit: cP).
Farinograph properties
According to the AACC method 54–22,[Citation36] farinograph properties of flour were analyzed by a 300 g Farinograph-E (Brabender, Duisburg, Germany). Wheat flour was weighed according to its moisture content for a corresponding quantity and was poured into a mixing bowl. A certain amount of water was added to make the maximum consistency of dough close to 500 Fu. The following parameters were recorded: water absorption (WA) (Unit: %), dough development time (DDT) (Unit: min), dough stability (S) (Unit: min), the degree of softening of dough (DS) (Unit: FU), and Farinograph Quality Index (FQI) (Unit: /) .[Citation38]
Alveograph properties
Alveograph properties of wheat flour were determined utilizing Chopin Alveograph (Model Alveographe NG, Chopin, France) according to SR ISO 5530–4:2005.[Citation39] 250 g of wheat flour was weighed into a mixing bowl, with the addition of 2.5% sodium chloride solution by a buret to adjust the moisture content on the same scale as that of the flour sample to be measured. The parameters obtained from the Alveograph curve were P, the maximum pressure is required to blow the dough bubble, showing the resistance of the dough; L, the length of the curve, means the extensibility of the dough; P/L, alveograph curve configuration ratio; W, baking strength (surface area of the curve).
FWN preparation
The noodle formula consisted of wheat flour, purified water, and salt with a proportion of 100:33:2 (w/v/w). 100 g of wheat flour (14% mb) was poured into a needle mixer (Model JHMZ 200, Beijing, China), with addition of 33 g of salt water, and then was stirred for 8 min. The dough crumbs were put into a ziplock bag and matured at room temperature for 30 min, before they were passed through a laboratory noodle maker (Model JMTD 168/140). The spacing between the rollers was adjusted to gradually roll out the FWN sheets with a thickness of 1 mm. Pressed FWN sheets were put into a ziplocked bag and stored at room temperature of 25°C.
Color of wheat flour and color changes of FWN sheets
Color of wheat flour and FWN sheets in each group was measured at 0, 1, 4, and 24 h with a chroma meter (Model CR-400; Konica Minolta Holdings Inc.) according to the method of Li et al.,[Citation40] and the L*, a*, and b* values were recorded. The instrument was calibrated with standard black and white plates. Tests were repeated six times for each sample, and points with large deviations were removed and the average was taken as the final test result. The L* value, standing for brightness, defines black at 0 and white at 100; The a* value indicates redness (green to red), +a* direction for red increase, and -a* direction for green increase; The b* value indicates yellowness (blue to yellow), and the higher the b* value, the more obvious the yellowness.
Statistical analysis
The data obtained in all tables were by means of three replicate measurements. The SPSS 20.0 software was used for descriptive statistical analysis. PLSR (Unscrambler 9.7) was used to conduct correlation and contribution analysis on wheat flour quality characteristics and FWN color indexes, and all data were standardized (1/SD) before processing[Citation41] for fair analysis on the contribution of each variable.
Results and discussions
Statistical analysis of wheat flour indicators
Measurement results of various quality indexes are shown in . The greater the coefficient of variation, the greater the volatility of data. This might be caused by genetic factors of wheat varieties as well as environmental factors during growth, harvest, and preservation of wheat.[Citation42] The protein contents varied from 11.00% to 16.10%, and wet glutens from 27.20% to 41.60%. Thirty-four types of wheat flour featured gluten contents from middle to high. In terms of wheat flour, the L* value had the lowest coefficient of variation (0.5%), while the b* value had the highest coefficient of variation (215.84%). The rheological properties were determined by the farinograph and alveograph, and the coefficient of variation of other indexes except water absorption (WA) was over 20%. It could be inferred that these 34 types of wheat flour selected had different processing quality, and materials used in the study were relatively representative .[Citation43]
Table 1. Wheat quality indicators.
The color of FWN made by the tested wheat varieties at 0 h, 1 h, 4 h, and 24 h
Asenstorfer et al.[Citation44,Citation45] divided the color change of fresh yellow alkaline noodles (YAN) within 24 h at room temperature into three stages: 0–1 h is the first stage, 1–4 h is the second stage, and 4–24 h is the third stage. It is shown in that the averages of L*, a*, and b* of noodles at 0 h were 84.21, 1.60, and 8.82, respectively, within the range of 80.94–87.12, 1.04–2.13, and 6.72–12.43, respectively. Averages of L*, a*, and b* at 24 h was 74.51, 0.63, and 12.33, respectively, within the variation of 68.90–82.06, 0.00–1.21, and 9.04–16.19, respectively. The coefficient of variation of a* was smaller than that of b* when at 0 h, but was the largest when at 1 h, 4 h, and 24 h, namely, 22.44%, 26.43%, and 55.26%, respectively. The results indicated that the a* value of FWN made from different wheat varieties had a great difference, followed by the b* value, while the L* value had the smallest coefficient of variation. As storage at room temperature (25°C) extended, L* and a* values saw a decreasing trend, while b* values saw an increasing trend, which meant that the FWN color became darker and yellower after 24 h storage. This is consistent with previous research results.[Citation6,Citation46] These changes could be due to enzymatic or non-enzymatic reactions, such as polyphenol oxidase, peroxidase, Maillard reaction, and caramelization browning reaction .[Citation47–49]
Table 2. Color indexes of FWN made from selected wheat cultivars.
Correlation between wheat flour’s quality characteristics and FWN color
PLSR was applied to analyze the correlation between wheat flour’s quality characteristics and FWN color. The physicochemical, farinograph, alveograph, and pasting properties of wheat flour were X variables, and the color indexes of FWN stored at room temperature at 0 h, 1 h, 4 h, and 24 h were Y variables for multi-independent multivariate analysis (PLS2). The established PLS2 model contained three principal components revealed 92% cross-validation variance, indicating that the model could successfully reflect samples’ overall information. Among them, the first two principal components (PC1 and PC2) described 85% of the cross-validation variance, while more principal components (PCs) did not provide more useful information. Therefore, only the correlation loading plot of the first two principal components (PC1 and PC2) was presented here (). As shown in , most of the X variables and all of the Y variables fell between the inner and outer ellipses, showing an interpretation variance of 50% and 100%, respectively, which indicated that these variables could be well explained by the PLSR model. The variable circled in the graph indicated the significant variable.
Figure 1. Loading plot of correlation between wheat flour’s quality characteristics and FWN color indexes based on PLSR.
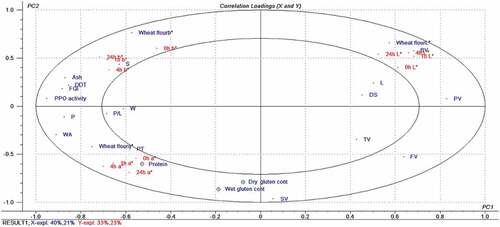
It could be seen in that on the principal component PC1, the L* value of FWN during storage as well as the L* value, breakdown viscosity (BV), peak viscosity (PV), final viscosity (FV), and setback viscosity (SV) of wheat flour were all located on the right side of the loading plot; The a* and b* values of FWN during storage, as well as the a* value, b* value, protein, wet gluten, dry gluten, PPO activity, ash content, and water absorption (WA) of wheat flour were located on the left side of the loading plot; all were concentrated outside the 50% interpretation variance. The results showed that FWN’s L* value was positively correlated with wheat flour’s L* value, breakdown viscosity (BV), peak viscosity (PV), final viscosity (FV), and setback viscosity (SV), and negatively correlated with wheat flour’s a* value and b* value, protein, wet gluten, dry gluten, PPO activity, ash content, and water absorption (WA) rate; the a* and b* values during FWN storage showed completely opposite correlations with wheat flour’s quality characteristics to FWN’s L* value.
Correlation analysis of color during FWN storage
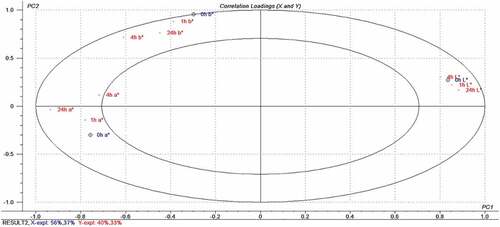
PLSR was utilized to analyze the relationship between the color indexes of FWN stored at room temperature at 0 h and those at 1 h, 4 h, and 24 h. PLSR analysis was conducted for FWN color at 0 h as X variable and color indexes at 1 h, 4 h, and 24 h as Y variable. The analysis results are shown in . revealed that all color indexes of FWN during storage were distributed in the area between large and small ellipses, indicating that these variables could be well explained by the PLSR model. The L* values at 0 h, 1 h, 4 h, and 24 h were located on the right side of the loading plot. The a* value and b* value from 0 h to 24 h were located on the left side of the loading plot. In addition, the L*, a*, and b* values at 0 h were marked with small circles, denoting that the color at 0 h was closely correlated with the color change during FWN’s 24-h storage, which could be used to predict color changes of FWN during storage.
Figure 2. Correlation loading plot of color indexes of fresh wet noodles during storage at room temperature based on PLSR.
Analysis of contributions of wheat flour’s quality characteristics to FWN color indexes
In order to further analyze contributions of wheat flour’s quality characteristics to each FWN color index, the jack-knife uncertainty test method was adopted to calculate the estimated regression coefficient and analyze contributions of wheat flour’s quality characteristics to FWN color indexes based on PLS1 (). The “column chart” in represents contributions of variables to color, “up” for contributions of variables to color, and “down” for the negative impact of variables on color. The column with “diagonal” indicated that the X variable had a significant impact on the corresponding color index.
Figure 3. Contribution of wheat flour’s quality characteristics to FWN color indexes.
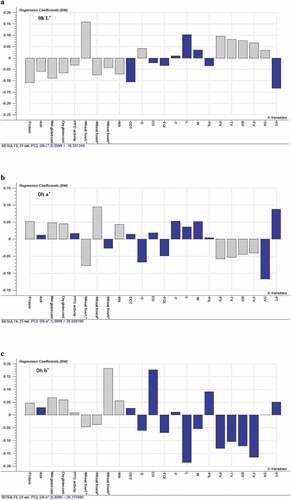
The contribution analysis results of wheat flour’s quality characteristics to FWN color at 0 h are shown in . From , it was known that the L* value, dough stability (S), peak viscosity (PV), trough viscosity (TV), breakdown viscosity (BV), final viscosity (FV), and setback viscosity (SV) of wheat flour significantly contributed to FWN’s L* value (p <0.05). Protein, ash, wet gluten, dry gluten content, PPO activity, the a* value of wheat flour, the b* value of wheat flour, and water absorption (WA) had a significantly negative effect on FWN’s L* value (p <0.05). Protein, wet gluten, dry gluten content, the a* value of wheat flour and water absorption (WA) had great contributions to FWN’s a* value (p <0.05), while wheat flour’s L* value, peak viscosity (PV), trough viscosity (TV), breakdown viscosity (BV), and final viscosity (FV) could significantly reduce FWN’s a* value (p <0.05). Protein, wet gluten, dry gluten content, PPO activity, the b* value of wheat flour, and water absorption (WA) significantly increased the b* value of FWN color, L* value of wheat flour, a* value of wheat flour, and setback viscosity (SV) had a significantly negative effect on FWN’s b* value.
In addition, it was found that dough development time (DDT), P/L, and pasting temperature (PT) had a negative effect on FWN’s L* value but a positive influence on the a* and b* values of FWN.
The color of flour significantly affected the quality of wheat’s end-use products.[Citation25,Citation50,Citation51] In this study, the FWN color was significantly correlated with the color of wheat flour stored at normal temperature storage (p <0.05). It is generally believed that protein contents and ash contents have an important influence on the color of flour and products.[Citation25,Citation46,Citation52–54] It was also found that the protein, wet gluten, and dry gluten content of wheat flour had a significant influence on FWN color (p <0.05) in our study, indicating that in the process of raw material screening, color as well as protein and other quality indicators should be paid attention to. Water absorption (WA) had a significant influence on the FWN color (p <0.05), that is, the higher the water absorption of wheat flour, the darker and yellower the FWN. This could be related to the increase in moisture that increases PPO activity in flour, which makes it easier to catalyze the oxidation of phenolic substances into quinones and form brown precipitates by self-polymerization or reaction with other substances. PPO activity of wheat flour had a negative effect on its color during FWN production.
Proteins contain nitrogen, which is required to participate in the formation of melanin in the non-enzymatic browning reaction, so the protein content has an important influence on noodle color. Proteins significantly affected the farinograph water absorption and alveograph extensibility flour.[Citation55] Meanwhile, if the protein content is high, the starch content will be relatively reduced, and the texture of the noodles prepared will be more compact, and the reflected light will be reduced. The pasting properties of flour are related to protein and starch content.[Citation56]
Conclusion
In this study, the quality indexes of 34 wheat flour varieties were analyzed statistically. The quality characteristics of wheat flour and their coefficient of variation differed greatly demonstrated that the samples were very representative. When FWN were placed at room temperature, the L* value showed a decreasing trend, while the b* value showed an increasing trend. PLSR was used to analyze the relationship between the color of FWN stored at room temperature at 0 h as well as the color indexes at 1 h, 4 h, and 24 h. It was discovered that the FWN color at 0 h was significantly correlated with the FWN color changes over a 24 h storage. It was found that FWN color was highly correlated with wheat flour’s color indexes. The contents of protein, wet gluten, dry gluten and water absorption (WA) of wheat flour had a significant effect on FWN color (p <0.05). PPO activity and ash content of wheat flour had a negative effect on its color during FWN production. It was also shown that wheat flour’s pasting properties, such as peak viscosity (PV), trough viscosity (TV), and breakdown viscosity (BV), also had an important influence on FWN color. Therefore, in the selection of wheat varieties for FWN, we should not only pay attention to wheat flour materials with bright white color and suitable dough glutens but also take the dough pasting properties and other related indexes into account.
Highlights
PLSR is first applied for studying the relationship between wheat flour’s quality characteristics and color of FWN.
The color at 0 h could be used to predict color changes of FWN during storage.
Wheat flour’s pasting properties have an important influence on the FWN color (p<0.05).
FWN color is highly correlated with wheat flour’s color indexes (p<0.05).
Author contributions
Yaqing Wen: Conceptualization, Methodology, Validation, Formal analysis, Investigation, Writing–original draft. Shunshun Lin: Methodology, Validation, Formal analysis, Investigation, Writing–original draft. Xuejie Li: Methodology, Validation, Formal analysis, Investigation, Writing—original draft. Jian Zhang: Conceptualization, Investigation, Writing–review and editing, Supervision, Funding acquisition. Yang Zhao: Methodology, Validation, Formal analysis, Investigation. Dongyun Ma: Methodology, Formal analysis. Mengqin Li: Investigation, Writing–review and editing. Xiujuan Ren: Investigation, Writing–review and editing. Weifeng Zhang: Investigation, Writing–review and editing.
Acknowledgments
The authors appreciate the financial fund from the Key Scientific and Technological Research Projects of Henan Province (No.202102110133), Special Innovation Fund of Henan Agricultural University (No. KJCX2019C04).
Disclosure statement
No potential conflict of interest was reported by the author(s).
Additional information
Funding
References
- Wu, X. T.; Guo, X. N.; Zhu, K. X. Inhibition of Aspartic Acid on the Darkening of Fresh Wet Noodles. Int. J. Food Sci. Tech. 2022, 57(1), 390–399. DOI: 10.1111/ijfs.15436.
- Li, M.; Ma, M.; Zhu, K. X.; Guo, X. N.; Zhou, H. M. Delineating the physico-chemical, Structural, and Water Characteristic Changes during the Deterioration of Fresh Noodles: Understanding the Deterioration Mechanisms of Fresh Noodles. Food Chem. 2017, 216, 374–381. DOI: 10.1016/j.foodchem.2016.08.059.
- Chen, Y.; Chen, G.; Wei, R.; Zhang, Y.; Li, S.; Chen, Y. Quality Characteristics of Fresh Wet Noodles Treated with Nonthermal Plasma Sterilization. Food Chem. 2019, 297, 124900. DOI: 10.1016/j.foodchem.2019.05.174.
- Prayitno, S. A.; Mardiana, N. A.; Rochma, N. A. Sensory Evaluation of Wet Noodle Products Added with Moringa Oleifera Flour with Different Concentrations. Kontribusia Res. Diss. Comm. Dev. 2021, 42, 450–454. DOI:10.30587/kontribusia.v4i2.2738.
- Grafenauer, S.; Miglioretto, C.; Solah, V.; Curtain, F. Review of the Sensory and physico-chemical Properties of Red and White Wheat: Which Makes the Best Whole Grain? Foods. 2020, 9(2), 136. DOI: 10.3390/foods9020136.
- Siah, S.; Quail, K. J. Factors Affecting Asian Wheat Noodle Color and Time‐dependent discoloration—A Review. Cereal Chem. 2018, 952, 189–205. DOI:10.1002/cche.10035.
- Wu, X. T.; Guo, X. N.; Zhu, K. X. Inhibition of l-cysteine on the Browning of Fresh Wet Noodles. Foods. 2021, 10(6), 1156. DOI: 10.3390/foods10061156.
- Cappelli, A.; Bini, A.; Cini, E. The Effects of Storage Time and Environmental Storage Conditions on Flour Quality, Dough Rheology, and Biscuit Characteristics: The Case Study of a Traditional Italian Biscuit (Biscotto Di Prato). Foods. 2022, 11(2), 209. DOI: 10.3390/foods11020209.
- Cappelli, A.; Lupori, L.; Cini, E. Baking Technology: A Systematic Review of Machines and Plants and Their Effect on Final Products, Including Improvement Strategies. Trends Food Sci. Tech. 2021, 115, 275–284. DOI: 10.1016/j.tifs.2021.06.048.
- Hatcher, D. W.; Symons, S. J.; Kruger, J. E. Measurement of the Time‐dependent Appearance of Discolored Spots in Alkaline Noodles by Image Analysis. Cereal Chem. 1999, 76(2), 189–194. https://doi.org/10.1094/CCHEM.1999.76.2.189.
- Hatcher, D. W.; Symons, S. J. Assessment of Oriental Noodle Appearance as a Function of Flour Refinement and Noodle Type by Image Analysis. Cereal Chem. 2000, 77(2), 181–186. DOI: 10.1094/CCHEM.2000.77.2.181.
- Hatcher, D. W.; Symons, S. J. Image Analysis of Asian Noodle Appearance: Impact of Hexaploid Wheat with a Red Seed Coat. Cereal Chem. 2000, 77(3), 388–391. DOI: 10.1094/CCHEM.2000.77.3.388.
- Li, M.; Ma, M.; Zhu, K. X.; Guo, X. N.; Zhou, H. M. Critical Conditions Accelerating the Deterioration of Fresh Noodles: A Study on Temperature, pH, Water Content, and Water Activity. J. Food Process. Pres. 2017, 41(4), e13173. DOI: 10.1111/jfpp.13173.
- Solah, V. A.; Crosbie, G. B.; Huang, S.; Quail, K.; Sy, N.; Limley, H. A. Measurement of Color, Gloss, and Translucency of White Salted Noodles: Effects of Water Addition and Vacuum Mixing. Cereal Chem. 2007, 84(2), 145–151. DOI: 10.1094/CCHEM-84-2-0145.
- Vadlamani, K. R.; Seib, P. A. Reduced Browning in Raw Oriental Noodles by Heat and Moisture Treatment of Wheat. Cereal Chem. 1996, 73(1), 88–95.
- Wang, C.; Kovacs, M. I.; Fowler, D. B.; Holley, R. Effects of Protein Content and Composition on White Noodle Making Quality: Color. Cereal Chem. 2004, 81(6), 777–784. DOI: 10.1094/CCHEM.2004.81.6.777.
- Liao, H. J.; Chen, Y. L. Characteristics and Protein Subunit Composition of Flour Mill Streams from Different Commercial Wheat Classes and Their Relationship to White Salted Noodle Quality. Cereal Chem. 2015, 92(3), 302–311. DOI: 10.1094/CCHEM-09-14-0195-R.
- Zhang, Y.; Quail, K.; Mugford, D. C.; He, Z. Milling Quality and White Salt Noodle Color of Chinese Winter Wheat Cultivars. Cereal Chem. 2005, 82(6), 633–638. DOI: 10.1094/CC-82-0633.
- Ma, D.; Zhang, Y.; Xia, X.; Morris, C. F.; He, Z. Milling and Chinese Raw White Noodle Qualities of Common Wheat near-isogenic Lines Differing in Puroindoline B Alleles. J. Cereal Sci. 2009, 50(1), 126–130. DOI: 10.1016/j.jcs.2009.03.006.
- Hatcher, D. W.; Symons, S. J. Influence of Sprout Damage on Oriental Noodle Appearance as Assessed by Image Analysis. Cereal Chem. 2000, 77(3), 380–387. DOI: 10.1094/CCHEM.2000.77.3.380.
- Hatcher, D. W.; Anderson, M. J.; Clear, R. M.; Gaba, D. G.; Dexter, J. E. Fusarium Head Blight: Effect on White Salted and Yellow Alkaline Noodle Properties. Can. J. Plant Sci. 2003, 83(1), 11–21. DOI: 10.4141/P01-194.
- Zhao, Y.; Huang, Z. H.; Zhou, H. M.; Zhu, K. X.; Guo, X. N.; Peng, W. Inhibition of Hexose Oxidase on the Dark Spots in Fresh Wet Noodle Sheets: A Feasible Prevention of Dark Spots. Food Chem. 2021, 339, 128021. DOI: 10.1016/j.foodchem.2020.128021.
- Zhao, Y.; Huang, Z. H.; Zhou, H. M.; Zhu, K. X.; Guo, X. N.; Peng, W. Polyphenol Oxidase Browning in the Formation of Dark Spots on Fresh Wet Noodle Sheets: How Dark Spots Formed. Food Chem. 2020, 329, 126800. DOI: 10.1016/j.foodchem.2020.126800.
- Seib, P. A.; Liang, X.; Guan, F.; Liang, Y. T.; Yang, H. C. Comparison of Asian Noodles from Some Hard White and Hard Red Wheat Flours. Cereal Chem. 2000, 77(6), 816–822. DOI: 10.1094/CCHEM.2000.77.6.816.
- He, Z. H.; Yang, J.; Zhang, Y.; Quail, K. J.; Pena, R. J. Pan Bread and Dry White Chinese Noodle Quality in Chinese Winter Wheats. Euphytica. 2004, 139(3), 257–267. DOI: 10.1007/s10681-004-3283-z.
- Davies, J.; Berzonsky, W. A. Evaluation of Spring Wheat Quality Traits and Genotypes for Production of Cantonese Asian Noodles. Crop Sci. 2003, 43(4), 1313–1319. DOI: 10.2135/cropsci2003.1313.
- Zhao, Y.; Huang, Z. H.; Zhou, H. M.; Zhang, J.; Ma, L. Preventing the Browning of Fresh Wet Noodle Sheets by Aqueous Ozone Mixing: Browning and Physicochemical Properties. J. Cereal Sci. 2022, 104, 103428. DOI: 10.1016/j.jcs.2022.103428.
- Lin, S. H. I.; Li, Z. L.; Tao, Y. U.; Li, J. P. Model of Hot Metal Silicon Content in Blast Furnace Based on Principal Component Analysis Application and Partial Least Square. J. Iron Steel Res. Int. 2011, 18(10), 13–16. DOI: 10.1016/S1006-706X(12)60015-6.
- Wold, S.; Sjöström, M.; Eriksson, L. PLS-regression: A Basic Tool of Chemometrics. Chemometr Intell Lab. 2001, 582, 109–130. DOI:10.1016/S0169-7439(01)00155-1.
- Mateos-Aparicio, G. Partial Least Squares (PLS) Methods: Origins, Evolution, and Application to Social Sciences. Commun Stat-Theor M. 2011, 40(13), 2305–2317. DOI:10.1080/03610921003778225.
- Fan, D.; Huang, W.; Liu, T. C. Y.; Zhang, X.; Li, W.; Gao, X.; Meng, Y. Quantitative Analysis of Blended Oils by Confocal Raman Spectroscopy and Chemometrics in Situ. Food Control. 2022, 142, 109244. DOI: 10.1016/j.foodcont.2022.109244.
- Nguyen, N. L.; Bui, V. H.; Pham, H. N.; To, H. M.; Dijoux-Franca, M. G.; Vu, C. T.; Nguyen, K. O. T. Ionomics and Metabolomics Analysis Reveal the Molecular Mechanism of Metal Tolerance of Pteris Vittata L. Dominating in a Mining Site in Thai Nguyen Province. Vietnam. Environ Sci Pollut R 2022, 1–13. DOI: 10.1007/s11356-022-21820-8.
- Wang, J.; Wang, X.; Pan, W.; Li, J.; Xue, L.; Li, S.; Bentsink, L. Seed Germination Traits and Dormancy Classification of 27 Species from a Degraded Karst Mountain in Central Yunnan–Guizhou Plateau: Seed Mass and Moisture Content Correlate with Germination Capacity. Plant Bio. 2022, 24(6), 1043–1056. DOI:10.1111/plb.13451.
- Li, W.; Huang, W.; Fan, D.; Gao, X.; Zhang, X.; Meng, Y.; Cheng, T. C. Y. 2022 Rapid Quantification of Goat Milk Adulteration with Cow Milk Using Raman Spectroscopy and Chemometrics. Research Square. doi:10.21203/rs.3.rs-1826753/v1.
- Zhou, J.; Wu, X.; Chen, Z.; You, J.; Xiong, S. Evaluation of Freshness in Freshwater Fish Based on near Infrared Reflectance Spectroscopy and Chemometrics. LWT. 2019, 106, 145–150. DOI: 10.1016/j.lwt.2019.01.056.
- American Association of Cereal Chemists. Approved Methods of the AACC: Method 76‐21, 10th; St Paul: AACC International: 2000.
- Li, X. J.; Wen, Y. Q.; Zhang, J.; Ma, D. Y.; Zhang, J.; An, Y. X.; Song, X. Y.; Ren, X. J.; Zhang, W. F. Effects of Non‐thermal Plasma Treating Wheat Kernel on the Physicochemical Properties of Wheat Flour and the Quality of Fresh Wet Noodles. Int. J. Food Sci. Tech. 2022, 57(3), 1544–1553. DOI: 10.1111/ijfs.15514.
- Venturi, M.; Cappelli, A.; Pini, N.; Galli, V.; Lupori, L.; Granchi, L.; Cini, E. Effects of Kneading Machine Type and Total Element Revolutions on Dough Rheology and Bread Characteristics: A Focus on Straight Dough and Indirect (Biga) Methods. LWT. 2022, 153, 112500. DOI: 10.1016/j.lwt.2021.112500.
- SR ISO 5530-4:2005 . Wheat Flour (Triticum Aestivum L.). Physical Characteristics of Doughs. Part 4: Determination of Rheological Properties Using an Alveograph; Standardization Association of Romania (ASRO) 2005: Bucharest, Romania.
- Li, X. J.; Zhang, J.; Liu, X. L.; Zhang, J.; Qu, N. N.; Wen, Y. Q. Effect of Pulsed Light Treatment on the Physicochemical Properties of Wheat Flour and Quality of Fresh Wet Noodles. Cereal Chem. 2022, 99(4), 920–930. DOI: 10.1002/cche.10551.
- Song, S. Q.; Zhang, X. M.; Hayat, K.; Jia, C. S.; Xia, S. Q.; Zhong, F.; X, Z. B.; T, H. X.; Niu, Y. W. Correlating Chemical Parameters of Controlled Oxidation Tallow to Gas chromatography–mass Spectrometry Profiles and e-nose Responses Using Partial Least Squares Regression Analysis. Sensors and Actuators B: Chemical. 2010, 1472, 660–668. DOI:10.1016/j.snb.2010.03.055.
- Pan, Z. L.; Tian, P. P.; Huang, Z. M.; Wang, N.; Suo, B.; Ai, Z. L. Effects of Flour Characteristics of Different Wheat Cultivars on Quality of Frozen Cooked Noodles. Transactions of the CSAE. 2017, 333, 307–314. DOI:10.11975/j.1002-6819.2017.03.042.
- Zhang, Z. Y.; Wang, C.; Sun, H.; Jiang, W. L.; Chang, L.; Chen, Y. Study on the Correlation between Noodle Quality and the Physico-Chemical Properties of Wheat Flour. J. Chin. Cereal. Oils Assoc. 2012, 27(9), 10–15.
- Asenstorfer, R. E.; Appelbee, M. J.; Mares, D. J. Impact of Protein on Darkening in Yellow Alkaline Noodles. J. Agr. Food Chem. 2010, 58(7), 4500–4507. DOI: 10.1021/jf904232p.
- Asenstorfer, R. E.; Appelbee, M. J.; Kusznir, C. A.; Mares, D. J. Toward an Understanding of Mechanisms Involved in non-polyphenol Oxidase (non-PPO) Darkening in Yellow Alkaline Noodles (YAN). J. Agr. Food Chem. 2014, 62(20), 4725–4730. DOI: 10.1021/jf500206e.
- Morris, C. F. Determinants of Wheat Noodle Color. J. Sci. Food Agr. 2018, 98(14), 5171–5180. DOI: 10.1002/jsfa.9134.
- Fuerst, E. P.; Anderson, J. V.; Morris, C. F. Delineating the Role of Polyphenol Oxidase in the Darkening of Alkaline Wheat Noodles. J. Agr. Food Chem. 2006, 54(6), 2378–2384. DOI: 10.1021/jf0526386.
- Quinde-Axtell, Z.;. Dark Discoloration of barley-based Food Products; USA: Washington State University, 2004.
- Asenstorfer, R. E.; Appelbee, M. J.; Mares, D. J. Physical− Chemical Analysis of Non-Polyphenol Oxidase (Non-PPO) Darkening in Yellow Alkaline Noodles. J. Agr. Food Chem. 2009, 57(12), 5556–5562. DOI: 10.1021/jf900485b.
- Ji, M. Q.; Fang, W. Q.; Li, W. S.; Zhao, Y. Z.; Guo, Y. X.; Wang, W.; Chen, G. F.; Tian, J. C.; Deng, Z. Y. Genome Wide Association Study of the Whiteness and Colour Related Traits of Flour and Dough Sheets in Common Wheat. Sci. Rep-UK. 2021, 11(1), 1–12. DOI: 10.1038/s41598-021-88241-4.
- Hou, G.; 2001 Oriental Noodles. Advances in Food and Nutritional Research. doi:10.1016/S1043-4526(01)43004-X.
- Xiong, X.; Liu, C.; Song, M.; Zheng, X. Effect of Characteristics of Different Wheat Flours on the Quality of Fermented Hollow Noodles. Food Sci. Nutr. 2021, 9(9), 4927–4937. DOI: 10.1002/fsn3.2442.
- Moss, H. J. Yellow Pigment Content of Some Australian Flours. Aust J Exp Agr. 1967, 728, 463–464. DOI:10.1071/ea9670463.
- Baik, B. K.; Czuchajowska, Z. U. Z. A. N. N. A.; Pomeranz, Y. E. S. H. A. J. A. H. U. Discoloration of Dough for Oriental Noodles. Cereal Chem. 1995, 72(2), 198–204.
- Van Bockstaele, F.; De Leyn, I.; Eeckhout, M.; Dewettinck, K. Rheological Properties of Wheat Flour Dough and the Relationship with Bread Volume. I. Creep‐recovery measurements. Cereal Chem. 2008, 856, 753–761. DOI:10.1094/CCHEM-85-6-0753.
- Liu, J. J.; He, Z. H.; Zhao, Z. D.; Pena, R. J.; Rajaram, S. Wheat Quality Traits and Quality Parameters of Cooked Dry White Chinese Noodles. Euphytica. 2003, 131(2), 147–154. DOI: 10.1023/A:1023972032592.