
 ?Mathematical formulae have been encoded as MathML and are displayed in this HTML version using MathJax in order to improve their display. Uncheck the box to turn MathJax off. This feature requires Javascript. Click on a formula to zoom.
ABSTRACT
Honey quality is a global concern since this product is highly susceptible to adulteration, given its competitive price. As a reliable strategy for honey authenticity determination, this work introduces an intelligent classification system that considers the pattern recognition point of view to develop an economical and quick analytical method to identify and differentiate genuine from adulterated honey. This work used an electronic tongue composed of three working electrodes of carbon, platinum, and gold. The system used Cyclic voltammetry to obtain data from 50 genuine and 50 adulterated honey samples. Subsequently, the system used multivariate data analysis using a pattern recognition methodology composed of three big stages, including data organization and normalization, dimensionality reduction, and k-Nearest Neighbors (k-NN) as a classification method. The process was validated with the Leave One Out Cross Validation technique (LOOCV), reaching a classification accuracy performance of 100%. The results show that it was possible the development of a combined methodology between analytical tools and chemometrics for an in-situ, quick and efficient authenticity honey evaluation.
Introduction
Honey is a substance produced by bees that have been used throughout history as food. It consists principally of 76% carbohydrates (fructose and glucose), 17% water, and the remaining other elements such as proteins, amino acids, phenolics, organic acids, vitamins, minerals, etc.[Citation1] Due to its complex chemical composition, smell, and unique flavor with multiple health benefits, its consumption has been growing in recent years, making it the main beekeeping product. However, it is a product from which insufficient production is obtained, and therefore, its price is relatively high.[Citation2]
Harmful practices such as adding sugar syrup to the genuine product make it necessary to develop an economical and quick analytical method to identify and differentiate between natural and adulterated honey. A reason that influences honey being adulterated is its high price since consumers highly value natural honey given its nutritional characteristics.
The use of sugar syrups with similar compositions is common, and it’s used as natural honey and priced as pure is a bad practice.[Citation3] Although replacing natural honey with these sugar syrups is not a health risk for consumers, this practice affects the market growth and undermines consumer confidence.[Citation4]
The adulteration of honey has been a severe and widespread problem that has a substantial economic impact affecting the nutrition and health of consumers,[Citation5] which generates problems in its commercialization. As far as is known, there is no official figure for the production of adulterated honey; however, it is estimated that this value may amount to 70% of the products sold.[Citation6] The growing demand for the consumption of good quality food has contributed to the fact that simple and rapid analyzes are carried out more frequently to assess the quality and authenticity of the food. Usually, tests are required that include the identification of adulterants through chromatographic, physicochemical, this research shows a methodology to identify adulteration in Colombian honey by using an electronic tongue-based approach to determine this adulteration. Honey adulteration has been studied in the literature with different approaches, which can mainly be of two types,[Citation7] first direct adding some substance to the honey or second, indirect when feeding honey bee colonies with different levels of for example commercial sugar syrups.
The electronic tongue sensor arrays have been defined by the International Union of Pure and Applied Chemistry (IUPAC)[Citation8] as “a multisensory system, which consists of a number of low-selective sensors and uses advanced mathematical procedures for signal processing based on PARC and/or multivariate data analysis (ANNs, PCA, etc.).” An electronic tongue-type sensor array has been inspired by the model of taste perception of human beings, who, through different taste buds, perform the reception of data and process said information merged in their brain. Electronic tongue devices have been widely used to detect different analytes, among which it is possible to find adulterants in olive oil,[Citation9] and other adulterants in different matrices.[Citation10,Citation11] In recent years, rapid detection analytical tools have been developed, coupled with multivariate statistical analysis techniques for the rapid evaluation of adulterated honey, among them, an electronic language combining technologies to measure potentiometry, voltammetry or conductivity.[Citation12–15]
This work uses cyclic voltammetric electronic tongue data and presents a methodology that comprises different stages in the data pre-processing and classification through a machine learning method. Validation is performed using a leave-one-out cross-validation method in a dataset of 100 samples. The results showed that this methodology could classify genuine and adulterated honey with high accuracy rates.
Several authors have described the importance of multivariate data analysis and machine learning techniques to discriminate the botanical and geographical origin of honey.[Citation16] Bougrini et al.[Citation17] used a voltammetric electronic tongue to classify and identify false honey according to 18 geographical and seven botanical origins. The detected honey adulterants were glucose syrup (GS) and saccharose syrup (SS). They found that after independently applying a supervised classification algorithm like support vector machines (SVMs) and an unsupervised clustering method like hierarchical cluster analysis (HCA) the classification accuracy reached a value of 100%. Cai et al.[Citation18] identified adulteration in Chinese Angelica honey blended with rice syrup. In this case, principal component analysis linear discriminant analysis (PCA-LDA) achieved a 100% of recognition rate. Spectral methods have been compared with electronic tongues to determine honey adulteration. The results indicated that the electronic tongue approach is more suitable for detecting honey adulteration.[Citation19] Furthermore, the antioxidant capacity was used to differentiate honey with a fuzzy ARTMAP type artificial neural network (ANN), obtaining 100% of classification success.[Citation20] A voltammetric electronic tongue was developed by Oroian et al.[Citation21] to classify authentic and adulterated honey. This electronic tongue was able to classify six different classes of authentic honey with 97.5% of accuracy, while the classification of adulterated honey reached 83.33% of accuracy. The adulteration was made using six different substances added at percentages from 5% to 50%. A correlation between the electrochemical data obtained by Oroian et al. of a voltammetric electronic tongue and physicochemical parameters was studied in.[Citation22] The research found that pH, electrical conductivity, and free acidity strongly correlate with the voltammetric data. This electronic tongue was obtained as a result that it is better to use silver and gold working electrodes to classify honey according to its botanical origin. Pauliuc et al.[Citation23] used a voltammetric electronic tongue to authenticate five types of Romanian honey. Particularly, the electronic tongue was composed of six working electrodes silver, gold, platinum, glass, zinc oxide and titanium dioxide. PCA and LDA were used for data analysis. The results yield a 92.7% classification accuracy.
Tiwari et al.[Citation24] discriminate samples of honey based on floral types using an electronic tongue with voltammetry. Only one platinum work electrode was used. Multilayer perceptron back propagation (BP-MLP) and radial base function (RBF) neural network was implemented to determine the classification rate of 4 different kinds of honey. In Another work of 2018, Sobrino-Gregorio et al.[Citation25] developed an electronic pulse voltammetry tongue to detect and quantify syrup in honey with different percentages of syrup (2.5, 5, 10, 20, and 40%). PLS was used as a regression technique to quantify the level of adulterants in each honey. An important review of honey evaluation using electronic tongues is shown in.[Citation26] The review illustrates potentiometric and voltammetric electronic tongues as well as the versatility of electronic tongues to carry out correct qualitative and quantitative analyzes.
Different pattern recognition methodologies have been developed in the literature to process electronic tongue data.[Citation27] Some of the machine learning tools used to analyze electronic tongue data have been k-Nearest Neighbors (k-NN),[Citation28] t-distributed stochastic neighbor embedding (t-SNE),[Citation29] Recursive Feature Elimination (RFE).[Citation30] For Drift correction and alleviating the effect of the passage of time in the degradation of the sensors, the transfer learning approach based on Joint Distribution Adaptation (JDA) method[Citation31] has been used in sensor arrays. In the same manner, it is possible to find reviews addressing the use of analytical methods for honey classification[Citation32] where two approaches are mainly identified, classical and modern. Classical methods include physicochemical parameters and Melissopalynology. Modern methods include chromatographic methods, mass spectrometry, infrared spectroscopy, nuclear magnetic resonance, and molecular techniques. Each technique allows the evaluation of different features of the honey and provides information to detect honey fraud.
During the year 2022, some works have been published, among them, David et al.[Citation33] introduced a classification methodology to classify Romanian honey samples using ATR-FTIR spectral data and PLS-DA to discriminate botanical and geographical origins. Results over 109 honey samples allowed for classification between 95% and 97% of the samples and found that monosaccharides and organic acids are characteristics to consider during the storage of honey. Suciu et al.[Citation34] developed a methodology for geographical differentiation achieving a 95.8% of classification rate. The methodology used fluorescence spectroscopy, parallel factor analysis, principal component analysis, and SIMCA and it was evaluated by using 96 authentic honey samples from Romania and France. Antonio et al.[Citation35] used excitation-emission spectra to acquire 232 samples of honey. These spectra were decomposed by using parallel factor analysis, partial least squares discriminant analysis, and its versions unfolded and multilinear by obtaining misclassification rates of 4 and 8%.
Phillips and Abdula[Citation36] used hyperspectral imaging and machine learning techniques to fraud detection in honey by obtaining a 95% of accuracy in multi-class classification between different adulterants. Boateng et al.[Citation37] used 253 and 1272 spectra obtained from pure honey and samples with syrups to evaluate a methodology that considers the use of Savitzky-Golay filter, normalization strategies, and different classification algorithms achieving 0.988 of accuracy.
Rachineni et al.[Citation38] used nuclear magnetic resonance as an analytical tool for authenticating honey. It methodology considers the use of spectral fingerprints of pure and adulterated honey and machine learning methods to obtain accuracies near 99.8% with logistic regression as the classifier. This methodology combines different results from different classifiers through voting and the result is 100% of accuracy.
As it will show, the methods included in our methodology are not reported in the same manner in the literature and with the same experiments because it is the first time that this dataset is evaluated in the classification of honey, from this point of view, the methodology in this work can show some advantages and a different way to detect pure honey and adulterated honey.
Materials and methods
The main of this section is to provide a brief description of different concepts and methods used in the developed honey classification methodology.
Electronic tongue
Like the human sense of taste, an artificial approach based on the union of electrochemical sensors, analytical techniques, and multivariate analysis has been developed as electronic tongue sensor arrays. Different electroanalytical techniques have been used to obtain a fingerprint of a specific substance to analyze. Among them, the most popular are voltammetry and potentiometry.[Citation39] The sensor array is composed of a group of sensors of different materials. Every sensor captures a signal, and a dataset must be collected and processed to perform classification or quantification tasks. An electronic tongue sensor array is composed of three main parts: first, the sensor array. In this work, three different voltammetric sensors were used in the electrochemical cell. Second, the electronic data acquisition system is in charge of commanding the electroanalytical tests. In this case, a potentiostat commands the cyclic voltammetric technique performed through the voltammetric sensors in a three-electrode configuration. This potentiostat is connected via USB to a computer in which the data of each test is saved.
Cyclic voltammetry
Electronic tongue-type sensor arrays allow for obtaining information that could be taken as the “chemical fingerprint” in an aqueous solution of multiple components.[Citation40] Cyclic voltammetry is one of the most important techniques used in the development of electronic tongue systems to acquire information about the reduction and oxidation processes of molecular species,[Citation41] including electrochemical kinetics, the reversibility of reactions, reaction mechanisms, electrocatalytic processes, and other characteristics, which are directly or indirectly correlated with the presence of electrochemically active compounds in food matrices, including those involved in the perception of taste.[Citation42]
The principle of the cyclic voltammetry technique consists of applying a certain potential to the working electrode and measuring the current that circulates through it to determine the concentration of any of the electroactive species present in the solution.[Citation43] Electrochemically active compounds are oxidized or reduced depending on the potential range and type of working electrode. As a result, the voltammogram (generated current vs. potential) is obtained that describes the signal formed by all the electroactive components present. This information is also determined by the nature of the working electrode and by the electrochemical technique used.[Citation44] For this reason, using different types of sensors, it is possible to obtain different signals (voltammograms) specific to a substance or a particular combination of substances dissolved in an aqueous medium.
Data arrangement and unfolding
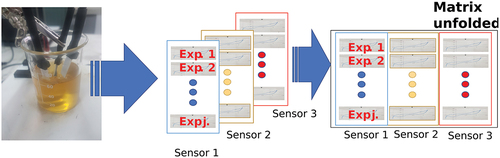
The sensor array is composed of three different voltammetric sensors. Each one of them captures different voltammogram signals. The raw data obtained have a three-dimensional shape, and it is composed of i experiments, j sensors, and k measurement points. This data is arranged into a two-dimensional matrix X following an unfolded procedure. In this case, the data is arranged so that the i rows of the two-dimensional resulting matrix X are related to the total number of experiments. In contrast, the columns of the matrix are composed of the product j sensors × k measurement points. The data unfolded process is illustrated in .
Figure 1. Unfolded matrix.
Mean centered group scaling MCGS
The electronic tongue sensor array used in the cyclic voltammetry experiments consists of three different working electrodes. Each electrode captures different signals because each of the three electrodes is made of different materials. In order to alleviate the differences in magnitude bringing by the working electrodes a MCGS process is applied. This technique uses the mean of all measurements of the sensor in the same column, as it is described in Equationequations 1(1)
(1) and Equation2
(2)
(2) [Citation29,Citation45]:
where μN and σN are the mean and the standard deviation of all the of all the measurements of sensor J in matrix XN, respectively. More details about this normalization can be found in.[Citation29,Citation45]
Dimensionality reduction using manifold learning
Manifold learning algorithms find a low-dimensional representation of raw data that original states in a higher dimensional space. Due to the large number of features that compose the cyclic voltammogram a data reduction stage is necessary to facilitate the task performed by a machine learning classifier. Ideally, the obtained low-dimensional representation tends to form clusters of the different classes that belong to the data. In this sense, the intra-class distances tend to be maximized while the inter-class distance is minimized.[Citation46] In this work, the behavior of five different algorithms is evaluated to perform an unsupervised dimensionality reduction. These algorithms are PCA, t-SNE,[Citation47] Laplacian Eigenmaps,[Citation48] Isomap,[Citation49] and Locally Linear Embedding (LLE).[Citation50]
The manifold learning algorithms construct a neighborhood graph that depends on the number of k neighbors with which it is built and then with successive different iterative processes transform the data into a low dimensional space. In this sense, data in a high dimensional D space is reduced to a low dimensional space with d target dimensions. In this case d«D. For illustrating this process, a rolling dataset is shown in , the objective is to transform the original 3d data in a target 2d domain. The selected illustrated process is performed by isomap method. In each algorithm, the k parameter to construct the G graph must be tuned, and different representations are yielded depending on the number of target dimensions.
Figure 2. 3D to 2D dimensionality reduction process executed by a manifold learning method. Adapted from.[Citation51].
![Figure 2. 3D to 2D dimensionality reduction process executed by a manifold learning method. Adapted from.[Citation51].](/cms/asset/02d64571-9aa1-4cfb-9377-49aa26860df7/ljfp_a_2161571_f0002_oc.jpg)
K-nearest neighbors
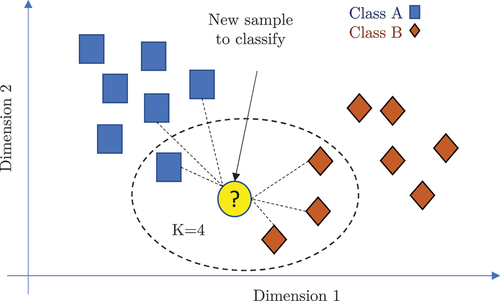
The k-nearest neighbors (k-NN) classifier is a non-parametric supervised classification method based on neighborhood criteria.[Citation52] k-NN works under the premise that new data are organized in a class with similar features according to the neighbors of the training set.[Citation28] In this study, the number of neighbors was set to one and a Euclidean distance was used. An illustrative procedure of the k-NN classifier solving a binary classification problem is shown in .
Figure 3. K Nearest Neighbors classifier process.
Leave one out cross validation LOOCV
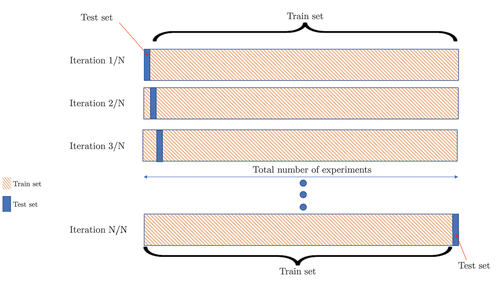
Due to the few amounts of experiments (100) a leave-one-out cross-validation (LOOCV) process is selected to find a resulting confusion matrix. Considering N as the total number of experiments. The LOOCV procedure consists of taking 1-N experiments to construct a train set and holding 1 experiment out to perform the test. Thus, an iterative procedure is performed N times until use every experiment as a test. As a result, the LOOCV yields a confusion matrix which is characterized for illustrates the total number of experiments when performing the sum of all the samples in its rows and columns. The LOOCV is illustrated in .
Figure 4. Leave-one-out cross-validation process.
Experimental setup and honey classification methodology
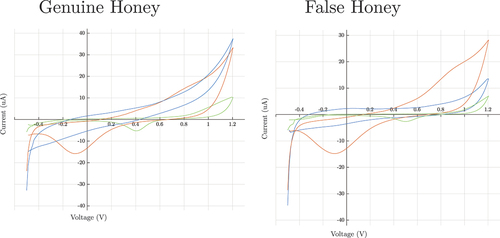
In this work, an electronic tongue is used to detect adulterations of Colombian honey. The electronic tongue used consisted in an array of screen-printed electrochemical (SPE) sensors of the company VBT technologies. The working electrode was made of three different materials, platinum, graphite, and gold, also a silver/silver chloride or Ag/AgCl reference electrode was used. Honey and syrups were diluted in deionized water in concentration 20% honey and 80% water. A magnetic stirrer was used to homogenize the mixture. As shown in ), the potentiostat used is a Multi Emstat 4 of Palmsens. ) shows the detail of the electrochemical sensors used in the electronic tongue. The electro-analytical technique used was cyclic voltammetry with an initial voltage of −0.5 V and a final voltage of 1.2 V with steps of 0.012 V for a total of 284 samples per measurement at a scan rate of 0.1 V/s. illustrates the voltammograms obtained in measurement by the 3 sensors with the carbon, platinum, and gold working electrodes.
Figure 5. Experimental setup of the electronic tongue, potentiostat and electrochemical cell.
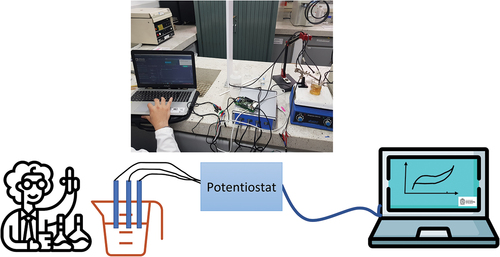
Figure 6. Voltammograms obtained in measurement with the 3 voltammetric sensors of platinum, gold, and carbon working electrodes.
50 samples of genuine honey from all over Colombia were used. Samples were collected as usually beekeepers do and placed in flasks. Then, honey samples were stored under refrigeration until use in assays. For the preparation of samples of adulterated honey, similar products to honey were purchased in the local market (n = 5), more specifically syrups artificially flavored with honey, of which 10 more samples were obtained from mixtures between these products and, finally, thirty-five (n = 35) of the pure honey were adulterated with a concentration of 15% w/w of sucrose for a total of 50 samples of adulterated honey. Thus, 50 records of pure honey and 50 of adulterated honey were obtained, for a total of 100 samples.
Pattern recognition methodology for honey classification
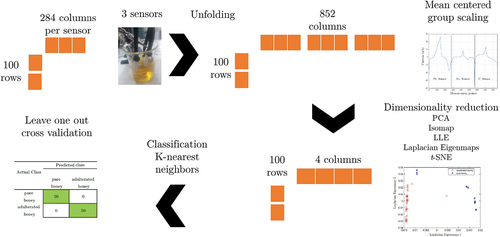
The data processing obtained with the electronic tongue is carried out with a pattern recognition methodology that initially consists of a data unfolding process so that the information of each sensor is located one after the other to form a matrix of i × j, where i are the measurements and j are the current points per number of sensors. A group scaling normalization was used to avoid differences between the signals obtained by each sensor. Then, a dimensionality reduction stage is executed to transform the original data into lower-dimensional space. The dimensionality reduction process compares five different methods: PCA, LLE, Laplacian Eigenmaps, Isomap, and t-SNE. The obtained reduced feature matrix was used at the input of a k-NN machine learning algorithm that allows classifying genuine and adulterated honey. Finally, leave one out cross-validation process is performed to obtain a confusion matrix. The accuracy of the classification is calculated from this confusion matrix as a performance measure. illustrates the signal processing methodology for classifying genuine and adulterated honey.
Figure 7. Pattern recognition methodology for honey classification.
Results and discussion
This section will show the different results in each step of the methodology when it is evaluated with the dataset evaluated.
Data normalization by the MCGS method
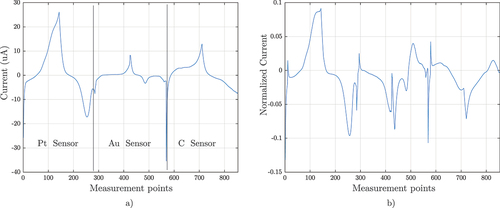
The data obtained by the electronic tongue after performing the cyclic voltammetry tests must be ordered. Signals are obtained with each of the three sensors. Therefore, an ordering of the data must be formed for each experiment. In this case, a data display is made in such a way that each signal obtained by each sensor is concatenated after the next one, as can be seen in ). The voltammograms shown in have voltage values on the ordinate and current on the abscissa. What is shown in ) is different since the measurement points are plotted on the ordinate and the current on the abscissa, which is seen as a doubling of the voltammogram. In this case, the order of the sensors was as follows: first, the platinum sensor, then the gold sensor, and finally, the carbon sensor. To bring the data to the same scale and consider that the magnitude of the signals obtained by each sensor differs from one another, a group scaling process is carried out, where each group refers to a sensor. In this case, three groups are used, and the result when applying group scaling centered on the mean is observed in ).
Figure 8. Unfolding signal a) before and b) after normalizing.
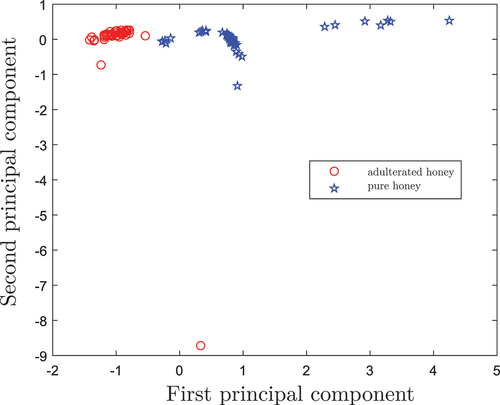
Dimensionality reduction with PCA: The first method used to reduce dimensionality in the honey dataset is the PCA method. This method allows using a number of components which were defined in this case by the behavior of the classification accuracy as in the . Results show that regardless of the variation in the number of components from 2 to 17, a classification accuracy value of 99% was always reached. The two-dimensional scatter plot of the first two main components is shown in , in which the clear separation between genuine honey (blue stars) and adulterated ones (red circles) can be distinguished.
Figure 9. Classification accuracy results when applying PCA as dimensionality reduction method and after performing the LOOCV cross-validation process with the k-NN algorithm.
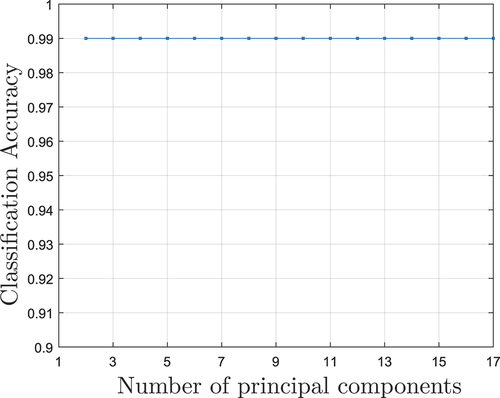
Figure 10. Two-dimensional scatter diagram of the first two principal components after executing the dimensionality reduction with the PCA algorithm.
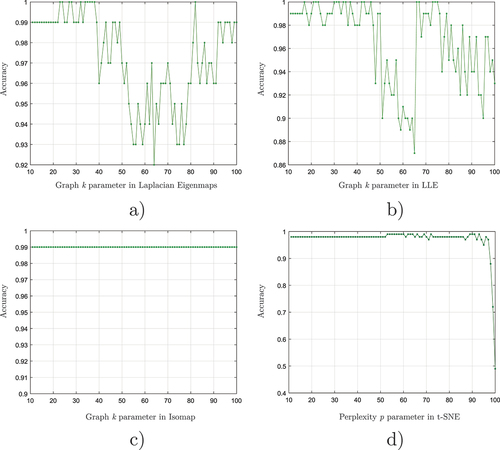
Dimensionality reduction with manifold learning algorithms: shows the classification accuracy of the variation of each one of the parameters belonging to each manifold learning algorithm to perform the dimensionality reduction stage. Three of the algorithms require the use of a neighborhood graph where the parameter k is changed from 10 to 100 because of the number of samples. The t -SNE algorithm requires the calibration of its perplexity parameter p that, in this case, uses the same range.
Figure 11. Classification accuracy behavior when parameter changing in each manifold learning algorithm used to perform the dimensionality reduction process. a) Graph k parameter in Laplacian Eigenmaps, b) Graph k parameter in LLE, c) Graph k parameter in Isomap and d) Perplexity p parameter in t-SNE.
The dispersion results of the first two target dimensions in the four nonlinear dimensionality reduction algorithms are shown in . As can be seen in ) the results of the Laplacian Eigenmaps method when performing the dimensionality reduction process allow the adulterated honey (shown by a red circle) to be clearly separated from the genuine ones (shown by a blue star) Even in no case is there a superposition or overlap between the two kinds of honey. Subsequently, the behavior produced by the LLE method is shown in ), for the LLE algorithm, the grouping of the 50 adulterated kinds of honey can be evidenced in a specific position (near the 0,0 coordinates) within of the two-dimensional scatter diagram. In contrast, the behavior of the genuine honey class for the LLE algorithm refers to dispersion at different points along the abscissa axis. Next, the third method used to make the comparison in dimensionality reduction was isomap and its results can be seen in ).
Figure 12. 2D scatter plots of the four nonlinear dimensionality reduction algorithms. a) Laplacian Eigenmaps, b) LLE, c) Isomap and d) t- SNE.
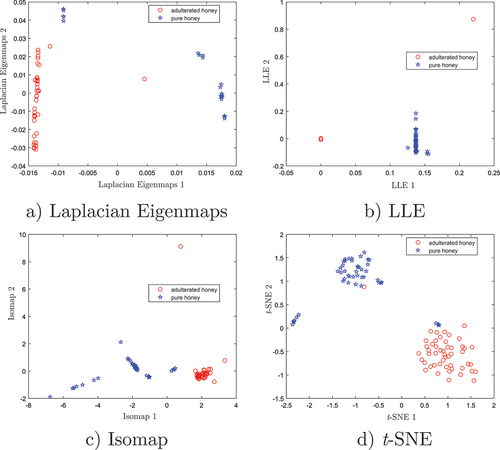
For Isomap, a clear separation was also found between the two classes of honey, placing the data for genuine honey in the lower left quadrant and the data for adulterated honey in the upper right quadrant. Finally, the last method in this comparison was the t – SNE method, and its results are shown in ). t-SNE groups a large part of the genuine honey in the upper part of the quadrant while the adulterated honey is in the lower part, it should be noted that there are 5 genuine kinds of honey are in the lower part of the quadrant.
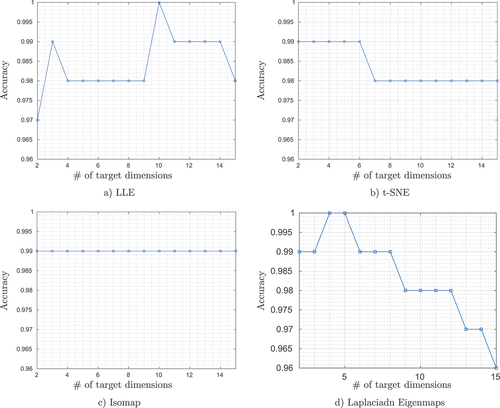
Influence of the target dimensions variation: A study was developed to determine the best set parameters of each dimensionality reduction algorithm to provide the best accuracy in the classification. shows the results of the study. It can be seen that the PCA and Isomap algorithms are invariant to the variation of the dimensions, always maintaining a value of 99% classification accuracy. In contrast, as the dimensions increase, the algorithm t -SNE falls from 99% to 98%. In terms of classification accuracy, the best performances were obtained with values of 100% by using the Laplacian Eigenmaps and LLE algorithms.
Figure 13. Accuracy behavior with a variation of the number of dimensions at the input of the k -NN classifier algorithm for a) LLE, b) t-SNE, c) Isomap and d) Laplacian Eigenmaps.
k -NN supervised classification results:
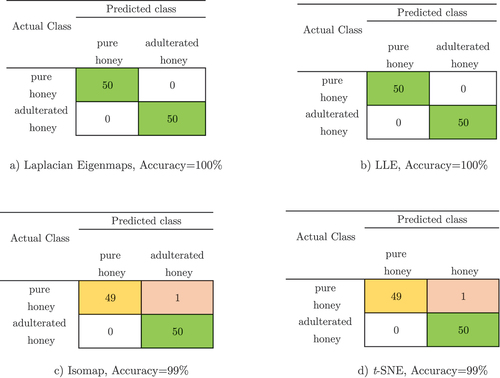
The k -NN classifier is used as a classifier with a number of neighbors k = 1, and a Euclidean distance was trained and tested using a LOOCV strategy. Although multiple works have used this classifier, our work provides different features as inputs and takes advantage of KNN because of its simplicity, quick calculation time, and its versatility which is a fundamental feature for future implementations in embedded systems. The best results of the confusion matrices after performing LOOCV for each of the nonlinear feature extraction methods are shown in . As it is possible to observe, a classification accuracy of 100% is obtained with the Laplacian Eigenmaps method, and LLE method. Misclassification is obtained when t -SNE and isomap are used; these errors appear in a genuine honey sample producing an accuracy of 99%.
Figure 14. Confusion matrices and accuracy result of classifier k -NN evaluated with LOOCV for a) Laplacian Eigenmaps, b) LLE, c)Isomap ans d) t-SNE.
Compared with the works included in the related works section, the following elements can be highlighted in our methodology:
The accuracy achieved is of 100% for binary classification, as it was shown, most of the algorithms achieve percentages near 90%.
The use of multiple sensors with different materials provides different signals that represent the way each sensor interacts with the samples. This data acquisition allows the sensor data fusion process.
Pre-processing and normalization allow the analysis of the unfolded data from all the sensors.
Data reduction is performed using several methods; although some of them have been used in this kind of application, the pre-processing steps allowed have a different kind of data to analyze compared with published works on this topic.
The accuracy achieved by KNN was of 100% with two of the methods; this is a big advantage for its use because compared with other works, the total of genuine and adulterated honey was properly classified.
Conclusion
This work has introduced an electronic tongue system developed for genuine/false honey classification. The system allowed us to correctly classify genuine honey from adulterated ones with 100% of accuracy. The electro-analytical method used was cyclic voltammetry. The electronic tongue was composed of three working electrodes of platinum, graphite, and gold. Each of these electrodes delivered a different response. This work showed a novel signal processing methodology for electronic tongues that use metallic working electrodes and cyclic voltammetry to obtain their signals. The three-dimensional data (experiments x sensors x data points) were organized to form a two-dimensional matrix. Later mean-centered group scaling was used for data normalization. The resulting data has high dimensionality. Thus, a dimensionality reduction procedure was performed and the behavior of five different methods was compared. These five methods were: PCA, LLE, Laplacian Eigenmaps, Isomap, and t-SNE. The target dimensionality was set to 4 due to the good behavior of the k-NN classifier for data with few features. The dataset used for the validation is the first time that has been used and was obtained directly in the development of this work. Due to the few samples available, a leave-one-out cross-validation yield was used. The best results in the adulteration recognition rate in the evaluated samples were achieved by the combination of Laplacian Eigenmaps for dimensionality reduction and k-NN as the classifier. The pattern recognition methodology achieved 100% accuracy in classifying satisfactory authentic honey and adulterated ones. For future work is desired to perform a quantitative study to identify the content of adulterate substances in honey and also to review the possibility of geographical classification.
Acknowledgments
All the authors acknowledge the support from the Ministry of Science, Technology, and Innovation of Colombia with the grant 779—“Convocatoria para la Formación de Capital Humano de Alto Nivel para el Departamento de Boyacá 2017” for sponsoring the research presented herein. This work was supported in part by the Fondo de Ciencia, Tecnología e Innovación del Sistema General de Regalias (FCTeI-SGR). Jersson X. Leon-Medina is grateful with Colciencias and Gobernación de Boyacá for his Ph.D. Fellowship.
Disclosure statement
No potential conflict of interest was reported by the author(s).
Additional information
Funding
References
- da Silva, P. M.; Gauche, C.; Gonzaga, L. V.; Costa, A. C. O.; Fett, R. Honey: Chemical Composition, Stability and Authenticity. Food Chem. 2016, 196, 309–323. DOI: 10.1016/j.foodchem.2015.09.051.
- Valinger, D.; Longin, L.; Grbeš, F.; Benković, M.; Jurina, T.; Kljusurić, J. G.; Tušek, A. J. Detection of Honey adulteration–the Potential of UV-vis and Nir Spectroscopy Coupled with Multivariate Analysis. LWT. 2021, 145, 111316. DOI: 10.1016/j.lwt.2021.111316.
- Naila, A.; Flint, S. H.; Sulaiman, A. Z.; Ajit, A.; Weeds, Z. Classical and Novel Approaches to the Analysis of Honey and Detection of Adulterants. Food Control. 2018, 90, 152–165. DOI: 10.1016/j.foodcont.2018.02.027.
- Bázár, G.; Romvári, R.; Szabó, A.; Somogyi, T.; Éles, V.; Tsenkova, R. Nir Detection of Honey Adulteration Reveals Differences in Water Spectral Pattern. Food Chem. 2016, 194, 873–880. DOI: 10.1016/j.foodchem.2015.08.092.
- Guler, A.; Kocaokutgen, H.; Garipoglu, A. V.; Onder, H.; Ekinci, D.; Biyik, S. Detection of Adulterated Honey Produced by Honeybee (Apis mellifera L.) Colonies Fed with Different Levels of Commercial Industrial Sugar (c3 and c4 Plants) Syrups by the Carbon Isotope Ratio Analysis. Food Chem. 2014, 155, 155–160. DOI: 10.1016/j.foodchem.2014.01.033.
- Puścion-Jakubik, A.; Borawska, M. H.; Socha, K. Modern Methods for Assessing the Quality of Bee Honey and Botanical Origin Identification. Foods. 2020, 9(8), 1028. DOI: 10.3390/foods9081028.
- Naila, A.; Flint, S. H.; Sulaiman, A. Z.; Ajit, A.; Weeds, Z. Classical and Novel Approaches to the Analysis of Honey and Detection of Adulterants. Food Control. 2018, 90, 152–165. DOI: 10.1016/j.foodcont.2018.02.027.
- Vlasov, Y.; Legin, A.; Rudnitskaya, A.; Di Natale, C.; D’amico, A. Nonspecific Sensor Arrays (“ Electronic Tongue”) for Chemical Analysis of Liquids (IUPAC Technical Report. Pure Appl. Chem. 2005, 77(11), 1965–1983. DOI: 10.1351/pac200577111965.
- Apetrei, I.; Apetrei, C. Detection of Virgin Olive Oil Adulteration Using a Voltammetric e-tongue. Comput. Electron. Agric. 2014, 108, 148–154. DOI: 10.1016/j.compag.2014.08.002.
- Ouyang, Q.; Yang, Y.; Wu, J.; Liu, Z.; Chen, X.; Dong, C.; Chen, Q.; Zhang, Z.; Guo, Z. Rapid Sensing of Total Theaflavins Content in Black Tea Using a Portable Electronic Tongue System Coupled to Efficient Variables Selection Algorithms. J. Food Compost. Anal. 2019, 75, 43–48. DOI: 10.1016/j.jfca.2018.09.014.
- de Morais, T. C. B.; Rodrigues, D. R.; D. C. P. Souto, U. T.; Lemos, S. G. A Simple Voltammetric Electronic Tongue for the Analysis of Coffee Adulterations. Food Chem. 2019, 273, 31–38. DOI: 10.1016/j.foodchem.2018.04.136.
- Winquist, F.; Lundström, I.; Wide, P. The Combination of an Electronic Tongue and an Electronic Nose. Sens. Actuators B Chem. 1999, 58(1–3), 512–517. DOI: 10.1016/S0925-4005(99)00155-0.
- Winquist, F.; Krantz-Rülcker, C.; Lundström, I. Electronic Tongues and Combinations of Artificial Senses. Sens. Update. 2002, 11(1), 279–306. DOI: 10.1002/seup.200211107.
- Winquist, F. Voltammetric Electronic tongues–basic Principles and Applications. Microchim. Acta. 2008, 163, 3–10. 1-2 DOI: 10.1007/s00604-007-0929-2.
- Ciursa, P.; Oroian, M. Voltammetric e-tongue for Honey Adulteration Detection. Sensors. 2021, 21(15), 5059. DOI: 10.3390/s21155059.
- Maione, C.; Barbosa, F.; Barbosa, R. M. Predicting the Botanical and Geographical Origin of Honey with Multivariate Data Analysis and Machine Learning Techniques: A Review. Comput. Electron. Agric. 2019, 157(January), 436–446. DOI: 10.1016/j.compag.2019.01.020.
- Bougrini, M.; Tahri, K.; Saidi, T.; El Alami El Hassani, N.; Bouchikhi, B.; El Bari, N. Classification of Honey according to Geographical and Botanical Origins and Detection of Its Adulteration Using Voltammetric Electronic Tongue. Food Analytical Methods. 2016, 9(8), 2161–2173. DOI: 10.1007/s12161-015-0393-2.
- Cai, J.; Wu, X.; Yuan, L.; Han, E.; Zhou, L.; Zhou, A. Determination of Chinese Angelica Honey Adulterated with Rice Syrup by an Electrochemical Sensor and Chemometrics. Anal. Methods. 2013, 5(9), 2324–2328. DOI: 10.1039/c3ay00041a.
- Gan, Z.; Yang, Y.; Li, J.; Wen, X.; Zhu, M.; Jiang, Y.; Ni, Y. Using Sensor and Spectral Analysis to Classify Botanical Origin and Determine Adulteration of Raw Honey. J. Food Eng. 2016, 178, 151–158. DOI: 10.1016/j.jfoodeng.2016.01.016.
- Juan-Borrás, M.; Soto, J.; Gil-Sánchez, L.; Pascual-Maté, A.; Escriche, I. Antioxidant Activity and physico-chemical Parameters for the Differentiation of Honey Using a Potentiometric Electronic Tongue. J. Sci. Food Agric. 2016, 97(7), 2215–2222. DOI: 10.1002/jsfa.8031.
- Oroian, M.; Paduret, S.; Ropciuc, S. Honey Adulteration Detection: Voltammetric e-tongue versus Official Methods for Physicochemical Parameter Determination. J. Sci. Food Agric. 2018, 98(11), 4304–4311. DOI: 10.1002/jsfa.8956.
- Oroian, M.; Ropciuc, S. Romanian Honey Authentication Using Voltammetric Electronic Tongue. Correlation of Voltammetric Data with physico-chemical Parameters and Phenolic Compounds. Comput. Electron. Agric. 2019, 157, 371–379. DOI: 10.1016/j.compag.2019.01.008.
- Pauliuc, D.; Dranca, F.; Oroian, M. Raspberry, Rape, Thyme, Sunflower and Mint Honeys Authentication Using Voltammetric Tongue. Sensors. 2020, 20(9), 2565. DOI: 10.3390/s20092565.
- Tiwari, K.; Tudu, B.; Bandyopadhyay, R.; Chatterjee, A. Identification of Monofloral Honey Using Voltammetric Electronic Tongue. J. Food Eng. 2013, 117(2), 205–210. DOI: 10.1016/j.jfoodeng.2013.02.023.
- Sobrino-Gregorio, L.; Bataller, R.; Soto, J.; Escriche, I. ,Food Control 91. 2018. Monitoring Honey Adulteration with Sugar Syrups Using an Automatic Pulse Voltammetric Electronic Tongue, 254–260. 10 January 2022. doi:10.1016/j.foodcont201804003
- Veloso, A. C.; Sousa, M. E.; Estevinho, L.; Dias, L. G.; Peres, A. M. Honey Evaluation Using Electronic Tongues: An Overview. Chemosensors. 2018, 6(3), 1–25. DOI: 10.3390/chemosensors6030028.
- Leon-Medina, J. X.; Vejar, M. A.; Tibaduiza, D. A., Signal Processing and Pattern Recognition in Electronic Tongues: A Review, In Burgos, D. A. T., Vejar, M. A., Pozo, F. (Eds.), Pattern Recognition Applications in Engineering, IGI Global Diego Tibaduiza, Maribel Anaya, Francesc Pozo, Hershey, PA, USA: IGI Global, 2020, pp. 84–108. 10 January 2022. doi:10.4018/978-1-7998-1839-7.ch004.
- Leon-Medina, J. X.; Cardenas-Flechas, L. J.; Tibaduiza, D. A. A data-driven Methodology for the Classification of Different Liquids in Artificial Taste Recognition Applications with A Pulse Voltammetric Electronic Tongue. Int. J. Distribut. Sensor Net. 2019, 15(10), . arXiv. DOI: 10.1177/1550147719881601.
- Leon-Medina, J. X.; Anaya, M.; Pozo, F.; Tibaduiza, D. 27 August. Nonlinear Feature Extraction through Manifold Learning in an Electronic Tongue Classification Task, Sensors 20 (17). https://www.mdpi.com/1424-8220/20/17/4834. 10 January 2022 2020.
- Villamil-Cubillos, L. F.; Leon-Medina, J. X.; Anaya, M.; Tibaduiza, D. A. 14 November . Evaluation of Feature Selection Techniques in a Multifrequency Large Amplitude Pulse Voltammetric Electronic Tongue, Eng. Proceed. 2 (1). https://www.mdpi.com/2673-4591/2/1/62. 10 January 2022 2020
- Leon-Medina, J. X.; Pineda-Muñoz, W. A.; Burgos, D. A. T. Joint Distribution Adaptation for Drift Correction in Electronic Nose Type Sensor Arrays. IEEE Access. 2020, 8, 134413–134421. DOI: 10.1109/ACCESS.2020.3010711.
- Chin, N. L.; Sowndhararajan, K., A Review on Analytical Methods for Honey Classification, Identification and Authentication, In V. de Alencar Arnaut de Toledo, E. D. Chambó (Eds.), Honey Analysis, IntechOpen. 34 10 January 2022, Rijeka, 2020, V. de Alencar Arnaut de Toledo, E. D. Chambó (Eds.). 5 Vagner De Alencar, Arnaut De Toledo, Emerson Dechechi, Chambó. doi:10.5772/intechopen.90232
- David, M.; Hategan, A. R.; Berghian-Grosan, C.; Magdas, D. A. 2022. The Development of Honey Recognition Models Based on the Association between atr-ir Spectroscopy and Advanced Statistical Tools, Int. J. Mol. Sci. 23 (17). https://www.mdpi.com/1422-0067/23/17/9977. 22 October 2022
- Suciu, R. C.; Guyon, F.; Magdas, D. A. Application of Emission – Excitation Matrices in Parallel with Factor Analysis with Other Chemometric Techniques for Honey Classification, J. Food Compost. Anal. 107 (2022) 104401. https://www.sciencedirect.com/science/article/pii/S0889157522000199. 10 October 2022
- Antônio, D. C.; de Assis, D. C. S.; Botelho, B. G.; Sena, M. M. Detection of Adulterations in a Valuable Brazilian Honey by Using Spectrofluorime Try and Multiway Classification, Food Chem. 370 (2022) 131064. https://www.sciencedirect.com/science/article/pii/S0308814621020707. 10 October 2022.
- Phillips, T.; Abdulla, W. 2022. A New Honey Adulteration Detection Approach Using Hyperspectral Imaging and Machine Learning, European Food Research and Technology. 20 November 2022. doi:10.1007/s00217-022-04113-9. URL. DOI: 10.1007/s00217-022-04113-9.
- Boateng, A. A.; Sumaila, S.; Lartey, M.; Oppong, M. B.; Opuni, K. F.; Adutwum, L. A. Evaluation of Chemometric Classification and Regression Models for the Detection of Syrup Adulteration in Honey, LWT 163 (2022) 113498. https://www.sciencedirect.com/science/article/pii/S0023643822004339 . 22 october 2022
- Rachineni, K.; Rao Kakita, V. M.; Awasthi, N. P.; Shirke, V. S.; Hosur, R. V.; Chandra Shukla, S. Identifying Type of Sugar Adulterants in Honey: Combined Application of Nmr Spectroscopy and Supervised Machine Learning Classification. Curr Res. Food Sci. 2022, 5, 272–277. https://www.sciencedirect.com/science/article/pii/S2665927122000089. 20 July 2022.
- Tan, J.; Xu, J. Applications of Electronic Nose (e-nose) and Electronic Tongue (e-tongue) in Food quality-related Properties Determination: A Review. Artific. Intellig. Agric. 2020, 4, 104–115. DOI: 10.1016/j.aiia.2020.06.003.
- Wei, Z.; Wang, J. Tracing Floral and Geographical Origins of Honeys by Potentiometric and Voltammetric Electronic Tongue. Comput. Electron. Agric. 2014, 108, 112–122. DOI: 10.1016/j.compag.2014.07.014.
- Elgrishi, N.; Rountree, K. J.; McCarthy, B. D.; Rountree, E. S.; Eisenhart, T. T.; Dempsey, J. L. A Practical Beginner’s Guide to Cyclic Voltammetry. J. Chem. Educ. 2018, 95(2), 197–206. DOI: 10.1021/acs.jchemed.7b00361.
- Gutiérrez, J. M.; Haddi, Z.; Amari, A.; Bouchikhi, B.; Mimendia, A.; Cetó, X.; Del Valle, M. Hybrid Electronic Tongue Based on Multisensor Data Fusion for Discrimination of Beers. Sens. Actuators B Chem. 2013, 177, 989–996. DOI: 10.1016/j.snb.2012.11.110.
- Otles, S. Handbook of Food Analysis Instruments; Boca Raton, FL: CRC Press, 2016.
- El Hassani, N. E. A.; Tahri, K.; Llobet, E.; Bouchikhi, B.; Errachid, A.; Zine, N.; El Bari, N. Emerging Approach for Analytical Characterization and Geographical Classification of Moroccan and French Honeys by Means of a Voltammetric Electronic Tongue. Food Chem. 2018, 243, 36–42. DOI: 10.1016/j.foodchem.2017.09.067.
- Pozo, F.; Vidal, Y.; Salgado, Ó. Wind Turbine Condition Monitoring Strategy through Multiway Pca and Multivariate Inference. Energies. 2018, 11(4), 749. DOI: 10.3390/en11040749.
- Gracia, A.; González, S.; Robles, V.; Menasalvas, E. A Methodology to Compare Dimensionality Reduction Algorithms in Terms of Loss of Quality. Inform. Sci. 2014, 270, 1–27. DOI: 10.1016/j.ins.2014.02.068.
- Van der Maaten, L.; Hinton, G. Visualizing Data Using t-sne. J. Mach. Learn. Res. 2008, 9(11), 2579–2605.
- Belkin, M.; Niyogi, P. Laplacian Eigenmaps for Dimensionality Reduction and Data Representation. Neural Computat. 2003, 15(6), 1373–1396. DOI: 10.1162/089976603321780317.
- Tenenbaum, J. B.; De Silva, V.; Langford, J. C. A Global Geometric framework for Nonlinear Dimensionality Reduction. Science (New York, N.Y.). 2000, 290(5500), 2319–2323. DOI: 10.1126/science.290.5500.2319.
- Roweis, S. T.; Saul, L. K. Nonlinear Dimensionality Reduction by Locally Linear Embedding, Science. Science (New York, N.Y.). 2000, 290(5500), 2323–2326. DOI: 10.1126/science.290.5500.2323.
- Leon-Medina, J. X. 16 August. Desarrollo de un sistema de clasificación de sustancias basado en un arreglo de sensores tipo lengua electrónica, Ph.D. thesis, Universidad Nacional de Colombia, https://repositorio.unal.edu.co/handle/unal/79962 (2021). 20 July 2022.
- Vitola, J.; Pozo, F.; Tibaduiza, D.; Anaya, M. A Sensor Data Fusion System Based on k-nearest Neighbor Pattern Classification for Structural Health Monitoring Applications. Sensors. 2017, 17(2), 417. DOI: 10.3390/s17020417.