
 ?Mathematical formulae have been encoded as MathML and are displayed in this HTML version using MathJax in order to improve their display. Uncheck the box to turn MathJax off. This feature requires Javascript. Click on a formula to zoom.
ABSTRACT
The impact damage is the most destructive effect on FUM during the drum screening. To explore the impact damage of FUM during drum screening, a free-drop test device was built to simulate the impact damage of FUM. Adopting an L16(45) orthogonal experiment scheme, we investigated the effect of mass, dropping height, collision material, and number of collisions on the bruise depth and specific surface area of bruise, impact peak force, and Ratio of amplitude attenuation. Then, we analyzed the influence of these four factors using a single factor test for each factor. Orthogonal experiments identified the main and secondary factors affecting each outcome; the number of collisions had no significant influence on the impact peak force, while the collision material was the only factor with a significant influence on the Ratio of amplitude attenuation. Single-factor test results indicate that the bruising depth and maximum impact force increase with FUM mass, and the specific surface area of the bruise first increases and then reduces. The maximum impact force and the bruising depth increase with dropping height, and the specific surface area of the bruise periodically changes. The bruising depth and damage surface area of FUM increased with an increased hardness of the collision material, and the maximum impact force and ratio of amplitude attenuation decreased with an increased hardness of the collision material. The specific surface area of the bruise periodically changes with the drop time, and the bruising depth first increases and then decreases.
Introduction
FUM is a biennial herb of the lily family.[Citation1,Citation2] Its medicinal value lies in the bulb, which mainly grows underground and whose shape is similar to that of a flattened disc. The size of the bulb can vary between 3 and 30 mm and its harvest depth is 70 ~ 100 mm. In China, FUM is not only a precious medicinal material, but also a health food. Pear drinks and health congee contained FUM are popular at home and abroad.[Citation3] FUM is mainly cultivated by artificial methods in the Lesser Khingan Mountains and Changbai Mountains in Northeast China.[Citation4] According to incomplete statistics, the planting area for FUM in Northeast China reached 132 km2 in 2022; the annual production of dried FUM can reach 30,000 tons. This can create economic benefits of approximately 1.8 billion yuan for farmers every year.[Citation5]
Harvesting FUM is a time-consuming and labor-intensive job.[Citation6] Harvesting on time is an important requirement, and almost all harvesting is concentrated in June and July, in the rainy season; FUM will rot in the fields if it is not harvested in time. As a result, a large number of workers are employed to harvest and screen FUM. Because this is very labor intensive, the cost is high; At the same time, because of the small population and employment of working-age people, there is a shortage of available workers. This has seriously restricted the development of the FUM industry.[Citation7] The realization of mechanized harvest is urgent for the efficient production of FUM.
Mechanized harvesting of FUM is mainly achieved by mechanized screening,[Citation8] but mechanical damage to FUM is a technical obstacle to mechanized development. Because drum screening has the characteristics of high screening efficiency, it is widely used in production in practice.[Citation9] During the screening process, a FUM mixture (containing FUM, soil, and other impurities) is subjected to grinding and free drop in a roller.[Citation10] The most destructive effect on FUM is the impact damage. Therefore, to reduce the damage of FUM drum screening, it is important to study the drop impact of FUM and explore its mechanisms, and this is an important way of realizing mechanized harvesting.
When screening the FUM mixture in the drum, the internal movement is complicated and the influencing factors are difficult to control; hence, we propose exploring the damage relationship of FUM through a free dropping experiment. Few reports and studies in the literature have investigated the bruise of FUM from dropping; related literature that can be referred to focus more on fruits and vegetables, but these research methods are used as a reference for this study.
Vursavus and Ozguven[Citation11] used digital calipers to measure the scratch diameter of apples, and divided the damage level of apples into the categories of no, trace, mild, moderate, and severe damage. To detect early or mild bruise, Zhao et al.[Citation12] and Baranowski et al.[Citation13] used hyperspectral and thermal imaging techniques to measure the bruise area. Babarinsa and Ige[Citation14] used a compression experiment to study the effects of different ripeness, vibration levels, and container type on the load, deformation, and stress of tomatoes that burst after packaging. Ahmadi et al.[Citation15] used digital calipers to measure the bruise depth and width of peaches and calculated the damage volume of the peaches. Maness et al.[Citation16] used digital calipers to calculate the damage volume of pears by measuring the damage width and depth of the long and short axes of the pears. To characterize the damage of edible olives, González-Merino et al.[Citation17] identified new geometric parameters through a 3D analysis of scanned olives. They automatically detected damaged areas using mesh curvature maps. Sola-Guirado et al.[Citation18] studied the temporal evolution of bruise on fruit caused by controlled impact. The bruise index, fruit length and diameter, roundness, spot number, color, and other parameters were obtained by digitally processing photos of the fruit. Researchers have investigated bruise tissue in fruit based on the following evaluation parameters: the bruise depth, width, and diameter, and area or volume of damage. Yuwana and Duprat[Citation19] conducted a free-drop test on apples to analyze the effects of weight, dropping height, shear stress, and storage time on absorbed energy. Van Zeebroeck et al.[Citation20] carried out an impact experiment to analyze the effects of tomato maturity, stiffness, storage temperature, impact position, radius of curvature, and impact force on absorbed energy. Ahmadi[Citation21] also used an impact experiment, but to analyze the effects of kiwifruit stiffness, storage temperature, radius of curvature, impact energy, and impact force on absorbed energy. Fu et al.[Citation22] proposed a method to measure the contusion damage of apples using a pendulum method. Impact parameters, contusion area, volume, and susceptibility were used as indicators. Shahbazi[Citation23] evaluated the impact damage of chickpeas with different water content at different speeds; damaged pieces were sorted by visual inspection. Kursat-Celik[Citation24] determined the damage sensitivity and time-dependent nonlinear deformation behavior of pears under various impact conditions. The influence of impact height, surface, and direction on the area of damage was analyzed. Jiménez-Jiménez et al.[Citation25] studied the relationship between bruise and time in olives. The time evolution of bruise was assessed using spectrophotometers in the visible and near infrared regions. The damage conditions under different impact energies were analyzed. Li et al.[Citation26] predicted the mechanical parameters of yellow peaches by combining hyperspectral image and spectral features. The damaged area was obtained by threshold segmentation and pixel calculation. Chaiwong et al.[Citation27] used digital image analysis to evaluate the vibration damage of guava peel using as indexes the damage area (BA), gray scale, normalized fractal dimension difference (ΔFD/FD 0), Browning index (BI), and total color difference (TCD). Zhang et al.[Citation28] established the elastic impact model of litchi and the CED model considering energy dissipation to calculate the impact characteristics of litchi. Then, they evaluated the degree of damage to fruit. Vipasdamrongkul et al.[Citation29] proposed a method to calculate the surface damage area of guava fruit based on image segmentation. Htike et al.[Citation30] used fractal image analysis to study the effects of different drop heights and drop times on the impact damage and quality of guava. Satitmunnaithum et al.[Citation31] conducted a drop impact test to determine strawberry damage according to four different visual damage index classifications. Xie et al.[Citation32] used a pendulum impact test to analyze the impact velocity and damage of potato tubers. Shao et al.[Citation33] proposed an early damage detection method for an apple surface based on near infrared camera imaging technology and the image threshold segmentation method. Researchers used free drop and impact experiments to analyze the impact of dropping height, curvature radius of fruit, contact material and dropping direction of fruit on the damage area, damage volume, absorbed energy and other evaluation indexes. The above references are summarized in .
Table 1. Literature summary.
Previous research methods, factors, and indicators are considered in this study. The size of FUM varies, and the impact of FUM on a surface produces small damping-free vibrations during drum screening. To reduce the mechanical damage to FUM, this study defines the drop breakage relationship of FUM by considering the impact peak force, drop depth, specific surface area of bruise, and Ratio of amplitude attenuation as evaluation indexes and the FUM mass, dropping height, collision material, and number of collisions as influencing factors. Orthogonal and single experiments analyzed the influence of the above factors on the evaluation index. These results can serve as an important reference when designing and developing low-loss drum screening, improving the low loss-technology level of FUM harvesters, and enriching the relevant theories of FUM low-loss.
Material and methods
FUM preparation
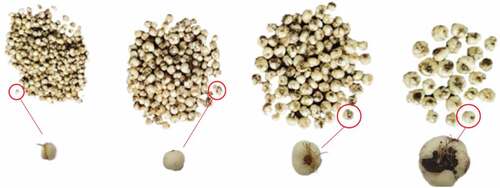
FUM were picked from Yi-chun city, Heilongjiang Province, China. After harvesting, to prevent water loss, the FUM were transported in soil to the lab in Heilongjiang Bayi Agricultural University located in Daqing City for the impact experiments and stored in a cool place or refrigerator for preservation. In order to ensure the freshness and quality of FUM, we stored it at 2–6°C and about 13–14% humidity. Before experiments, the FUM were checked to ensure there was no damage by microscope and divided into four groups according to weight as follows: 1 g, 2 g, 3 g and 4 g ().
Figure 1. Four groups of single FUM of 1g, 2g, 3g and 4g, respectively.
Free drop experiment
An experimental system was designed for the free drop experiment. Because FUM will collide with soil, FUM, screen, and a steel plate when screening in the roller screen, these four materials will be used as collision materials for the experiment. The experimental bench is welded with a steel structure. The design considers that FUM is not affected by the free fall experiment, and the sensor should be able to measure the data at the time of collision. We designed a device that was mainly composed of a base frame, adjustable height platform, guide tube, self-made fixture, impact platform, data acquisition card, data cable, and computer (). The base frame was welded to the impact platform, the adjustable height platform was mounted on the base frame and was adjustable, and the guide pipe was connected to the adjustable height platform. The fixture was fixed to the impact platform via a screw connection. The fixture was connected to the computer by the data acquisition card and data cable. The fixture was mainly composed of a screen, channel steel, base plate, sensor, bolt, and press plate (). A sensor was installed between the base plate of the fixture and the base of the drop table by a thread connection. The collision material known as the screening mesh and the base plate were supported by the channel steel, respectively connected with the channel steel and pressure plate by a screw connection are shown in . In the experiments, the FUM was dropped from the adjustable-height platform, through the guide tube, and collided with the screen on the fixture. The changes in the impact peak force between the different collision materials and weights of the FUM were measured by a force sensor (Model 1199, Arizon technology, China), which has an accuracy of 0.05% and an operating frequency of 1.7 kHz. The force data was collected and recorded by an acquisition system connected to the PC and analyzed using FD0843. Based on the working principle and structure characteristics of the drum screening, test factors of the experiment were the FUM quality, dropping height, collision material and number of collisions. The effects of each factor on the bruise depth, specific surface area of bruise, impact peak force, and Ratio of amplitude attenuation were analyzed. Each factor was tested for four different values (). Because drum screen is composed of steel plate, screening mesh, etc., when screening and FUM collision with FUM, soil, steel plate, screening mesh, these materials are selected as different types of collision materials. Based on theoretical analysis and simulation analysis, the maximum and the minimum drop height is 1500 mm and 600 mm, respectively. According to the principle of equal level, the level of the dropping height is 600, 900, 1200 and 1500 mm.According to the motion analysis, the minimum rotation times of the material in the drum are 3 turns and the maximum is 6 turns. So the level of the Number of collisions is 3,4,5, and 6. The L16(45) table was used as the orthogonal test table. The number of test groups was N = 16. Each test was repeated 10 times and the average value was taken as the experimental result ().
Figure 2. Free-drop test apparatus.
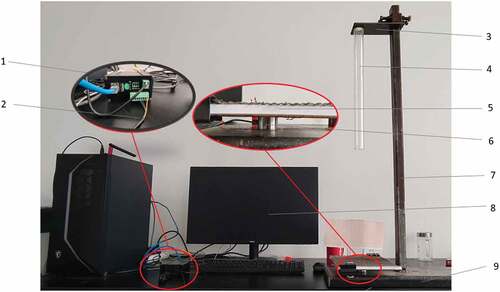
Figure 3. Schematic diagram of self-made fixtures.
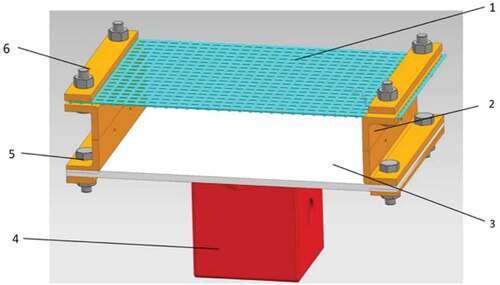
Table 2. Test factors and range of values for experiments.
Table 3. Scheme of orthogonal experimental design.
Determination of depth and specific surface area of bruise
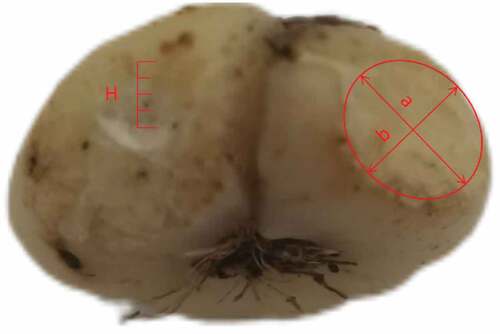
The bruise depth was taken to be the average value of the multiple measured depth values, H (). It is measured by using vernier calipers. The shape of the bruise area was approximately elliptical.[Citation34,Citation35] The special surface area of bruise is given by
Figure 4. Example of depth and specific surface area of bruise.
Determination of impact peak force and ratio of amplitude attenuation
The variation curve of the impact force on the FUM; its variation law is consistent with the small periodic damping attenuation function (). The impact peak force is the maximum value on the curve.[Citation36] The Ratio of the amplitude attenuation is the ratio of adjacent impact forces values,[Citation37] given by the formula
Figure 5. Impact force over time during contact. T1 = T2 = T is the damping period.
Results
Orthogonal test results
Data collected from the experiments are listed in . List of optimal level definitions for each factor (), kx is the average value of the test index obtained when a factor has the value of level x. For example, in the “FUM mass (A)” column, k1 represents the mean bruise depth for a quality level of one: k1=K1/4=(0.00 + 0.51 + 1.52 + 1.57)/4 = 0.9. The range (R) is the difference between the maximum and minimum values of k1 to k4 for each index. The range reflects the degree of influence of the factor on the test index. The larger its value, the greater the difference in the indexes for different factor values, that is, the greater the influence of the factor on the test index, and the more important the factor is. Based on the range value, we can determine whether the factor is major or minor.
Table 4. Result of orthogonal experimental design.
Table 5. Analysis of optimal factor combinations.
The range specifies the difference between the maximum and minimum values of kx obtained for each factor. The optimal level specifies the factor level that yields the best kx value. The primary and secondary order is given by the order of the factors from the one with the greatest to least influence on the test indexes. Comparative analysis indicates that the main influencing factor for bruise depth in FUM contact collision was the collision material, followed by the dropping height, FUM mass, and number of collisions. The influence of the collision material, dropping height, and FUM mass on the bruise depth was very significant, and the number of collisions was a significant factor. The main influencing factor for specific surface area of bruise was the collision material, followed by the dropping height, FUM mass, and number of collisions. The influences of all these factors were very significant. The main influencing factor for the impact peak force was the FUM mass, followed by the dropping height, collision material, and number of collisions. In addition, the influence of the FUM mass, dropping height, and collision material on the impact peak force was very significant, but the influence of the number of collisions was not significant. The main influencing factor for the ratio of amplitude attenuation was the collision material, followed by the FUM mass, dropping height, and number of collisions. Finally, the influence of the collision material on the Ratio of amplitude attenuation was very significant, while the impacts of the other factors were not significant.
Single factor test results
The orthogonal test results show that the mass, dropping height, collision material, and number of collisions have different degrees of influence on the bruise depth, specific surface area of bruise, impact peak force, and Ratio of amplitude attenuation. Therefore, single factor experiments were conducted on the mass, dropping height, collision material and number of collisions. The results are shown in .
Figure 6. Influence of FUM mass on bruise depth, specific surface area of bruise, and impact peak force.
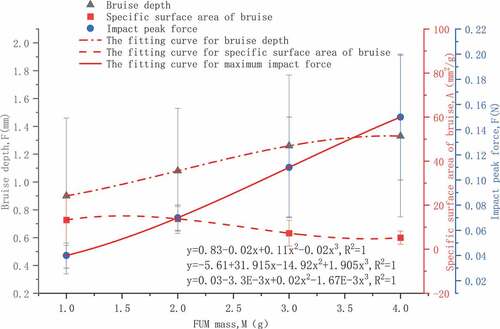
Figure 7. Influence of dropping height on bruise depth, specific surface area of bruise, and impact peak force.
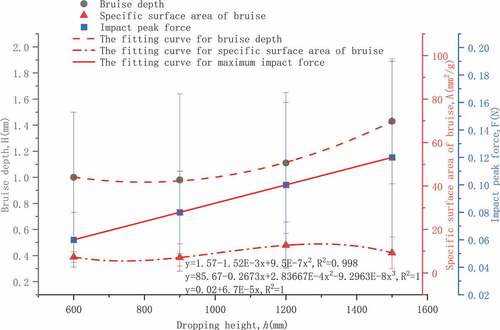
Figure 8. Influence of collision material on bruise depth, specific surface area of bruise, impact peak force, and Ratio of amplitude attenuation.
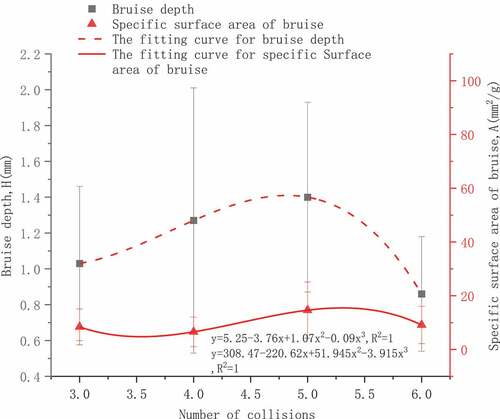
Figure 9. Influence of number of collisions on bruise depth and specific surface area of bruise.
Effect of FUM mass
The solid line indicates the fitting curve for the impact peak force (). The fitting equation is y = 0.03–0.003×+0.02x2-0.00167x3, and the coefficient of determination is R2 = 1. The impact peak force rapidly increases as the mass of the FUM increases, and its maximum value is 0.15 N. The dash-dotted line indicates the fitting curve for the bruise depth. The fitting equation is y = 0.83–0.02×+0.11x2-0.02x3, and the coefficient of determination is R2 = 1. The bruise depth increases, at first rapidly, and then slowly, as the mass of the FUM increases, and its maximum value is 1.33 mm. The dashed line indicates the fitting curve for the specific surface area of bruise. The fitting equation is y = −5.61 + 31.915×-14.92x2 +1.905x3, and the coefficient of determination is R2 = 1. The specific surface area of bruise first increases and then decreases as the mass of the FUM increases, and its maximum value is 15.12 mm2/g.
Effect of dropping height
The solid line indicates the fitting curve for the impact peak force (). The fitting equation is y = 0.02 + 0.000067×, and the coefficient of determination is R2 = 1. The impact peak force rapidly increases as the dropping height increases, and its maximum value is 0.06 N. The dashed line indicates the fitting curve for the bruise depth. The fitting equation is y = 1.57–0.00152×+0.00000095x2, and the coefficient of determination is R2 = 0.998. The bruise depth increases, at first slowly and then rapidly, as the dropping height increases, and its maximum value is 1.43 mm. The dash-dotted line indicates the fitting curve for the specific surface area of bruise. The fitting equation is y = 85.67–0.2673×+2.83667E-4x2-9.2963E-8x3, and the coefficient of determination is R2 = 1. The specific surface area of bruise first decreased, then increased, and finally decreased between a minimum of 5.34 mm2/g and a maximum of 13.34 mm2/g.
Effect of Collision Material In the single factor test, the bruise depth and specific surface area of bruise increased and the impact peak force and Ratio of amplitude attenuation decreased as the hardness of the collision material increased, as shown in . The bruise depth and specific surface area of bruise indicate that the collision damage due to collision with FUM and soil is small, but that with the screening mesh and steel plate is large. The impact peak force due to collision with FUM and soil is large, while that with the screening mesh and steel plate is small.
Effect of number of collisions
The solid line indicates the fitting curve for the specific surface area of bruise (). The fitting equation is y = 308.47–220.62×+51.945x2-3.915x3, and the coefficient of determination is R2 = 1. The specific surface area of bruise first decreased, then increased, and finally decreased as the number of collisions increases, and its maximum value is 15.47 mm2/g. The dashed line indicates the fitting curve for the bruise depth. The fitting equation is y = 5.25–3.76×+1.07x2-0.09x3, and the coefficient of determination is R2 = 1. The bruise depth first increases and then decreases as number of collisions increases, and its maximum value is 1.41 mm.
Discussion
Discussion of orthogonal results
The factors influencing the bruise depth, in order from most influential to least, were the collision material, dropping height, mass of the FUM and number of collisions. This is not consistent with Deng et al.[Citation38] and Xie et al.[Citation39] who concluded that the factors in order of most influential to least, were the dropping height, collision material, and potato mass. This is attributable to the mass of FUM being much smaller than that of a potato, and the height selected in this study having less impact on FUM than the collision material. The factors influencing the impact peak force were, in order: the mass of the FUM, dropping height, collision material, and number of collisions. This is consistent with the conclusions of Deng et al.[Citation38] The specific surface area of bruise and Ratio of amplitude attenuation are the evaluation indexes for FUM and drum screening structure, so the ranking of the main influencing factors is rare; however a comparative discussion of this does not form part of the present study.
Effect of FUM mass
The bruise depth and impact peak force increase as the mass of the FUM increases; this is because for the same height, collision material, and number of collisions, a larger FUM mass results in a greater energy loss, bruise depth, change in momentum, and impulse. Since the collision period is unchanged, the impact peak force is also greater. The specific surface area of bruise decreased as the mass of the FUM increased. This is not consistent with the conclusions of Wang et al.,[Citation40] in which the surface area of the damage increased as the mass of the FUM increased; however, in their study, the rate of increase of the surface area was smaller than that of the mass, so the surface area per unit mass decreased. Hence, we can conclude that, in a falling collision, a large mass of FUM yields a large impact force and bruise depth, but a small bruise area per unit mass, meaning that FUM is easily broken.
Effect of dropping height
The impact peak force and bruise depth increased as the dropping height increased, as shown in ; this is because for the same mass, collision material, and number of collisions a higher dropping height results in a greater the energy loss and greater bruise depth. The change in momentum, impulse, and impact peak force are also greater because the collision period is unchanged. The specific surface area of the bruise first decreased and then increased as the dropping height increased; this is not consistent with the conclusions of Kursat Celik et al.,[Citation41] Komarnicki et al.,[Citation42] or Zhou et al that the surface area of bruise increased as the dropping height increased.[Citation43] The reason for the decrease in the surface area of bruise at a dropping height of 1200 ~ 1500 mm was the increase in the number breakages. Hence, dropping FUM from a greater height results in a larger force, smaller damage area, and deeper bruise depth, and is more likely to be damaged or even broken.
Effect of collision material
The relationship between the specific surface area and the collision material is consistent with the conclusions of Öztekn et al.[Citation44] or Stopa et al..[Citation45] During drum screening, reducing the direct contact between FUM and the screen or steel plate is an effective way to reduce the amount of mechanical damage. The relationship of the impact peak force is not consistent with the conclusions of Zhang et al that the impact peak force increases with the increase of material hardness.[Citation46] As the hardness of the collision material increased, the Ratio of amplitude attenuation decreased. According to Formula 2, damping coefficient and force increased under the condition of constant decay period. With constant gravity, the impact acceleration and peak force decreased.
Effect of number of collisions
The relationship between number of collisions and specific surface area of bruise is not consistent with the conclusions of Wang et al.[Citation47] or Lu and Wang.[Citation48] This is because FUM is characterized by its small size and weight; for multiple collisions, the probability of the FUM colliding at the same position increased, so the relationship was not obvious. The bruise depth first increased and then decreased as the number of collisions increased, which is related to the increase in the number of breakages. Hence, to reduce the amount of mechanical damage, the number of collisions should be reduced.
Conclusion
The test investigated the effect of mass, dropping height, collision material, and number of collisions on the bruise depth, special surface area of bruise, impact peak force, and Ratio of amplitude attenuation. The orthogonal results showed that the number of collisions had no significant influence on the impact peak force, while the collision material was the only factor with a significant influence on the ratio of amplitude attenuation. Single factor tests indicated that the relationship between the four considered factors and the evaluation index varied according to certain rules. The bruise depth and impact peak force increase as the FUM mass increased, while the specific surface area of the bruise first increases and then decreases with increased FUM mass. The bruise depth and impact peak force increased as this dropping height increases, and the specific surface area of the bruise periodically changes. The bruising depth and damage surface area of FUM increased with an increased hardness of the collision material, and the maximum impact force and ratio of amplitude attenuation decreased with an increased hardness of the collision material. The specific surface area of the bruise periodically changes with drop times, and the bruising depth first increased and then decreased. Based on the above results, in the component design aspect, the dropping height or initial velocity of the roller in the machinery must be reduced to reduce the amount of mechanical damage; Considering the component manufacturing aspect, the hardness of small and elastic materials was selected to reduce FUM damage, increase the fluidity of FUM in drum screening, and improve screening efficiency. This suggestion can serve as an important reference when developing low-loss drum screening or harvesting equipment. Meanwhile, because the irregularity of the shape of FUM, the results of the bumps or depressions of FUM colliding with the other material may not be consistent with result of this study; this is the limitation of the study. Effects of uncontrolled FUM variety and diameter on experimental indexes during field operation may be researched further.
Acknowledgments
We are grateful for the support provided by the Heilongjiang Provincial Key Laboratory of Agricultural Machinery Intelligent Equipment and the Heilongjiang Bayi Agricultural University’s Laboratory of Special Economic Crops Mechanization Equipment.
Disclosure statement
No potential conflict of interest was reported by the author(s).
Additional information
Funding
References
- Ding, C.; Guo, S.; Sun, H.; Ma, W.; Zhou, B.; Wang, Z. Research Progress of Medicinal Plant Fritillaria ussuriensis Maxim. Guiding J. Traditional Chinese Med. Pharm. 2018, 24, 73–75. DOI: 10.13862/j.cnki.cn43-1446/r.2018.03.024.
- Li, H.; Jiang, Y.; Li, P. Chemistry, Bioactivity and Geographical Diversity of Steroidal Alkaloids from the Liliaceae Family. Nat Prod. Rep. 2006, 23, 735–736. DOI: 10.1039/B609306J.
- Jia, M.; Yang, M.; Peng, L.; Zhang, M.; Feng, L. Rapid Discrimination of Fritillary Herbs by a Photochemical Colorimetric Sensor Array. Chinese J. Analytical Chem. 2021, 49, 424–426. DOI: 10.19756/j.issn.0253-3820.201662.
- Wang, Y.; Mushtaq, S. A. Implications of the Digital Economy on Merger Control in Pakistan and China: Policy Implications for Pakistan. J. Politics Law. 2021, 15(1), 40. DOI: 10.5539/jpl.v15n1p40.
- Zhao, J.; Zhao, W.; Tian, S.; Zhang, Q.; Song, J.; Li, Y.; Han, X. Simulation Test of Soil Covered Parts of Fritillaria ussuriensis Maxim Based on EDEM. J. Agric. Mechanization Res. 2023, 45(10), 24–31. DOI: 10.13427/j.cnki.njyi.2023.10.026.
- Wu, L.; Man, D.; Miao, Z.; Li, S.; Wu, H. Design and Finite Element Analysis of 4OPB-1201Fritillaria ussuriensis Maxim Harvester Excavation Device. For. Machinery Woodworking Eouipment. 2020, 48(11), 18–23. DOI: 10.13279/j.cnki.fmwe.2020.0127.
- Song, J.; Qiu, S.; Wang, X. Design and Test on 4B-1200 Type Bulbus Fritillariae Ussuriensis Medicinal Material Harvester. Trans. CSAE. 2015, 31(8), 34–41. DOI: 10.3969/j.issn.1002-6819.2015.08.006.
- Song, J.; Liu, L.; Wang, M.; Zhang, J. Improved Design and Test of 4B-1200 Type Bulbus Fritillariae Ussuriensis Medicinal Materials Harvester. Trans. CSAE. 2017, 33(1), 45–51. DOI: 10.11975/j.issn.1002-6819.2017.01.006.
- Xu, G.; Zhang, Y.; Yang, X.; Chen, G.; Jin, B. Effect of Drum Structure on Particle Mixing Behavior Based on DEM Method. Particuol. 2023, 74, 74–91. DOI: 10.1016/j.partic.2022.05.008.
- Li, S.; Wu, L.; Wei, X.; Man, D.; Miao, Z. Experimental Study and Finite Element Analysis on Bulb Collision Damage of Fritillaria ussuriensis Maxim. J. Agric. Mechanization Res. 2021, 10(1), 126–130. DOI: 10.13427/j.cnki.njyi.2021.10.024.
- Vursavus, K.; Ozguven, F. Determining the Effects of Vibration Parameters and Packaging Method on Mechanical Damage in Golden Delicious Apples. Turk. J. Agric. For. 2004, 28, 311–320.
- Zhao, J.; Liu, J.; Chen, Q.; Saritporn, V. Detecting Subtle Bruises on Fruits with Hyperspectral Imaging. Trans. CSAM. 2008, 39, 106–109.
- Baranowski, P.; Mazurek, W.; Witkowska-Walczak, B.; Sławiński, C. Detection of Early Apple Bruises Using Pulsed-Phase Thermography. Postharvest Biol. Tec. 2009, 53(3), 91–100. DOI: 10.1016/j.postharvbio.2009.04.006.
- Babarinsa, F.; Ige, M. Strength Parameters of Packaged Roma Tomatoes at Break Point Under Compressive Loading. Int. J. Sci. Eng. Res. 2012, 3, 1–8.
- Ahmadi, E.; Ghassemzadeh, H. R.; Sadeghi, M.; Moghaddam, M.; Neshat, S. Z. The Effect of Impact and Fruit Properties on the Bruising of Peach. J. Food Eng. 2010, 97(1), 110–117. DOI: 10.1016/j.jfoodeng.2009.09.024.
- Maness, N. O.; Brusewitz, G. H.; McCullum, T. G. Impact Bruise Resistance Comparison Among Peach Cultivars. Hort. Sci. 1992, 27(9), 1008–1011. DOI: 10.21273/HORTSCI.27.9.1008.
- González-Merino, R.; Hidalgo-Fernández, R. E.; Rodero, J.; Sola-Guirado, R. R.; Sánchez-López, E. Postharvest Geometric Characterization of Table Olive Bruising from 3D Digitalization. Agron. 2022, 12, 27–32. DOI: 10.3390/agronomy12112732.
- Sola-Guirado, R. R.; Bayano-Tejero, S.; Aragon-Rodriguez, F.; Pena, A.; Blanco-Roldan, G. Bruising Pattern of Table Olives (‘Manzanilla’ and ‘Hojiblanca’ Cultivars) Caused by Hand-Held Machine Harvesting Methods. Biosyst. Eng. 2022, 215, 188–202. DOI: 10.1016/j.biosystemseng.2022.01.010.
- Yuwana, Y.; Duprat, F. Prediction of Apple Bruising Based on the Instantaneous Impact Shear Stress and Energy Absorbed. Int. Agrophys. 1998, 12, 133–140.
- Van Zeebroeck, M.; Van Linden, V.; Darius, P.; De Ketelaere, B.; Ramon, H.; Tijskens, E. The Effect of Fruit Properties on the Bruise Susceptibility of Tomatoes. Postharvest Biol. Tec. 2007, 45(2), 168–175. DOI: 10.1016/j.postharvbio.2006.12.022.
- Ahmadi, E. Bruise Susceptibilities of Kiwifruit as Affected by Impact and Fruit Properties. Res. Agric. Eng. 2012, 58(3), 107–113. DOI: 10.17221/57/2011-RAE.
- Fu, H.; Du, W.; Yang, J.; Wang, W.; Wu, Z.; Yang, Z. Bruise Measurement of Fresh Market Apples Caused by Repeated Impacts Using a Pendulum Method. Postharvest Biol. Tec. 2022, 195, 112–143. DOI: 10.1016/j.postharvbio.2022.112143.
- Shahbazi, F. Impact Damage to Chickpea Seeds as Affected by Moisture Content and Impact Velocity. Appl. Eng. Agric. 2011, 27, 771–775. DOI: 10.13031/2013.39557.
- Kursat Celik, H. Determination of Bruise Susceptibility of Pears (Ankara Variety) to Impact Load by Means of FEM-Based Explicit Dynamics Simulation. Postharvest Biol. Tec. 2017, 128, 83–97. DOI: 10.1016/j.postharvbio.2017.01.015.
- Jiménez-Jiménez, F.; Castro-García, S.; Blanco-Roldán, G. L.; Ferguson, L.; Rosa, U. A.; Gil-Ribes, J. A. Table Olive Cultivar Susceptibility to Impact Bruising. Postharvest Biol. Tec. 2013, 86, 100–106. DOI: 10.1016/j.postharvbio.2013.06.024.
- Li, B.; Zhang, F.; Liu, Y.; Yin, H.; Zou, J.; Ou-Yang, A. Quantitative Study on Impact Damage of Yellow Peach Based on Hyperspectral Image Information Combined with Spectral Information. J. Mol. Struct. 2023, 1272, 34176. DOI: 10.1016/j.molstruc.2022.134176.
- Chaiwong, S.; Saengrayap, R.; Rattanakaran, J.; Chaithanarueang, A.; Arwatchananukul, S.; Aunsri, N.; Tontiwattanakul, K.; Jitkokkruad, K.; Kitazawa, H.; Trongsatitkul, T. Natural Rubber Latex Cushioning Packaging to Reduce Vibration Damage in Guava During Simulated Transportation. Postharvest Biol. Tec. 2023, 199, 112273. DOI: 10.1016/j.postharvbio.2023.112273.
- Zhang, S.; Wang, W.; Wang, Y.; Fu, H.; Yang, Z. Improved Prediction of Litchi Impact Characteristics with an Energy Dissipation Model. Postharvest Biol. Tec. 2021, 176, 111508. DOI: 10.1016/j.postharvbio.2021.111508.
- Vipasdamrongkul, P.; Chocharat, S.; Srimunwing, P.; Arwatchananukul, S.; Chaiwong, S.; Saengrayap, R.; Aunsri, N. Guava Bruise Area Calculation Using Color and Grayscale Image Segmentation. InCit. 2022, 29–34. DOI: 10.1109/InCIT56086.2022.10067362.
- Htike, T.; Saengrayap, R.; Kitazawa, H.; Chaiwong, S. Fractal Image Analysis and Bruise Damage Evaluation of Impact Damage in Guava. Information Process. Agric. 2023. DOI: 10.1016/j.inpa.2023.02.004.
- Satitmunnaithum, J.; Kitazawa, H.; Arofatullah, N. A.; Widiastuti, A.; Kharisma, A. D.; Yamane, K.; Tanabata, S.; Sato, T. Microbial Population Size and Strawberry Fruit Firmness After Drop Shock-Induced Mechanical Damage. Postharvest. Biol. Technol. 2022, 192, 112008. DOI: 10.1016/j.postharvbio.2022.112008.
- Xie, S.; Deng, W.; Liu, F. Impact Velocity and Bruising Analysis of Potato Tubers Under Pendulum Impact Test. Rev. Bras. Eng. Agr. Amb. 2023, 27(7). DOI: 10.1590/1807-1929/agriambi.v27n7p559-566.
- Shao, Z.; Wang, H.; Dong, Z.; Yuan, Y.; Li, J.; Zhao, L. Early Bruises Detection Method of Apple Surface Based on Near Infrared Camera Imaging Technology and Image Threshold Segmentation Method. Trans. Chin. Soc. Agric. Mach. 2021, 52(S1), 134–139. DOI: 10.6041/j.issn.1000-1298.2021.S0.017.
- Lu, F.; Ishikawa, Y.; Kitazawa, H.; Satake, T. Impact Damage to Apple Fruits in Commercial Corrugated Fiberboard Box Packaging Evaluated by the Pressure-Sensitive Film Technique. J. Food Agric Environ. 2010, 8, 218–222.
- Saracoglu, T.; Ucer, N.; Ozarslan, C. Engineering Properties and Susceptibility to Bruising Damage of Table Olive Fruit. Int. J. Agric. Biol. 2011, 13, 801–805.
- Wang, W.; Zhang, S.; Fu, H.; Lua, H.; Yang, Z. Evaluation of Litchi Impact Damage Degree and Damage Susceptibility. Comput. Electron. Agr. 2020, 173, 405–409. DOI: 10.1016/j.compag.2020.105409.
- Caserta, A. J.; Navarro, H. A.; Cabezas-G´omez, L. Damping Coefficient and Contact Duration Relations for Continuous Nonlinear Spring-Dashpot Contact Model in DEM. Powder Technol. 2016, 13, 566–590. DOI: 10.1016/j.powtec.2016.07.032.
- Deng, W.; Wang, C.; Xie, S. Test Research on the Impact Peak Force and Damage Depth of Potato. INMATEH-Agric. Eng. 2020, 61(2), 105–114. DOI: 10.35633/inmateh-61-12.
- Xie, S.; Wang, C.; Deng, W. Model for the Prediction of Potato Impact Damage Depth. Int. J. Food. Prop. 2018, 21(1), 2517–2526. DOI: 10.1080/10942912.2018.1534124.
- Wang, F.; Wei, X.; Han, Y.; Zhao, M. Impact Mechanical Characteristics and Damage Analysis of Watermelon. J. Sichuan Agric. Univ. 2016, 34, 185–189. DOI: 10.16036/j.issn.1000-2650.2016.02.010.
- Kursat Celik, H.; Hayri Ustun, H.; Erkan, M.; Rennie, A. E. W.; Akinci, I. Effects of Bruising of ‘Pink Lady’ Apple Under Impact Loading in Drop Test on Firmness, Colour and Gas Exchange of Fruit During Long Term Storage. Postharvest Biol. Tec. 2021, 179, 111561. DOI: 10.1016/j.postharvbio.2021.111561.
- Komarnicki, P.; Stopa, R.; Szyjewicz, D.; Kuta, Ł.; Klimza, T. Influence of Contact Surface Type on the Mechanical Damages of Apples Under Impact Loads. Food Bioprocess Technol. 2017, 10, 1479–1494. DOI: 10.1007/s11947-017-1918-z.
- Zhou, J.; He, L.; Karkee, M.; Zhang, Q. Effect of Catching Surface and Tilt Angle on Bruise Damage of Sweet Cherry Due to Mechanical Impact. Comput. Electron. Agr. 2016, 121, 282–289. DOI: 10.1016/j.compag.2016.01.004.
- Öztekn, Y. B.; Güngör, B. Determining Impact Bruising Thresholds of Peaches Using Electronic Fruit. Sci. Hortic-Amsterdam. 2019, 262(3), 109046. DOI: 10.1016/j.scienta.2019.109046.
- Stopa, R.; Szyjewicz, D.; Komarnicki, P.; Kuta, Ł. Determining the Resistance to Mechanical Damage of Apples Under Impact Loads. Postharvest Biol. Tec. 2018, 146, 79–89. DOI: 10.1016/j.postharvbio.2018.08.016.
- Zhang, P.; Ji, H.; Wang, H.; Liu, Y.; Zhang, X.; Ren, C. Quantitative Evaluation of Impact Damage to Apples Using NIR Hyperspectral Imaging. Int. J. Food. Prop. 2021, 24(1), 457–470. DOI: 10.1080/10942912.2021.1900240.
- Wang, W.; Lu, H.; Zhang, S.; Yang, Z. Damage Caused by Multiple Impacts of Litchi Fruits During Vibration Harvesting. Comput. Electron. Agr. 2019, 162, 732–738. DOI: 10.1016/j.compag.2019.04.037.
- Lu, L.; Wang, Z. Dropping Impact Mechanical Characteristics of Apple. Trans. CSAE. 2007, 23(2), 254–257.