
ABSTRACT
The main goal of the research was to find out how the profile and content of individual fatty acids changes in Slovak ewe and cow’s lump cheeses (TSG – Traditional Specialty Guaranteed by European Union). Local farmer produced the cheese. We have analyzed 94 samples of cheeses produced during the production season by the GC/FID method. Fatty acids were found in various concentrations. The following fatty acids were present in the highest concentrations in Ewe’s lump cheese: palmitic acid C16:0 (25.67–35.59 g/100 g), oleic acid C18:1 (n-9) (16.26–25.92 g 100 g−1), myristic acid C14:0 (10.15–14.41 g 100 g−1) and and stearic acid C18:0 (7.23–10.95 g 100 g−1); in Cow’s lump cheese palmitic acid C16:0 (29.46–36.94 g/100 g), oleic acid C18:1 (n-9) (18.93–26.54 g 100 g−1), myristic acid C14:0 (10.07–13.26 g 100 g−1 and stearic acid C18:0 (8.13–10.44 g 100 g−1). Significant (p < .005) changes in individual fatty acid concentrations was found over the production season for most fatty acids. Small farmers can learn the technological process of producing TSG products, but it is important to consider particular seasonal changes in the quantity of fat and fatty acids. From a nutritional perspective, high vaccenic acid concentrations are advantageous, whereas high saturated myristic and palmitic acid concentrations are dubious. The results of this research can be used to supplement the national specification of the TSG Slovak traditional Ewe’s lump cheese (Ovčí hrudkový syr – salašnícky).
KEYWORDS:
Introduction
The dairy industry holds an important position in food production worldwide, especially those bound to cow breeding for many countries, including Slovakia. In a smaller proportion, the sheep breeding program presents an integrated and valuable part, where the ewe’s milk is used to produce traditional dairy products such as cheeses with TSG designation[Citation1]. Nowadays, with similar trends in the past, sheep and cattle farming are essential sectors of Slovak agriculture. Holstein, Slovak Simmental, and Slovak Pinzgauer are the most prevalent breeds of cattle used for milk production in Slovakia. Improved Valachian, Tsigai, Lacaune, and Slovak dairy sheep are the most prevalent kinds of sheep. A free housing arrangement and an indoor production method are popular for dairy cattle farms. Domestic dairy sheep flocks (Tsigai, Improved Valachian, and Slovak dairy sheep) are mostly raised in semi-extensive (or “Carpathian”) production systems, with an average enterprise altitude of 500–800 m above sea level. A seasonal lambing schedule characterizes this kind of farming in the winter and pasture grazing in the summer. A little over 40% of the milk produced is converted directly on the farms into cheese, with the remainder being sent to dairies. Several domestic breeds are bred with milk breeds, like the Lacaune and East Friesian breeds to increase milk production. This approach is typical for an intense farming system when animals are housed indoors year-round and only receive a brief summer grazing period near the milking station.[Citation2]
Since raw milk and/or milk products have long been promoted as excellent sources of nourishment, humans naturally consume them as part of a well-balanced diet. Selected components (proteins, minerals, vitamins, lipids, and carbohydrates) in milk and milk products are beneficial to maintain gastrointestinal health and the immune system.[Citation3] Based on such knowledge about specific health benefits for this product category, they are popular and naturally included in the diet of many households worldwide.
One of the most intricate naturally occurring lipids is ruminant milk fat. Nearly 400 fatty acids with various numbers of carbon atoms were discovered using chromatographic and spectroscopic methods (ranging from 2–28). They are divided into three categories based on the amount of carbon in them: long-chain fatty acids (C > 10), medium-chain fatty acids (C 5–C 10), and short-chain fatty acids (C2–C4).[Citation4] The following fatty acid types are found in milk fat and are distinguished by having straight and branched carbon chains and even and odd numbers of carbon atoms with various degrees of saturation (saturated, mono, and polyunsaturated).[Citation5,Citation6] Studies on milk composition, particularly those that focus on fatty acid detection, have revealed that most of these acids are present in very small amounts (0.1%) and that half of the fatty acids in dairy products are saturated.[Citation5]
Given the geographic and climatic characteristics of the Slovak Republic, traditional ewe’s and cow’s lump cheese production is a significant part of the agricultural practices and economy in this region.[Citation7] The unique conditions contribute to distinct changes in the fatty acid (FA) composition of the dairy products, especially in ewe’s and cow’s lump cheeses.[Citation8] However, comprehensive information about these changes and their underlying mechanisms remains sparse. A preliminary study revealed significant differences in the overall FA composition between ewe’s and cow’s milk, particularly in the proportion of short-chain FAs, such as butyric and caproic acids.[Citation9] Ewe’s cheese demonstrated a higher concentration of these FAs compared to cow’s cheese, which may be due to the distinctive metabolic pathways and enzyme systems in sheep and cows.[Citation10] Additionally, research has noted a remarkable seasonal variation in the FA profile of cheeses.[Citation11] This seasonal effect was more pronounced in ewe’s cheese, presumably due to the seasonal feeding habits of ewes, which significantly affect the milk’s FA composition.[Citation12] Mono-unsaturated fatty acids (MUFAs) also differ notably between ewe’s and cow’s cheeses. While ewe’s cheese contains a higher amount of oleic acid, cow’s cheese has more palmitoleic acid.[Citation13] This difference in MUFAs, primarily determined by specific desaturase activities in the mammary gland, can contribute to the unique sensory properties of cheeses.[Citation14] Further investigations are needed to elucidate the impacts of breed-specific genetic variations, lactation stages, and specific feeding regimens on the FA profile[Citation15] of traditional Slovak ewe’s and cow’s lump cheeses. Understanding these dynamics would provide valuable insights into the quality control and standardization of these traditional dairy products.
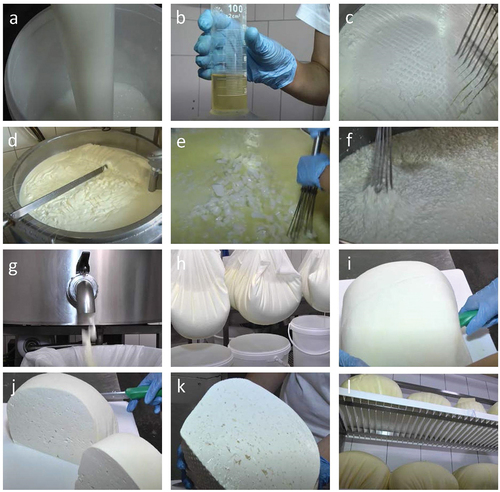
Application to register the name of Ewe’s lump cheese “Ovčí hrudkový syr – salašnícky” was published in the Official Journal of the European Union on 3rd November 2010.[Citation16,Citation17] In shepherd’s huts, this cheese is made from freshly milked sheep (). It gets its distinctive flavor from the manual shaping into a lump during the fermenting process and from the application of old technology. Physical characteristics: spherical shape, lumpy form, weight up to 5 kg. Chemical characteristics Acidity: pH 5.2–4.9, dry matter: at least 40% by weight, and fat content: at least 50% by weight in the dry matter.[Citation18] This cheese can be consequently used for traditional Slovak bryndza cheese production.[Citation19]
Figure 1. The technological process of Ewe’s and Cow’s Lump cheese production..
The study’s primary objective was to confirm or reject our scientific hypothesis that the year’s seasonality has a major impact on the content and composition of fatty acids in Ewe’s and Cow’s lump cheese produced by small food producers. We have created a detailed fatty acid profile of this traditional cheese. The results of our work can be used to supplement the national specification of this product.
Materials and methods
Design of the Experiment
The production process was realized in small food business operator Agrosúča a.s., Dolná Súča, Slovakia, European Union (Coordinates: 48°58′N 17°59′E, Elevation: 429–751 m) from 29/3/2022 to 6/9/2022.
Animals and farming conditions: (i) Ewe’s: 30% Tsigai, 70% Lacaune breeds. Since April were housed in a free-range barn with straw bedding, consequently outside stabled. (ii) Cow’s: the Slovak Spotted Cattle Breed. Housed in a free-range barn with stalls and straw bedding.
Feeding conditions: (i) Ewe’s: stall-fed in winter on haylage and silage. Since April, they have been on pasture. In autumn, after grazing, they were fed the same way as during the winter. (ii) Cow’s: silage, haylage, kernel forage and epicot meal.
Milking conditions: (i) Ewe’s milk was milked on a round parlor, chilled to 14°C and then transported to the farm dairy. (ii) Cow’s milk was milked in the parlor, and the evening and morning milk was cooled to 6°C.
Cheese production process
Ewe’s lump cheese was made from raw milk on the milking day within 2 hours after milking. Cow’s cheese was made from milk collected from evening and morning milking. The milk is heated to between 30 and 32°C. Later, 40 ml of microbial liquid rennet (based on the salt-stabilized fungus Rhizomucor miehei) is added while the mixture is constantly stirred to 100 l of milk (the amount of rennet is determined by the cheesemaker based on its strength). The amount of rennet used also depends on the season (i.e. the quality of the milk, which changes during the milking season). Approximately 30–45 minutes after the rennet is applied, the milk begins to curdle. The curds created in this way are agitated and chopped with a curd harp until they have a grain size of 0.5 to 1 cm. The sliced curds are heated to 32–35°C by adding boiled drinking water that has been cooled to 65°C. This improves the whey’s release from the curd grains. The curds are well mixed before being set aside. After around 10 minutes, the settled curds are manually crushed and massaged into a lump using a cheesecloth. The lump is hung on a hook to drain for roughly two hours. Once the cheese has been drained, it is moved to a heated storage space (the ripening room), where the fermentation process takes place. A ledge made to let the whey drain down is used when cheese that has been formed in cheesecloth is hung on a hook. Fermentation must occur at a temperature of between 18 and 22°C. Under those circumstances, the cheese ferments in two or, at most, three days. Fermentation temperature is kept under observation. The cheese can be sold after it has finished manufacture. The cheese is packaged and marked for sale.[Citation18]
Cheese sampling
Sampling was performed according to ISO 707,[Citation20] and samples were vacuum-packed and frozen at −18°C. Every week, two cheese samples were gathered from the production batch, and once a month, they were transported to the laboratory. To fulfill the study purpose, 46 Ewe’s and 48 Cow’s cheese samples were analyzed. The initial sample was obtained in late March to align with the lambing season observed in this study. The final samples were collected at the beginning of September, coinciding with the completion of cheese production.
Determination of fatty acid content
The fat extraction was performed following ISO 1735:2004 gravimetric method based on the Rose-Gottlieb principle of fat extraction.[Citation21] The milk fat was stored at −18°C until analysis. The preparation of methyl esters of fatty acids was done following ISO 12,966–2. With potassium hydroxide, quick trans-methylation was carried out under alkali-catalyzed conditions. Transmethylation with methanolic potassium hydroxide produces methyl esters. This process does not esterify free fatty acids.[Citation22] The resulting eluate was mixed with 200 l of a 2 M potassium hydroxide methanolic solution, and the glass container was vigorously shaken for about 30 seconds. To counteract the excess potassium hydroxide and stop the saponification of methyl esters, we added 1 g of sodium hydrogen sulfate monohydrate. After settling the salt, the solution was agitated for a brief period before the top layer was transferred to a vial. For GC analysis, the resulting solution was satisfactory.
A Thermo Trace GC Ultra 7820 gas chromatograph system with a FID detector (Thermo Fisher Scientific, Waltham, US) was used to determine the FAMEs profile. This analysis was performed according to ISO 12,966–4.[Citation20] For separation purposes, we used an SPTM-2380 capillary column (Supelco, Bellefonte, PA, USA). This column consists of fused silica; its dimensions are 30 m × 0.25 mm × 0.25 μm. The separation took place as follows: (i) Heating the GC oven to 80°C, heating duration 2 minutes. (ii) Increase the temperature to 180°C at a rate of 10°C/min, a heating time of 10 minutes. (iii) Heat for 2 minutes, increasing temperature by 10°C/min to 250°C. (iv) Maintaining the SSL injector at a temperature of 250°C throughout the analysis. (v) Split-mode sample injection at a flow rate of 25 ml/min. (vi) Keeping the detector’s temperature at 250°C while pumping 40 ml/min of hydrogen and 350 ml/min of air through it. (vii) We used hydrogen at a constant pressure of 0.5 bar as a carrier gas. We used a GENius PF500 hydrogen generator (FullTech Instruments, Rome, Italy).
The FAME detection: to identify individual fatty acids, we used certified reference material: Grain FAME Mix CRM47801 and C4-C24 Even Carbon Saturated FAMEs CRM49453-U from Supelco in Bellafonte, Pennsylvania, USA (Supelco, Bellafonte, PA, USA). We have identified peaks of individual FAMEs by comparing the retention times of reference materials and samples. As a result, we used the XcaliburTM software to quantify each FAME’s peak areas (Thermo Fisher Scientific, Waltham, MA, USA). The peak area of the related FAME to the total peak area of all identified FAMEs was used to express the content of each fatty acid in the sample as a percentage ratio. We have calculated the mean value, standard deviation, coefficient of variation, and min and max value for each fatty acid in Ewe’s and Cow’s lump cheese. Finally, we generated the aforementioned mathematical indications for each of the three main groups of fatty acids – saturated, monounsaturated, and polyunsaturated fatty acids.
Statistical analysis
The Shapiro-Wilk test was used to verify data distribution, and ANOVA was used to analyze variance (Kruskal-Wallis with Dunn pairwise test). We considered the results significant at p < .01. We used the statistical software XLSTAT v. 2021.4.1 (Addinsoft, France). The sums of SFA, MUFA and PUFA were processed using principal component analysis (PCA).
Results
show the fat content of Ewe’s and cow’s lump cheese, respectively. Individual mean values were calculated from two results of two duplicate cheese samples from the same production batch. The overall mean fat content of the Ewe’s lump cheese during the production season was 28.60% (min 24.54, max 32.09%, n = 46) and in the Cow’s lump cheese, 23.80 (min 21.48, max 27.07%, n = 48).
Figure 2. Fat content in Ewe’s Lump Cheese.
Figure 3. Fat content in Cow’s Lump Cheese.
The results of the examination of the fatty acid content are summarized in (for ewe’s lump cheese) and (for cow’s lump cheese). These results represent the mean values of all samples during the production season.
Table 1. Ewe’s lump cheese fatty acid composition.
Table 2. Cow’s lump cheese fatty acid composition.
present the profiles of Ewe’s and Cow’s Lump cheese, respectively. As illustrated in , Ewe’s Lump cheese is characterized by a considerable amount of saturated fatty acids (SFAs), followed by monounsaturated fatty acids (MUFAs) and a lesser extent of polyunsaturated fatty acids (PUFAs). The distribution of these fatty acids is representative of the fatty acid composition typically found in sheep milk cheese.
Figure 4. Ewe’s Lump cheese content of saturated, monounsaturated and polyunsaturated fatty acids.
Figure 5. Cow’s Lump cheese content of saturated, monounsaturated and polyunsaturated fatty acids.
provides a statistical comparison of the fatty acid composition in Ewe’s and Cow’s Lump cheese, with a statistical significance set at p = .001. As depicted in the table, the distribution of individual fatty acids in the cheeses significantly differs. offer an in-depth comparison of the fatty acids content in Ewe’s and Cow’s Lump cheese. specifically focuses on the saturated fatty acids (SFA) content. The comparison reveals a slightly higher SFA content in the Cow’s Lump cheese. represents the comparison of monounsaturated fatty acids (MUFA) content. It is evident from the figure that Cow’s Lump cheese contains a slightly higher proportion of MUFAs. showcases the comparison of polyunsaturated fatty acids (PUFA). Intriguingly, the Ewe’s Lump cheese appears to contain more PUFAs.
Figure 6. Comparison of saturated fatty acids content in Ewe’s and Cow’s lump cheese.
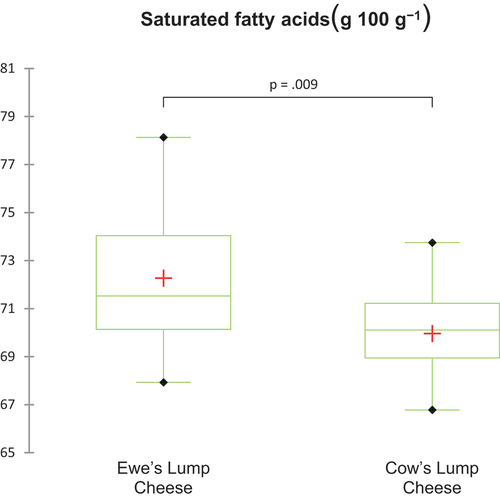
Figure 7. Comparison of monosaturated fatty acids content in Ewe’s and Cow’s lump cheese.
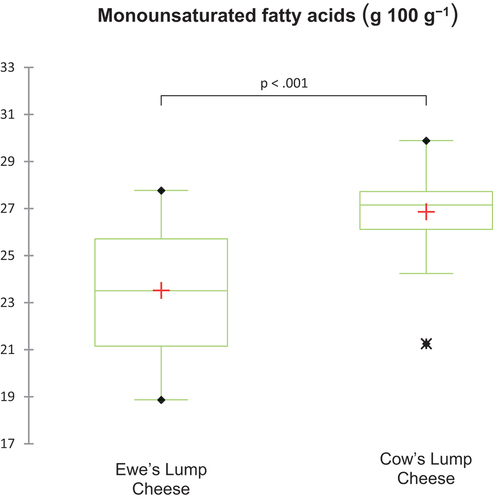
Figure 8. Comparison of polyunsaturated fatty acids content in Ewe’s and Cow’s lump cheese.
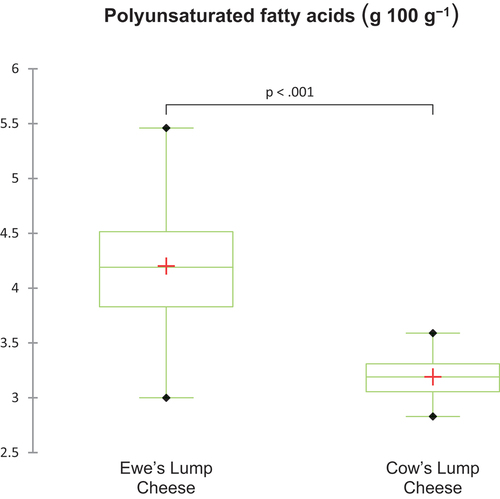
Table 3. Statistical comparison (p = .001) of fatty acid composition in Cow’s and Ewe’s lump cheese.
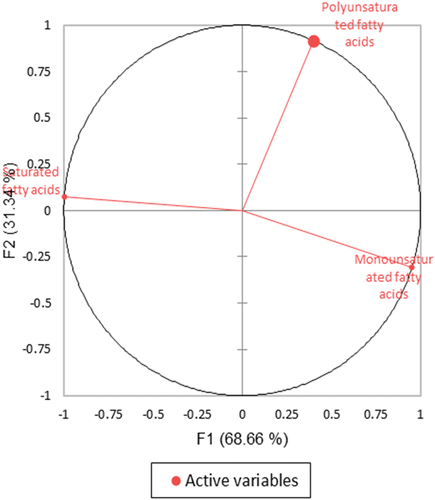
Principal component analysis () was applied to describe the groups of fatty acids by their production season. Results of Bartlett’s test indicate that the data was likely factorable (Chi-square (observed = 253.710), Chi-square (critical = 7.815) and p ≤ .001. The Kaiser-Meyer-Olkin (KMO) test of sampling adequacy revealed that the data were only moderately suitable for the full model (KMO = 0.262). According to the PCA, the first two principal components (PCs) with eigenvalues of 2.060 and 0.940 can be compressed into and explain 100.00% of the overall variation in the variables. Monounsaturated, polyunsaturated, and saturated fatty acids were contrasted in PC1, which explained 68.66% of the inertia, whereas saturated fatty acid concentration was the focus of PC2, which explained 31.34% of the inertia.
Figure 9. PCA analysis of Ewe’s Lump Cheese according to production batch at season.
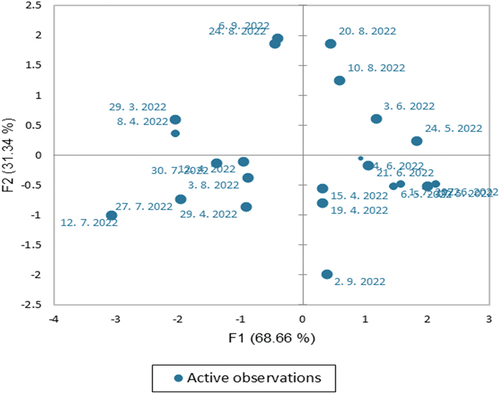
Figure 10. Representation of the main parameters of Ewe’s Lump Cheese by the PCA evaluation.
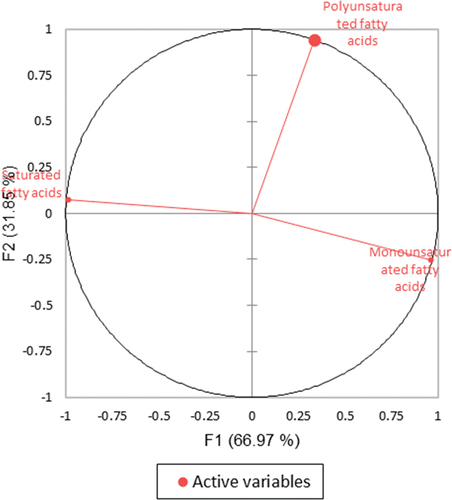
show the results of the principal component analysis used to categorize the fatty acid groups according to the production season. The data was most likely factorable, according to Bartlett’s test results (Chi-square (observed = 56.948), Chi-square (critical = 7.815), and p ≤ .001). The Kaiser-Meyer-Olkin (KMO) test of sampling adequacy revealed that the data were only moderately suitable for the full model (KMO = 0.394). The first two principal components (PCs) of the PCA can be compressed into and account for 98.82% of the total variation in the variables, with eigenvalues of 2.009 and 0.956, respectively. PC1 accounting for 66.97% of the inertia, contrasted the content of monounsaturated, polyunsaturated, and saturated fatty acids, while PC2 explained 31.85% of the inertia by highlighting the various saturated fatty acid contents.
Figure 11. PCA analysis of Cow’s Lump Cheese according to production season.
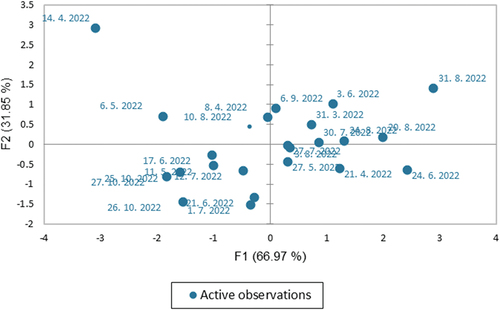
Figure 12. Representation of the main parameters of Cow’s Lump Cheese by the PCA evaluation.
Discussion
Traditional products (TSG) are famous for their specific properties compared to industrially produced dairy products. The taste and smell of these products depend, for example, on the content of fatty acids, low-molecular volatile compounds, enzymatic activity and the activity of microorganisms. The sensory properties related to microbial diversity and principal aroma-active compounds did not markedly differ among individual producers from different geographic regions, which was positive regarding the TSG definition of this cheese.[Citation23] The fat from the analyzed dairy products is characterized by various contents of fatty acids.[Citation24] We have identified 28 different fatty acids () in Ewe’s lump cheese. The fatty-acid profile of milk fat can affect dairy products’ nutritional and market value – their concentration changes during processing, storage and maturation.[Citation25] Storage conditions and cheese ripening can affect cheese’s sensory properties.[Citation26] Higher coefficients of variation were found in the parameter of fat in dry matter, which ranged from 1.75% to 7.98% in Slovak bryndza cheese made from the lump cheese from farm and from 2.71% to 9.77% in samples from industrial dairies.[Citation27] These results are consistent with our findings. We have identified significant fat content variation (p < .005) during the season of lump cheeses used in traditional Bryndza cheese production. The mean fat content in Ewe’s lump cheese was 28.60%. In previous research, we have determined the fat content in 100% ewes Bryndza cheese 24 ± 1.8 g 100 g−1[Citation19] and Oštiepok cheese 28.42 g 100 g−1.[Citation28]
Individual manufacturers in Slovakia state the values of fat content in the dry matter (FDM) and saturated fatty acids content (SFA) of the fresh Ewe’s lump cheese in the product labels: FDM min. 45%, fat: 25 g of which SFA: 18.2 g (Syrex, Zázrivá); FDM 45%, fat: 24.82 g of which SFA: 15.81 g (Hruštínske syrové výrobky); fat: 29 g of which SFA: 21 g (Kozí vŕšok); FDM min 46%, fat: 33 g of which SFA: 22 g (Farma Východná); FDM min 45%, fat: 25 g of which SFA: 18.2 g (Klaudius); FDM min 45%, fat: 25 g of which SFA: 18.2 g (Salaš Krajinka); FDM min 45%, fat: 24.82 g of which SFA: 15.81 g (Bryndziareň Turčianske Teplice); FDM min 43%, fat: 15.18 g of which SFA: 10.65 g (Michal Šuriňiak – KOLIBA); FDM min 48%, fat: 23.75 g of which SFA: 17 g (Plachtinská farma Baránek); FDM min 45%, fat: 26 g of which SFA: 18.2 g (Bukovina); FDM min 40%, fat: 24 g of which SFA: 16 g (Gemerské ovečky); FDM min 46%, fat: 24.8 g of which SFA: 15.7 g (Kluknavská mliekareň); FDM min 48%, fat: 29 g of which SFA: 18 g (Syrmix, Zázrivá); FDM min 48% (Farmfoods, farma Turček). Even based on these data, it is possible to observe regional variability in the total content of FDM and SFA in Ewe’s lump cheese.
The regional aspects are also crucial because other authors[Citation29–31] identified fatty acids profiles of milk samples that have been shown to differ significantly by sampling location but remain approximately constant during cheese production. The difference in the fatty acids composition in milk and cheese samples is mainly linked to the feeding and livestock management practices adapted to regional requirements. These facts were also confirmed in this research.
Changes in nutrition values are closely related to changes in the composition of cheeses. We have identified variations of the fatty acid and fatty acid content. Similar results have been published by Eisenstecken et al..[Citation29] The variations of cis-9,trans-11 C18:2 fatty acids content in milk during pasture season are primarily determined by the content of α-linolenic acid in pasture forage. The higher content of this isomer cis-9,trans-11 C18:2 in Ewe’s milk fat during pasture season in May and September is proportional to the content of α-linolenic acid in pasture forage, while for linoleic acid C18:2 n-6 and oleic acid, a such relationship was not observed.[Citation32] During the ripening of Ewe’s lump cheese, there is an increase in the content of medium-chain fatty acids and their ethyl esters.[Citation33] The content of fatty acids increases with a medium-long chain due to the action of enzymes from various microorganisms, primarily Galactomyces/Geotrichum fungi but also lactobacilli[Citation34,Citation35] or other microorganisms identified in Bryndza cheese from different regions of Slovakia.[Citation36]
Previous research in Slovakia studied seasonal variations in the FA composition of pasture forage plants and conjugated linoleic acid content in ewes’ milk fat. The results suggest that the seasonal variations in conjugated linoleic acid content in ewes’ milk fat are related primarily to the seasonal variation in α-linolenic acid content in grass lipids.[Citation30] We recorded the same trend according to our results.
Some authors published seasonal variations in FA composition, particularly CLA and TVA in milk fat of pasture-grazed ewes[Citation37] as a result of herbs composition in the pasture. The content of Poaceae in an average pasture sample increased from 63% to 81% from May to August, and decreased to 60% in September. The content of Fabaceae decreased from 27% in May to 7% in August, subsequently increasing to 30% in September. The content of Herbaceae was almost the same during May – September (approximately 10%).[Citation31] The milk of ewes grazing pasture is relatively rich in health-affecting unsaturated fatty acids, mainly conjugated linoleic acid (CLA) and trans-vaccenic acid (TVA) when compared with that of ewes fed with total mixed rations.[Citation30] The milk fatty acids seasonal variations observed in the experimental ewe farm located at a lower altitude (250 m a.s.l.) were due to a lower α-linolenic acid content in pasture and a lack of pasture forage as a result of warm and dry summer. Ewes grazing pastures with higher altitudes (800 m a.s.l.) in North Slovakia (Ružomberok) showed a more consistent composition of milk fatty acids in the same pasture season. The meadow hay as a part of a winter diet providing 2-fold higher conjugated linoleic acid and trans-vaccenic acid content in milk compared with a standard winter diet was also collected from this location.[Citation30] Fatty acid composition of ewes’ milk during milking season was significantly changing: SFA 62.29–67.18%, MUFA 25.21–29.81% and PUFA 5.43–7.89%.[Citation30] Fatty acid composition of ewe milk and pasture herbage during pasture season (g 100 g−1): Location Trenčianska Teplá: SFA 60.32–67.06%, PUFA 5.70–8.23%; Location Liptovská Anna: SFA 63.16%, PUFA 8.18%.[Citation31] In contrast with these results, we found a higher concentration of SFA 72.27 ± 2.91 g 100 g−1 (min 67.93, max 78.13 g 100 g−1) and a lower concentration of PUFA 4.20 ± 0.68 g 100 g−1 (min 3.00, max 5.46 g 100 g−1) in Ewe’s lump cheese during the production season.
The effect of pasture intake on concentrations of conjugated linoleic acid in the milk of lactating cows was studied by Kelly et al..[Citation38] A study on the causes for the high content of n-3 fatty acids in cow’s milk of alpine origin was studied by Leiber et al..[Citation39] Factors affecting conjugated linoleic acid (CLA) content in milk were studied by Khanal and Olson.[Citation40] Our samples revield the content of Linoleic acid, C18:2(n-6) 2.23 g 100 g−1 and 2.01 g 100 g−1 in Ewe’s and Cow’s lump cheese and the variation was 11.64% and 20.42%, respectively.
An essential part of the production of traditional products is their labeling. The requirements of the EU Regulation 1169/2011 are related to the nutrition values present on the product label.[Citation41] According to the European regulation, the mandatory nutrition declaration shall include the: (a) energy value; and (b) the amounts of fat, saturates, carbohydrates, sugars, protein and salt. This information may be supplemented with an indication of other nutrition declarations like mono-unsaturates, polyunsaturates, and others. Expression and presentation of nutrition values on labels of traditional products produced by small business operators can be a problem for the producer, the consumer, and the official food control body because of fat content and content, saturated fatty acids, mono-unsaturates or polyunsaturates is variable during the production season. Small producers are producing lump cheese following the specification given by the legislation. However, the nutritional properties of cheese are conditioned by the quality of milk, which depends on several factors. In the case of traditional products affected by seasonality, it is impossible to determine the exact nutritional composition reliably. The information on the product label may not reflect reality. Labeling products with nutritional values can be a problem for small producers and the European Union legislative regulation EC 1169/2011[Citation42] gives the expectation for manufacturers of small quantities of products, they do not have to declare nutritional values on the product label.
The frequency and scope of laboratory analyses performed by the manufacturer depending on the manufacturer itself. Still, this verification is often incorporated into the existing HACCP plan after consultation with the official food control body. Also, due to the high price, analyses of quality parameters represent a cost item. Therefore many small producers perform them formally or copy nutritional data from other manufacturers’ labels or calculate them from nutritional tables, which, in the best case, are issued by a national authority. When listing nutritional values on consumer-packaged traditional products produced by small business operators, we recommend a regular analysis of the fat and saturated fatty acid content at least once a year and consequently calculate the mean value representing data from several years. We recommend taking samples at different times of the season. In the case of official food control, the values indicated on the label must follow the results on the test report from an accredited laboratory. Otherwise, there may be sanctions. However, official food control in individual EU countries primarily focuses on food safety parameters, and control of quality indicators is performed less often. For consumers, we recommend that they do not take the information on the labels of these products literally and consider the possibility of their variability. From our analysis, it follows that the ideal solution would be if the legislation contained a legal regulation that would specifically deal with traditional products in such a way that the nutritional data indicated on registered traditional products produced by small producers would have to be indicated on these products, but would only be informative for consumers. Therefore, slight deviations from them would not pose a risk of sanction. National specifications of traditional products should contain information on the variability of the content of nutritional components.
Other studies[Citation43,Citation44] dealt with the possibility of using the fatty acid profile to authenticate traditional products in case of suspected counterfeiting. The determination of the fatty acid profile is interesting, but its use as a marker to determine the authenticity of this product is questionable due to its variability. For this purpose, it will be necessary to analyze a statistically significant amount of cheese samples from different regions of Slovakia. The detection of the addition of extraneous fat or oil will only be reliably proven if the fatty acids are not characteristic of Ewe’s or Cow’s lump cheese. The second possibility is if the added fat or oil causes an enormous increase in the content of any fatty acid characteristic of lump cheese () above its normal concentration, considering the expanded measurement uncertainty. In the following work, we will focus on analyzing a large number of lump cheese samples from all regions of Slovakia, while we will also deal with individual breeds.
Conclusion
The fat content of Ewe’s and Cow’s lump cheese during the production season changed significantly (p < .001). The fat content of Ewe’s lump cheese was 28.60% (SD ± 2.22%, min 24.54, max 32.09%), and in Cow’s lump cheese, 23.80 (SD ± 1.47%, min 21.48, max 27.07). Ewe’s lump cheese included the following amounts of saturated, monounsaturated, and polyunsaturated fatty acids: 72.27 ± 2.91 g 100 g−1, 23.53 ± 2.76 g 100 g−1, and 4.20 ± 0.68 g 100 g−1 and, respectively in Cow’s lump cheese was 70.06 ± 1.75 g 100 g−1, 26.79 ± 1.84 g 100 g−1 and 3.18 ± 0.20 g 100 g−1. Fatty acids content in both kinds of cheese changed significantly (p < .001) during the production season, which can be related to the free grazing of sheep in the meadows; by representing individual plants grazed by animals, the water content in the feed; air temperature during the summer; stage of lactation of individual animals and health status of animals. The following fatty acids were present in the highest concentrations in Ewe’s lump cheese: palmitic acid C16:0 (25.67–35.59 g/100 g), oleic acid C18:1 (n-9) (16.26–25.92 g 100 g−1), myristic acid C14:0 (10.15–14.41 g 100 g−1) and and stearic acid C18:0 (7.23–10.95 g 100 g−1); in Cow’s lump cheese palmitic acid C16:0 (29.46–36.94 g/100 g), oleic acid C18:1 (n-9) (18.93–26.54 g 100 g−1), myristic acid C14:0 (10.07–13.26 g 100 g−1 and stearic acid C18:0 (8.13–10.44 g 100 g−1). Due to their varied contents, declaring the content of specific fatty acids on a product label by small food business operators can be challenging. Declaring nutritional values is useless for small food business owners using the conventional production method. The results of our work can help refine the specification of these traditional cheeses.
Disclosure statement
No potential conflict of interest was reported by the author(s).
Additional information
Funding
References
- Drouilhet, L.; Lecerf, F.; Bodin, L.; Fabre, S.; Mulsant, P. Fine Mapping of theFecllocus Influencing Prolificacy in Lacaune Sheep. Anim Genet. 2009, 40, 804–812. DOI: 10.1111/j.1365-2052.2009.01919.x.
- Krupová, Z.; Michaličková, M.; Krupa, E.; Huba, J.; Koleno, A. 11. Optimisation of Economic Parameters and Determinants of Ruminant Production in the Slovak Republic. Cattle Husbandry In Eastern Europe And China. 2014, 145–160. DOI: 10.3920/978-90-8686-785-1_11.
- Tunick, M. H.; Van Hekken, D. L. Dairy Products and Health: Recent Insights. J. Agric. Food Chem. 2014, 63(43), 9381–9388. DOI: 10.1021/jf5042454.
- Dei Cas, M.; Paroni, R.; Saccardo, A.; Casagni, E.; Arnoldi, S.; Gambaro, V.; Saresella, M.; Mario, C.; La Rosa, F.; Marventano, I., et al. A Straightforward LC-MS/MS Analysis to Study Serum Profile of Short and Medium Chain Fatty Acids. J. Chromatogr. B. 2020, 1154, 121982. DOI: 10.1016/j.jchromb.2020.121982.
- Jensen, R. G. The Composition of Bovine Milk Lipids: January 1995 to December 2000. J. Dairy Sci. 2002, 85, 295–350. DOI: 10.3168/jds.s0022-0302(02)74079-4.
- Gómez-Cortés, P.; Juárez, M.; de la Fuente, M. A. Milk Fatty Acids and Potential Health Benefits: An Updated Vision. Trends Food Sci. Technol. 2018, 81, 1–9. DOI: 10.1016/j.tifs.2018.08.014.
- Kováčová, M.; Výrostková, J.; Dudriková, E.; Zigo, F.; Semjon, B.; Regecová, I. Assessment of Quality and Safety of Farm Level Produced Cheeses from Sheep and Goat Milk. Appl. Sci. 2021, 11(7), 3196. DOI: 10.3390/app11073196.
- Paszczyk, B.; Łuczyńska, J. The Comparison of Fatty Acid Composition and Lipid Quality Indices in Hard Cow, Sheep, and Goat Cheeses. 1667. Foods. 2020, 9(11), 11. DOI: 10.3390/foods9111667.
- Markiewicz-Kęszycka, M.; Czyżak-Runowska, G.; Lipińska, P.; Wójtowski, J. Fatty Acid Profile of Milk - a Review. Bulletin Of The Veterinary Institute In Pulawy. 2013, 57(2), 135–139. DOI: 10.2478/bvip-2013-0026.
- Mollica, M.; Trinchese, G.; Cimmino, F.; Penna, E.; Cavaliere, G.; Tudisco, R.; Musco, N.; Manca, C.; Catapano, A.; Monda, M., et al. Milk Fatty Acid Profiles in Different Animal Species: Focus on the Potential Effect of Selected PUFAs on Metabolism and Brain Functions. Nutrients. 2021, 13(4), 1111. DOI: 10.3390/nu13041111.
- Eisenstecken, D.; Stanstrup, J.; Robatscher, P.; Huck, C. W.; Oberhuber, M. Fatty Acid Profiling of Bovine Milk and Cheese from Six European Areas by GC‐FID and GC‐MS. 2020. Int. J. Dairy Technol. 2021, 74(1), 215–224. DOI: 10.1111/1471-0307.12749.
- Fusaro, I.; Giammarco, M.; Chincarini, M.; Odintsov Vaintrub, M.; Palmonari, A.; Mammi, L. M. E.; Formigoni, A.; Di Giuseppe, L.; Vignola, G. Effect of Ewe Diet on Milk and Muscle Fatty Acid Composition of Suckling Lambs of the Protected Geographical Origin Abbacchio Romano. Animals. 2019, 10(1), 25. DOI: 10.3390/ani10010025.
- Szterk, A.; Ofiara, K.; Strus, B.; Abdullaev, I.; Ferenc, K.; Sady, M.; Flis, S.; Gajewski, Z. Content of Health-Promoting Fatty Acids in Commercial Sheep, Cow and Goat Cheeses. 1116. Foods. 2022, 11(8), 8. DOI: 10.3390/foods11081116.
- Palmquist, D. L.; Denise Beaulieu, A.; Barbano, D. M. Feed and Animal Factors Influencing Milk Fat Composition. J. Dairy Sci. 1993, 76(6), 1753–1771. DOI: 10.3168/jds.s0022-0302(93)77508-6.
- Conte, G.; Palombo, V.; Serra, A.; Correddu, F.; D’Andrea, M.; Macciotta, N. P. P.; Mele, M. Study of the Fatty Acid Profile of Milk in Different Sheep Breeds: Evaluation by Multivariate Factorial Analysis. Animals. 2022, 12(6), 722. DOI: 10.3390/ani12060722.
- Commission Regulation (EU) No 984/2010 of 3 November 2010 entering a name in the register of traditional specialities guaranteed [Ovčí hrudkový syr – salašnícky (TSG)]. OJ L 286, 4.11.2010. 3–4. Available at: http://data.europa.eu/eli/reg/2010/984/oj
- Commission Implementing Regulation (EU) 2017/764 of 2 May 2017 approving non-minor amendments to the specification for a name entered in the register of traditional specialities guaranteed (Ovčí hrudkový syr — salašnícky (TSG)) C/2017/2779 OJ L 114, 3.5.2017. 22–22 Available at: http://data.europa.eu/eli/reg_impl/2017/764/oj
- Publication of an application for registration pursuant to Article 8(2) of Council Regulation (EC) No 509/2006 on agricultural products and foodstuffs as traditional specialities guaranteed.1 OJ C 20, 27.1.2010. 33–37. https://eur-lex.europa.eu/legal-content/EN/TXT/?uri=CELEX%3A52010XC0127%2807%29&qid=1674123363663
- Zajác, P.; Beňová, E.; Židek, R.; Čapla, J.; Benešová, L.; Čurlej, J.; Golian, J. Detection of Adulteration of Traditional Slovak Bryndza Ewe’s Cheese with Cow’s Lump Cheese by Isoelectric Focusing of Gamma Caseins. Int. J. Food Prop. 2021, 24, 1034–1060. DOI: 10.1080/10942912.2021.1953066.
- ISO 12966-4: 2015. Animal and Vegetable Fats and Oils—Gas Chromatography of Fatty Acid Methyl Esters—Part 4: Determination by Capillary Gas Chromatography. ISO: Geneva, Switzerland, 2015.
- ISO 1735:2004 (IDF 5:2004) Cheese and processed cheese products – Determination of fat content – Gravimetric method (Reference method). International standard organisation, ISO: Geneva, Switzerland, 2004.
- ISO 12966-2: 2017. Animal and Vegetable Fats and Oils—Gas Chromatography of Fatty Acid Methyl Esters—Part 2: Preparation of Methyl Esters of Fatty Acids. ISO: Geneva, Switzerland, 2017.
- Šaková, N.; Sádecká, J.; Lejková, J.; Puškárová, A.; Koreňová, J.; Kolek, E.; Valík, Ľ.; Kuchta, T.; Pangallo, D. Characterization of May Bryndza Cheese from Various Regions in Slovakia Based on Microbiological, Molecular and Principal Volatile Odorants Examination. Journal Of Food & Nutrition Research. 2015, 3, 239–251.
- Paszczyk, B.; Łuczyńska, J. Fatty Acids Profile, Conjugated Linoleic Acid Contents and Fat Quality in Selected Dairy Products Available on the Polish Market. Czech J. Food Sci. 2020, 38(2), 109–114. DOI: 10.17221/341/2019-cjfs.
- Voblikova, T.; Permyakov, A.; Rostova, A.; Masyutina, G.; Eliseeva, A. Study of Fatty-Acid Composition of Goat and Sheep Milk and Its Transformation in the Production of Yogurt. KnE Life Sci. 2020. DOI: 10.18502/kls.v5i1.6161.
- Semjon, B.; Král, M.; Pospiech, M.; Reitznerová, A.; Maľová, J.; Tremlová, B.; Dudriková, E. Application of Multiple Factor Analysis for the Descriptive Sensory Evaluation and Instrumental Measurements of Bryndza Cheese as Affected by Vacuum Packaging. Int. J. Food Prop. 2018, 21, 1508–1522. DOI: 10.1080/10942912.2018.1494194.
- Štefániková, J.; Ducková, V.; Miškeje, M.; Kačániová, M.; Čanigová, M. The Impact of Different Factors on the Quality and Volatile Organic Compounds Profile in “Bryndza” Cheese. Cheese. Foods. 2020, 9(9), 1195. DOI: 10.3390/foods9091195.
- Zajác, P.; Martišová, P.; Čapla, J.; Čurlej, J.; Golian, J. Characteristics of Textural and Sensory Properties of Oštiepok Cheese. Potravinarstvo Slovak J. Food Sci. 2019, 13(1), 116–130. DOI: 10.5219/855.
- Eisenstecken, D.; Stanstrup, J.; Robatscher, P.; Huck, C. W.; Oberhuber, M. Fatty Acid Profiling of Bovine Milk and Cheese from Six European Areas by GC‐FID and GC‐MS. Int. J. Dairy Technol. 2020, 74(1), 215–224. DOI: 10.1111/1471-0307.12749.
- Ostrovský, I.; Pavlíková, E.; Blaško, J.; Górová, R.; Kubinec, R.; Margetín, M.; Soják, L. Variation in Fatty Acid Composition of Ewes’ Milk During Continuous Transition from Dry Winter to Natural Pasture Diet. Int. Dairy J. 2009, 19(9), 545–549. DOI: 10.1016/j.idairyj.2009.03.006.
- Meľuchová, B.; Blaško, J.; Kubinec, R.; Górová, R.; Dubravská, J.; Margetín, M.; Soják, L. Seasonal Variations in Fatty Acid Composition of Pasture Forage Plants and CLA Content in Ewe Milk Fat. Small Ruminant Res. 2008, 78, 56–65. DOI: 10.1016/j.smallrumres.2008.05.001.
- Soják, L.; Pavlíková, E.; Blaško, J.; Meľuchová, B.; Górová, R.; Kubinec, R.; Ebringer, L.; Michalec, M.; Margetín, M. The Quality of Slovak and Alpine Milk Products Based on Fatty Acid Health Affecting Compounds. Slovak J. Anim. Sci. 2009, 42(2), 62–59.
- Kolek, E.; Koreňová, J.; Kuchta, T. Dynamics of Medium Chain Fatty Acids During Ripening of ewes’ Lump Cheese. Trendy v potravinárstve. 2018, 1, 56–59.
- Collins, Y. F.; McSweeney, P. L. H.; Wilkinson, M. G. Lipolysis and Free Fatty Acid Catabolism in Cheese: A Review of Current Knowledge. Int. Dairy J. 2003, 13(11), 841–866. DOI: 10.1016/s0958-6946(03)00109-2.
- Pangallo, D.; Šaková, N.; Koreňová, J.; Puškárová, A.; Kraková, L.; Valík, L.; Kuchta, T. Microbial Diversity and Dynamics During the Production of May Bryndza Cheese. Int. J. Food Microbiol. 2014, 170, 38–43. DOI: 10.1016/j.ijfoodmicro.2013.10.015.
- Kačániová, M.; Nagyová, Ľ.; Štefániková, J.; Felsöciová, S.; Godočíková, L.; Haščík, P.; Horská, E.; Kunová, S. The Characteristic of Sheep Cheese “Bryndza” from Different Regions of Slovakia Based on Microbiological Quality. Potravinarstvo Slovak J. Food Sci. 2020, 14, 69–75. DOI: 10.5219/1239.
- Nudda, A.; McGuire, M. A.; Battacone, G.; Pulina, G. Seasonal Variation in Conjugated Linoleic Acid and Vaccenic Acid in Milk Fat of Sheep and Its Transfer to Cheese and Ricotta. J. Dairy Sci. 2005, 88, 1311–1319. DOI: 10.3168/jds.s0022-0302(05)72797-1.
- Kelly, M. L.; Kolver, E. S.; Bauman, D. E.; Van Amburgh, M. E.; Muller, L. D. Effect of Intake of Pasture on Concentrations of Conjugated Linoleic Acid in Milk of Lactating Cows. J. Dairy Sci. 1998, 81, 1630–1636. DOI: 10.3168/jds.s0022-0302(98)75730-3.
- Leiber, F.; Kreuzer, M.; Nigg, D.; Wettstein, H.-R.; Leo Scheeder, M. R. A Study on the Causes for the Elevated n−3 Fatty Acids in Cows’ Milk of Alpine Origin. Lipids. 2005, 40(2), 191–202. DOI: 10.1007/s11745-005-1375-3.
- Khanal, R. C. ;.; Olson, K. C. Factors Affecting Conjugated Linoleic Acid (CLA) Content in Milk, Meat, and Egg: A Review. Pak. J. Nutr. 2004, 3(2), 82–98. DOI: 10.3923/pjn.2004.82.98.
- Regulation (EU) No 1169/2011 of the European Parliament and of the Council of 25 October 2011 on the Provision of Food Information to Consumers, Amending Regulations (EC) No 1924/2006 and (EC) No 1925/2006 of the European Parliament and of the Council, and Repealing Commission Directive 87/250/EEC, Council Directive 90/496/EEC, Commission Directive 1999/10/EC, Directive 2000/13/EC of the European Parliament and of the Council, Commission Directives 2002/67/EC and 2008/5/EC and Commission Regulation (EC) No 608/2004 Text with EEA Relevance. OJ L 304, 22.11.2011. 18–63. https://eur-lex.europa.eu/eli/reg/2011/1169/oj
- Regulation (EU) No 1169/2011 of the European Parliament and of the Council of 25 October 2011 on the Provision of Food Information to Consumers, Amending Regulations (EC) No 1924/2006 and (EC) No 1925/2006 of the European Parliament and of the Council, and Repealing Commission Directive 87/250/EEC, Council Directive 90/496/EEC, Commission Directive 1999/10/EC, Directive 2000/13/EC of the European Parliament and of the Council, Commission Directives 2002/67/EC and 2008/5/EC and Commission Regulation (EC) No 608/2004 Text with EEA Relevance. OJ L 304, 22.11.2011. 18–63
- Iverson, J. L.; Sheppard, A. J. Detection of Adulteration in Cow, Goat, and Sheep Cheeses Utilizing Gas-Liquid Chromatographic Fatty Acid Data. J. Dairy Sci. 1989, 72, 1707–1712. DOI: 10.3168/jds.s0022-0302(89)79285-7.
- Zhang, L.; Li, P.; Sun, X.; Wang, X.; Xu, B.; Wang, X.; Ma, F.; Zhang, Q.; Ding, X. Classification and Adulteration Detection of Vegetable Oils Based on Fatty Acid Profiles. J. Agric. Food Chem. 2014, 62(34), 8745–8751. DOI: 10.1021/jf501097c.