
 ?Mathematical formulae have been encoded as MathML and are displayed in this HTML version using MathJax in order to improve their display. Uncheck the box to turn MathJax off. This feature requires Javascript. Click on a formula to zoom.
ABSTRACT
In this study, the effects of six thawing methods (flowing water thawing, FWT; water immersion thawing, WIT; room temperature air thawing, RTAT; low temperature air thawing, LTAT; ultrasonic-assisted thawing, UAT; and microwave thawing, MT) on water holding capacity (WHC), shear force, tissue microstructure, thiobaric acid active substances (TBARS), myofibrillar fragmentation index (MFI), protein secondary structure and myofibrillar protein (MP) oxidation of frozen chicken feet were investigated. The results demonstrated that UAT improved the sample tenderness with a minimum shear force of 775.67 ± 63.30 g. The WHC of the UAT sample also presented a high level; the thawing and cooking losses reached 4.20 ± 0.33% and 3.23 ± 0.35%, respectively. Although the LTAT sample presented a lower loss in the thaw (2.72 ± 0.23%) and a high α-helix content (30.54 ± 1.69%), it showed a significantly higher TBARS value (0.62 mg MDA/kg) (P < .05). On the other hand, it was observed a significant inhibition of fat oxidation in the FWT sample (0.19 ± 0.01 mg MDA/kg) (P < .05). However, the SDS-PAGE diagram showed that the MPs in this sample exhibited a significant degradation. Furthermore, the MT process could lead to partial overcooking of the chicken feet, resulting in poor physicochemical properties. Overall, the results indicate that the UAT method could be the most recommended process to thaw chicken feet, providing optimal tenderness with more intact microstructure and less MP degradation. This study provides relevant evidence, for consumers and industrial practice, regarding thawing methods that can be applied to frozen chicken feet
Introduction
In 2021, China was considered the world’s second-largest producer of broiler chickens.[Citation1] However, only China and a few Asian countries eat chicken feet, a by-product of the broiler process, due to the influence of dietary habits. Currently, significant imports are required to meet China’s high demand for chicken feet. According to the General Administration of Customs P.R. China,[Citation2] in 2021, this country imported 673, 884 tons of frozen chicken feet. Furthermore, frozen chicken feet need to be thawed before processing and eating. However, the studies performed on the thawing of chicken feet remain inadequate, and the quality of frozen chicken feet after thawing is not satisfactory.
Nowadays, as food transportation methods have increasingly incorporated freezing technology, thawing techniques have evolved as well. It has been described that different thawing methods will lead to different effects on meat quality.[Citation3] Traditional water and air thawing methods have been commonly used, but significant nutrient loss occurs.[Citation4] According to studies by Chandirase et al.,[Citation5] water bath and room temperature thawing methods could induce a high moisture loss rate, while beef through refrigerator thawing presented a lower shear force. The refrigerator-thawed samples exhibited higher lipid oxidation than the air and water-thawed samples.[Citation6] Currently, the UAT and MT methods have been reported frequently due to their great potential. For instance, ultrasonic method can decrease the thawing time,[Citation7] maintain better protein properties,[Citation8] inhibit lipid oxidation,[Citation9] reduce water loss, and improve product quality.[Citation10] On the other hand, with the MT method, a fast thawing rate and a lower decrease in nutritional value can be achieved.[Citation11] However, this method also leads to cause local overheating and higher costs.[Citation12]
Myofibrillar protein (MP) is a crucial component of meat protein, accounting for 55 to 60% of total protein, mainly composed of actin, myosin, actinomycin, tropomyosin, and troponin.[Citation13] Moreover, MP contains several functional characteristics, including solubility, water retention, and gelation, which are closely related to the processing characteristics of meat products. All these functional characteristics can also impact the quality of water-holding capacity (WHC), texture, sensory, and other qualities of meat products.[Citation14] Recently, some studies reported changes in physical conditions on MP and MP gelation, mainly in heating and cycles of freeze-thaw. For example, Du et al.[Citation15] investigated the structural changes and gel properties of carp MP under the synergistic effects of heating and pH. Additionally, Pan showed that repeated freeze-thaw cycles reduced the thermal stability and destroyed the MP structure, and these changes were positively correlated with the fat content.[Citation16] However, the effects of thawing treatments on meat MP remain unclear compared to other physical treatments, such as heating and freezing.
In this study, frozen chicken feet were used to determine the effects of six thawing methods, including flowing water thawing (FWT), water immersion thawing (WIT), room temperature air thawing (RTAT), low temperature air thawing (LTAT), ultrasonic-assisted thawing (UAT), and microwave thawing (MT), on WHC, shear force, tissue microstructure, thiobaric acid active substances (TBARS), myofibrillar fragmentation index (MFI), protein secondary structure, and MP oxidation. Through the comparison of the six thawing methods, on the one hand, it aims to provide basic data and a theoretical basis for the selection of appropriate thawing methods in the production and processing of frozen chicken feet. On the other hand, it enables individuals to approach the massive influx of frozen chicken feet into the Chinese market in a more methodical manner.
Materials and methods
Materials
In this study, the frozen chicken feet from yellow-feathered broiler chickens were purchased from Tiantiangou supermarket in Yibin City, Sichuan Province, China. The material was transported to the laboratory in 20 min at a cold temperature and then stored at −18°C for further use. Furthermore, 2-thiobarbituric acid and calcium chloride were purchased from Shanghai Macklin Biochemical Co., Ltd. (Shanghai, China). The other analytical-grade chemical reagents used were purchased from Chengdu Kelong Chemical Co., Ltd. (Chengdu, China).
Thawing treatments
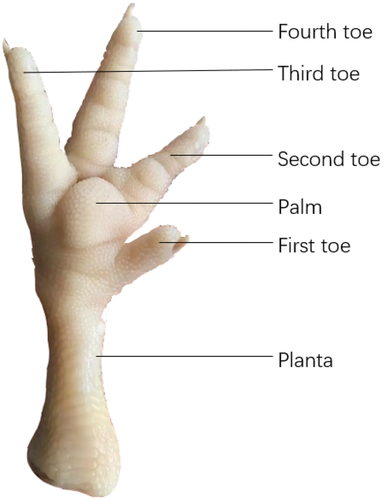
In this study, 108 frozen chicken feet (with 32 ± 5 g) were thawed using six thawing methods, each treatment group was composed of 18 frozen chicken feet. Briefly, the frozen chicken feet thawed during the thawing methods until the central palm temperature reached 4°C (). The specific thawing treatment was as follows: (1) in FWT, the samples were wrapped in poly-ethylene bags (130 mm × 190 mm), placed under the flowing water with a fixed flow rate (water temperature: 20 ± 0.5°C, flow rate: 33 ± 1 cm3/s), and the central palm central temperature of chicken feet was measured using a thermocouple (Testo 735–1, Testo AG Co., Ltd., Lenzkirch, Germany); (2) in WIT, the frozen chicken feet were placed in poly-ethylene bags containing 1 L of static water (water temperature: 20 ± 0.5°C); (3) in RTAT, the samples were placed on a glass tray and thawed on the experimental platform without a heat source (room temperature: 21 ± 0.5°C); (4) in LTAT, the samples were thawed in polyethylene bag at 4°C; (5) in UAT, an ultrasonic cleaning machine (KQ−700DE, Kunshan Ultrasonic Instrument Co., Ltd, Jiangsu, China) was used to thaw samples in poly-ethylene bags containing water to cover the surface of the samples. The parameters used were according to a previous study[Citation17]: temperature of 20°C, power of 280 W, and working frequency of 40 kHz; and (6) in MT, the samples were placed into a glass tray in a microwave oven. The parameters to perform the MT in this study were applied according to previous methodologies with some modifications[Citation18,Citation19]: temperature ranging between of 100°C to 105°C, power of 200 W, and 2,450 MHz frequency. The thawing method intermittently occurred every 15 s with an interval of 5 s.
Figure 1. Overview of chicken feet used in this study.
Thawing time and Water Holding Capacity (WHC)
Thawing time
In this study, the thawing time was recorded when the central palm temperature of the chicken feet reached 4°C ().
Thawing loss
In this experiment, the weight of samples was evaluated according to a previous method.[Citation20] Therefore, the weight was determined before thawing and designated as M0, and the weight of samples dried with absorbable paper after thawing as collected was M1. Finally, the thawing loss rate was calculated according to Equationequation (1)(1)
(1) .
Cooking loss
In this study, the cooking loss was evaluated according to a previous methodology.[Citation21] Briefly, the meat samples were accurately weighed, boiled in a water bath at 80°C. Then, when the central palm temperature reached 70°C, the meat samples were collected and cooled to room temperature. In this experiment, the sample weights before and after cooking were designed as M2 and M3, respectively. Finally, the cooking loss (%) was calculated using Equationequation (2)(2)
(2) .
Shear force
To measure the shear force, the chicken feet samples with a relatively uniform weight were thawed and immersed in a water bath at 80°C until the central palm temperature reached 70°C. Then, the samples were removed, cooled at room temperature for 10 min, and placed at 4°C for 4 h. After bone removal by the same manipulation, the first, second, third, and fourth toes were cut (). For this assay, samples were collected and measured in triplicated. Each sample was sheared along the same position (perpendicular to the toe) by a texture analyzer with an HDP/BSW probe (TA-XT plus; Stable Micro System Co., Ltd., Leicestershire, UK). The pretest speed was set to 2.00 mm/s, the test speed was defined as 2.00 mm/s, and the posttest speed was 10.00 mm/s. Furthermore, the target mode was defined as Distance, and the distance was 42.00 mm.
TBARS assay
In this study, the TBARS parameter was performed according to a previous study with some modifications.[Citation22] Briefly, the thawed samples were deboned and minced. Then, 10 g of meat was added to 50 mL of 7.5% (w/w) trichloroacetic acid (containing 0.1% (w/w) EDTA), shaken for 30 min, and filtered twice using a medium-speed filter paper. Then 5 mL of the supernatant was mixed with 5 mL of 0.02 mol/L thiobarbituric acid (TBA) and placed in water bathed at 95°C for 40 min. After the mix was ice bathed for 5 min, centrifuged at 1 600 g for 5 min, and shaken with 5 mL of chloroform. After the supernatant was collected and the absorbance was measured at 532 nm and 600 nm (UV−1900i, Shimadzu Co., Ltd., Kyoto, Japan). In this assay, the amount of substances that react with TBA was expressed as the mass of malondialdehyde (MDA) per 1 kg of meat. Finally, the TBARS values were calculated according to Equationequation (3)(3)
(3) .
Where “10” is the 10 g sample; “72.6” is the relative molecular weight of MDA; “155” is the molar absorption coefficient. (L/(mol cm)).
MFI evaluation
This study also evaluated the MFI parameter, and for that, the chicken feet were stripped of bones and tendons, and 4 g was used. After, 15 mL of a pre-cooled MFI buffer (containing 100 mmol/L of potassium chloride, 20 mmol/L of potassium phosphate, 0.1 mmol/L of EDTA, and 1 mmol/L of calcium chloride solution, pH = 7.0) was added to the samples. Then, under an ice bath the samples were homogenated 3 times at 10,000 r/min for 30 s with 1 min intervals. After homogenization, a buffer solution was added until a volume of 40 mL was obtained, followed by freezing centrifugation (1,000 g, 15 min at 4°C). Then, the supernatant was discarded, the precipitate was resuspended in 40 mL pre-cooled MFI buffer, and the supernatant was discarded by freezing centrifugation (1,000 g, 15 min at 4°C). After, 20 mL of pre-cooled MFI buffer was added to the precipitate, and the suspension was filtered using a 200-mesh filter cloth. The centrifuge tube was rinsed with 10 mL of precooled MFI buffer, filtered, and the filtrate was placed into a beaker for further use. In this experiment, the mass concentration of protein in the filtrate was determined by the biuret method, where the mass concentration of protein filtrate was adjusted to 0.5 mg/mL with MFI buffer, and the absorbance was measured at 540 nm wavelength. Finally, the values were multiplied by 200 and defined as MFI.
Scanning Electron Microscopy (SEM) analysis
In this study, to perform the SEM analysis, the planta parts of the thawed chicken feet were selected (), and a 1.0 cm × 1.0 cm sample was cut with a 1 cm × 1 cm × 2 cm blade mold and fixed for 1 day at 4°C in a 2.5% glutaraldehyde solution. After fixation, the samples were washed with distilled water, and the gradient was eluted in an ethanol solution (50%, 70%, 80%, and 90%) for 15 min, followed by standing in anhydrous ethanol for 30 min. This procedure was repeated three times. After vacuum freeze drying (SCIENTZ−12N; Scientz biotechnology Co., Ltd., Ningbo, China) and coating gold (SBC−12; Zhongke Science Instrument Co., Ltd., Beijing, China), the microstructure of the samples was observed and photographed by SEM (VEGA3; TESCAN Co., Ltd., Brno, Czech Republic).
Raman spectroscopy
A Raman spectrometer (DXR; Thermo Scientific, Waltham, USA) was applied to measure the secondary protein structure of the chicken feet, and for that, a previous method was followed.[Citation23] In this assay, the samples (with 1 cm × 1 cm × 1 cm) acquired from the planta were scanned at 785 nm laser wavelength under a 10 × objective lens. Three different spots were measured for each sample using the scanning range between 200 and 3,300 cm−1.
MP isolation
The MP extraction was performed according to a previous methodology, Bing’s method, with slight modifications.[Citation24] Briefly, 5 g of bone-removed and minced chicken feet were extracted using an extraction buffer solution (5× the volume, 0.1 mol/L NaCl, 2 mmol/L MgCl2, 1 mmol/L EDTA, and 10 mmol/L K2HPO4, pH = 7.0) and homogenized at 10,000 r/min. Then, the precipitate was washed using the extraction buffer at 4°C for 10 min at 2,000 g, and this process was repeated 4 times until the washed solution was clear. After, the solution was filtered using a 200-mesh filter cloth, and the precipitated part was dissolved in a buffer solution (containing 20 mmol/L phosphate buffer and 0.6 mol/L NaCl, pH = 7.0). The MP concentration was determined using the Biuret method with bovine serum protein as a standard protein. Finally, the extracted MP was stored at 4°C for further use.
Sodium Dodecyl Sulfate-Polyacrylamide Gel Electrophoresis (SDS-PAGE)
In this experiment, the MP was diluted to a final concentration of 5 mg/mL, mixed with the loading buffer (ratio of 3:2), and boiled for 5 min at 100°C. Then, 10 μL of the mixture and 5 μL of protein marker (11 to 245kDa, Tiangen Biotech Co., Ltd, Beijing, China) were loaded into the polyacrylamide gel composed of separation glue (12%) and concentrated glue (4%). The samples were run at 80 V in the beginning, and the voltage was increased to 120 V when the sample entered the separation gel. After electrophoresis, the gel was stained with Coomassie brilliant blue R−250 for 1 h. After, a decolorization solution containing 10% ethanol, 5% acetic acid, 85% water was applied for 12 h. Finally, the protein bands were detected using a gel imager (Tanon 2500B, Tanon Co., Ltd., Shanghai, China).
MP secondary structure
The secondary structure of MP was determined by circular dichroism (CD) and modified according to the method reported by Jia et al.[Citation25] In this assay, a concentration of 0.2 mg/mL MP solution in 1 mm quartz cells was used to obtain the CD spectra. The samples were measured at 120 nm/min in a wavelength range between 200 and 260 nm using a spectropolarimeter (Chirascan VX, Applied Photophysics Co., Ltd, UK).
Statistical analysis
All experiments were performed in triplicate, and the results were expressed as mean ± standard deviation (SD). Significant differences were determined using Duncan test. All the statistical analyses were performed using SPSS 21 (IBM Corporation, Armonk NY, USA). A P-value <.05 indicates significant differences. The data was organized and drawn using Origin 9.8 and Microsoft Excel 2016. The Raman spectrum was obtained using the Peakfit V4.12 software to analyze the secondary structure.
Results and discussion
Thawing time and WHC
The results of thawing time, thawing loss and cooking loss of thawed samples are shown in . The findings showed that the time consuming observed in the LTAT method was significantly higher than in the other thawing methods (P < .05). Moreover, the time consumption in MT was the shortest compared to the other methods. Previous studies also described that Antarctic krill samples were thawed from − 18 to − 4°C in 826 min, and a smaller temperature difference between the sample and the ambient temperature was detected, resulting in a flattening of the thawing rate in the later stages of thawing.[Citation26] Nevertheless, due to the different thickness distributions of the samples in this study, MT could induce local meat overripening. It has been described that water can conduct heat with higher efficiency than air. Therefore, FWT, WIT, and UAT required a shorter time to thaw when compared to samples thawed using the air method. For example, UAT can induce ice crystal vibration[Citation27] and cavitation bubbles by ultrasonic.[Citation28] Therefore, this process can decrease the thawing time compared to WIT.
Table 1. Thawing time and WHC of different thawing methods.
The thawing and cooking losses in frozen meat products are crucial indexes to measure the WHC of frozen meat products.[Citation29] It has been reported that when frozen chicken feet are thawed, the internal ice crystals are transformed into water.[Citation30] However, a loss in nutritional value, an increase in microbial reproduction, and protein denaturation can occur if this water is not absorbed. The results in demonstrated that the LTAT method exhibited a significantly lower thawing loss rate than the other five methods (P < .05). The results suggest that during the LTAT, the ice crystals inside the chicken feet can slowly melt, and the water is absorbed. Moreover, the slow thawing process will not induce great damage to some water-locked tissues. On the other hand, MT showed the highest thawing loss, reaching 5.12%, which was significantly higher than FWT, WIT, RTAT, and LTAT. However, no significant differences were observed when compared to the UAT method (P > .05). Wan et al.[Citation30] also reported that the thawing loss of sashimi after MT was significantly higher than in samples subjected to air and water bath thawing methods. Similarly, MT also exhibited the highest cooking loss and presented a significantly higher loss than in the LTAT and UAT methods (P < .05), consistent with previous experimental results of Xia et al.[Citation31] and Chandirase et al.[Citation5] We may infer that the WHC of MT is low and that this may be because of the high thawing temperature, which increases the degree of protein denaturation, harms the tissue structure of the chicken foot, and lowers the WHC of cells.[Citation31]
Shear force
The shear force parameter can be considered to determine the tenderness of the meat. It has been described that a smaller shear force can lead to a higher tenderness and, consequently, to a better meat taste.[Citation32] The results in showed that, the shear force of the in UAT method was lower than in the other methods in analysis, and its mean value of toes was significantly lower than in the FWT, RTAT, and LTAT methods (P < .05). Therefore, this finding agrees with a previous report describing a significantly lower shear force in the geese breast muscles after 300 W ultrasound thawing than in the control group (P < .05).[Citation33] Moreover, no significant differences were observed in the shear force after FWT, WIT, and LTAT methods in the toes (P > .05). Consistent with our results, Zhang et al.[Citation34] also reported that no significant effects were detected in the shear force after WIT, LTAT, and WIT combined with LTAT (P > .05).
Figure 2. Shear force of different toes of chicken feet by different thawing methods. The average is the average of all toes measured under the same thawing method. a-c Different lowercase letters indicate that the shear force of the same part of chicken feet is significantly different between treatments (P < .05). FWT: flowing water thawing, WIT: water immersion thawing, RTAT: room temperature air thawing, LTAT: low temperature air thawing, UAT: ultrasonic-assisted thawing, MT: microwave thawing.
Furthermore, the results demonstrated that the shear force of the first toe thawed by microwave was significantly higher than in the WIT, RTAT, and UAT methods (P < .05). This could occur because the first toe is the smallest compared to the other toes and, consequently, could contain less meat. Therefore, MT can cause overheating and cooking, leading to protein denaturation and loss of moisture.[Citation35] In previous studies, it was found that the shear force of meat was closely related to the moisture content of meat and the denaturation of MP.[Citation36]
Lipid oxidation and MFI
In this study, the effect of thawing methods on fat oxidation and myofibril rupture degree of chicken feet was also evaluated. For that, TBARS and MFI values were used to measure these parameters, respectively. As shown in , the thawing methods induced different effects on TBA and MFI values, and no linear link was observed between the two indexes. However, the lowest TBA and MFI values were found in the FWT samples. This result indicates that the efficient heat exchange that occurred in the FWT method could result in lower effect on lipid and myofibril oxidation. On the other hand, lower MFI values may induce a loss in the optimal tenderness of chicken feet. The TBARS values have been widely applied to characterize the degree of lipid oxidation.[Citation22] In the present study, the TBARS value observed in the LTAT samples reached 0.62 mg/kg, which was significantly higher than in the other methods (P < .05). Our findings were in harmony with that of Zhang et al.,[Citation34] since a lower thawing temperature in chicken breast significantly increased the malondialdehyde content compared to the other thawing methods (P < .05). This may be due to the significantly long thawing time of LTAT, causing the growth and activity of some microorganisms and lipoxygenases. In addition, since singlet oxygen produced by microwave could accelerate lipid oxidation, this could help to explain the high TBARS values in the MT samples.[Citation37]
Figure 3. TBARS values and MFI of chicken feet thawed by different methods. a-d Different lowercase letters indicate significant difference (P < .05). MFI: myofibrillar fragmentation index, FWT: flowing water thawing, WIT: water immersion thawing, RTAT: room temperature air thawing, LTAT: low temperature air thawing, UAT: ultrasonic-assisted thawing, MT: microwave thawing.
Furthermore, MFI has been considered a relevant parameter for assessing myofibrillary degradation.[Citation38] The results in revealed that the WIT and MT methods induced the most significantly higher MFI values (P < .05). On the other hand, FWT presented the lowest MFI value. Some reports described that a higher MFI value indicates a higher degree of myofibrillary fragmentation, and consequently, the MFI value is positively correlated with the tenderness of the meat.[Citation39] Therefore, the damage degree of myofibril structure in muscle cells was the highest in samples treated with WIT and MT methods, followed by the UAT method. Although the time required by the MT method was shortened, this could cause significant damage to the myofibrils. This damage could occur due to the rapid release of heat generated by microwave heating. Additionally, in this study, a higher level of MFI was found in the UAT method, confirming the low shear force of the UAT method. Similarly, a previous study reported a disruption of actin filaments due to a decrease in the shear force of duck meat and an increase in MFI after ultrasonic treatment at 40 kHz and 300 W.[Citation33]
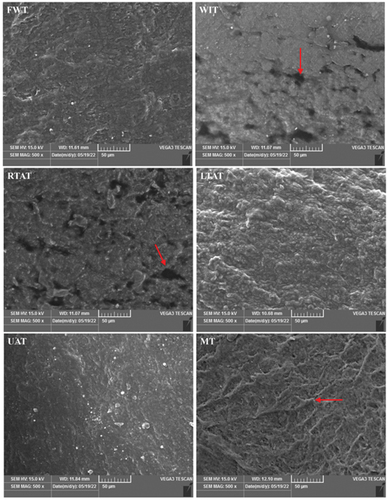
Figure 4. Microstructure of planta surface of chicken feet (scanning electron micrographs (SEM), magnification × 500). FWT: flowing water thawing, WIT: water immersion thawing, RTAT: room temperature air thawing, LTAT: low temperature air thawing, UAT: ultrasonic-assisted thawing, MT: microwave thawing.
Microstructure analysis using SEM
The characteristics of tissue microstructure have been associated with the WHC, shear force, and muscle fiber status of thawed meat.[Citation9] The effect of six thawing methods on the microstructure of chicken feet was also evaluated in this study. Therefore, a SEM analysis was performed to determine this effect, and the results are shown in . For example, scanning electron micrographs performed on chicken feet thawed using WIT revealed that this sample contained holes and breaks along the surface. Moreover, samples treated with the RTAT method exhibited obvious holes compared to the FWT, LTAT, UAT, and MT methods. Nonetheless, FWT and LTAT showed topographical structures that are significantly different from the WIT and RTAT methods, respectively. It has been described that the loss of porous tissue surface could induce a low WHC.[Citation40] These distinct holes and breaks in the RTAT method may partially indicate higher thawing and cooking losses than in the LTAT method. In another study, it was found that the thawing of Penaeus monodon using a refrigerator induced less damage on the connective tissues.[Citation41]
Additionally, the topographical structure of the MT samples revealed that the dense connective tissue covered the structure under the cortex, and no harmful alterations were detected in the fibrous connective tissue. Similar to the current results, Wang et al.[Citation42] reported that grass crap meat submitted to microwave heating induced a compact fibrous structure compared to samples treated in a water bath. The microwave heating for a short period will inhibit the stretch of proteins, causing an aggregate topography in the chicken feet. The microscopic structure of frozen chicken feet after ultrasonic showed that the skin tissue was relatively smooth than in the other five methods. Although only clumps of spongy cuticle could be observed in the electron microscopic images of chicken feet thawed by the ultrasonic method, the current study demonstrated that the ultrasonic method destroyed the myofibrils and improved the tenderness since this method can cause structural changes in the inner epidermis.[Citation43,Citation44] The context for the aforementioned conclusion was based on Giroud and Rudall’s study.[Citation45,Citation46] These authors found that changes in several keratin proteins in the cuticle could form disulfide bonds within or between chains, and these cross-linkings would lead to greater stability of the outer layer of the epidermis than the inner layer.
Raman spectrum
The effect of the thawing methods on the Raman spectra bands (200 to 2,400 cm−1) of the chicken feet is shown in . The protein molecular structure can be commonly analyzed using Raman spectroscopy, where amide I and III are often used to characterize the main chain structure of proteins. For example, amide I has been widely applied to study the quantitative analysis of the protein secondary structures content.[Citation47] The results demonstrated that the vibration of the amide I band was mainly located in the Raman spectral band 1,640 to 1,700 cm−1, including stretching vibration in C=O and C-N planes and bending in the N-H plane (specifically expressed as α- helix (1,645 to 1,660 cm−1), β- sheet (1,665 to 1,680 cm−1), β- turns (1,680 to 1,690 cm−1), and random coils (1,660 to 1,665 cm−1)).[Citation48]
Figure 5. The Raman spectra (200 to 2,400 cm−1). The peak in the bold black border is amide I (1,640 to 1700 cm−1). FWT: flowing water thawing, WIT: water immersion thawing, RTAT: room temperature air thawing, LTAT: low temperature air thawing, UAT: ultrasonic-assisted thawing, MT: microwave thawing.
Some studies described that a high proportion of α -helix and β-sheet could provide a more stable protein secondary structure capable of maintaining stable hydrogen bonds between hydrophobic groups.[Citation49] Therefore, in the present study, a decrease in the proportion of α-helix and an increase in β-sheet was observed after the thawing process of meat products.[Citation50] Furthermore, the proportion of β-sheet in the WIT samples was significantly lower than in the other thawing methods (P < .05). On the other hand, a significant decrease in the α-helix was detected compared to the FWT and LTAT methods (P < .05). Therefore, the results suggest that the WIT method can be considered the most severe method that induced damage to the secondary structure. Moreover, the α-helix content in the MT samples was significantly lower than in the LTAT and FWT samples (P < .05), and α-helix was transformed into the β-sheet and random coil, indicating that the secondary structure of the protein was damaged during this process. The results obtained were in harmony with those of Cai et al.[Citation51] and Lan et al.,[Citation52] who noticed that the proportion of random coils in the MT samples was higher than in the other methods. Microwave heat is generated by the interaction between polar molecules, leading to the uneven heating of the sample. This heating can result in the breaking, stretching, and unfolding of hydrogen bonds responsible for maintaining the α-helix structure, and forming β-sheets and random coils.
In addition, more stable hydrogen bonds that maintain the secondary structure of proteins at low temperatures could lead to a significant increase in the proportion of α-helix in the LTAT samples (P < .05). Moreover, as seen in , the α-helix content in the UAT samples was 23.92%, significantly lower than in the FWT and LTAT samples (P < .05). However, the lowest random coil content (23.54%) was observed for this method, while the β-sheet content was significantly higher than in the air thaw and WIT (P < .05). The results indicate that UAT could break the α-helix structure of chicken foot protein to a certain extent, but it did not cause excessive damage.
Table 2. Different proportions of secondary structure of chicken feet protein with six thawing methods.
SDS-PAGE
It has been described that MP is crucial in meat processing due to its capacity to form a gel when heated. Therefore, its parameter can determine the cohesive structure and firm texture of cooked meat products.[Citation53] As shown in , the SDS-PAGE of MP showed the protein components, and the main protein bands corresponded to myosin heavy chain (MHC, 200 kDa), actin (45 kDa), and myosin light chain (MLC, 20 to 30 kDa). Moreover, the results demonstrated that the colors of electrophoretic bands were lighter in the FWT, WIT, and MT samples. On the other hand, the bands corresponding to the RTAT, LTAT, and UAT methods were darker. These results suggest that RTAT, LTAT, and UAT methods showed a lower MP degradation.[Citation19] Additionally, no significant differences were observed in the MHC bands in all thawing methods tested in this study. However, the MT method, compared to the other methods showed slightly less intense bands. The current results were consistent with a previous study that demonstrated that the MT method caused more degradation or aggregation to MPs in porcine longissimus dorsi since microwaves could induce the MHC rupture.[Citation11]
Figure 6. SDS-PAGE diagram. FWT: flowing water thawing, WIT: water immersion thawing, RTAT: room temperature air thawing, LTAT: low temperature air thawing, UAT: ultrasonic-assisted thawing, MT: microwave thawing.
In addition, in the LTAT, RTAT, and UAT methods, some new bands appeared below 35 kDa. Furthermore, the bands below 11 kDa were significantly darker than in the thawing methods. This result suggests that LTAT and RTAT can spend more time in contact with air, aggravating the MP degradation of MP. The vibration induced by the ultrasonic treatment can promote the unfolding of myosin and other proteins and stimulate the functional properties of small proteins. Moreover, the band intensity in FWT samples was weaker than in the other methods, mainly for actin and MLC, indicating a high degree of degradation of these two proteins.
Overall, the SDS-PAGE results showed that no significant damage or degradation of the chicken foot MP was induced after all the thawing methods tested in this study. Consistently, Xia et al.[Citation54] reported that no significant loss or increase was observed in SDS-PAGE of porcine longissimus muscle under five commonly thawing methods as a result of relatively short thawing time.
CD spectra
In this study, the CD spectra of chicken feet MP were also analyzed and the results, are shown in . As described in previous studies, the intensity of the negative peaks at 208 and 222 nm could effectively predict the α-helix content.[Citation55] Therefore, a higher intensity in the negative peaks at 208 and 222 nm corresponded to a higher α-helix content.[Citation25] It has been reported that the α-helix content is crucial for the secondary structure of MPs. As shown in , all the thawing methods presented a high-intensity negative peak at approximately 208 nm. Between all the methods, the groups thawed with water exhibited the lowest level of intensity in the negative peak of MP at 208 nm. Additionally, the RTAT and MT methods showed a medium level of intensity at this peak, while the LTAT and UAT methods exhibited the highest level of intensity. These results agreed with that of Li et al.,[Citation56] who discovered that the α -helix content in MP extracted from the porcine longissimus muscle of the UAT sample was higher than in the RTAT, WIT, and MT methods. However, these authors described that the content was higher in the RTAT method than in the WIT method.
Figure 7. CD spectra. FWT: flowing water thawing, WIT: water immersion thawing, RTAT: room temperature air thawing, LTAT: low temperature air thawing, UAT: ultrasonic-assisted thawing, MT: microwave thawing.
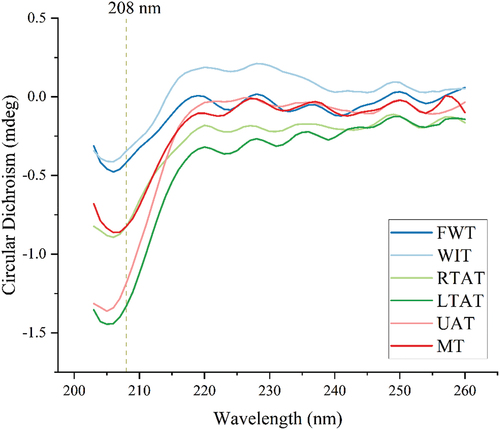
On the other hand, Wang et al.[Citation49] and Cai et al.[Citation51] discovered that the lowest α-helix content in MP was observed in the MT samples than in the other thawing methods. Although, the MP secondary structure of the MT samples was damaged in this study, the values were higher than in the water thawing method. The results indicate that the chicken feet were thinner than their subjects, so the 200 W microwave power used was smaller than the 800 W and 440 W, and the thawing time was shorter than in the other methods. In addition, the α-helix content in MP from chicken feet thawed by flowing water was consistent with the electrophoresis results of this study.
Conclusion
Overall, the results suggest that the UAT method was the most recommended thawing method since it induced a shorter thawing time, presented an optimal shear force, and exhibited a complete surface microstructure and reasonable protein properties (mainly regarding MP). On the other hand, the WHC and TBARS parameters in the UAT samples also presented good levels. Although the LTAT method showed the best WHC and protein secondary structure, these samples also showed the worst tenderness and fat oxidation parameters, and unacceptable thawing time. In addition, the FWT method, the most traditional thawing method used, had a higher susceptibility to fat oxidation and microstructure. However, this method did not exhibit a good index analysis in MP. Moreover, the WIT method showed lower indexes in several parameters and poor performance in protein secondary structure and SEM analysis. Furthermore, the same trend was observed in the RTAT method, however, better results were obtained in protein secondary structure and MP degradation. Finally, MT, exhibited the worst characteristics in all parameters analyzed in this study, and for this reason, this method is not recommended for the thawing of chicken feet. Overall, this study could help to provide relevant information regarding the thawing methods of frozen chicken feet for consumers and industrial practices.
Acknowledgments
This work was supported by Science and Technology Department of Sichuan Province (grant no. 2020YFN0151). The author would like to thank everyone who volunteered to assist with the study.
Disclosure statement
No potential conflict of interest was reported by the author(s).
References
- U.S. Department of Agriculture. (2022). Livestock and Poultry. Market and trade. Retrieved from http://gffiy3bee2aa6444d4f70sqcooxcxpc5ko6kv5.fffb.suse.cwkeji.cn:999/psdonline/app/index.html#/app/downloads
- General Administration of Customs P.R. China. (2022). Customs Statistics. Interactive tables. Retrieved from http://43.248.49.97/indexEn
- Backi, C. J. Methods for (Industrial) Thawing of Fish Blocks: A Review. J. Food Process Eng. 2018, 41(1), e12598. DOI: 10.1111/jfpe.12598.
- Çabas, B. M.; Azazi, I.; Döner, D.; Bayana, D.; Çokgezme, Ö. F.; İ̇çier, F. Comparative Performance Analysis of Ohmic Thawing and Conventional Thawing of Spinach Puree. J. Food Process Eng. 2022, 45(7). DOI: 10.1111/jfpe.14015.
- Chandirase, V.; Thulasi, G. Effect of Different Thawing Methods on Physico-Chemical Characteristics of Frozen Buffalo Meat. J. Food Technol. 2010, 8(6), 239–242. DOI: 10.3923/jftech.2010.239.242.
- Ersoy, B.; Aksan, E.; Ozeren, A. The Effect of Thawing Methods on the Quality of Eels (Anguilla Anguilla). Food. Chem. 2008, 111(2), 377–380. DOI: 10.1016/j.foodchem.2008.03.081.
- Gambuteanu, C.; Alexe, P. Comparison of Thawing Assisted by Low-Intensity Ultrasound on Technological Properties of Pork Longissimus Dorsi Muscle. J. Food Sci. Technol. 2015, 52(4), 2130–2138. DOI: 10.1007/s13197-013-1204-7.
- Wang, Y. Y.; Yan, J. K.; Ding, Y.; Ma, H. Effects of Ultrasound on the Thawing of Quick-Frozen Small Yellow Croaker (Larimichthys Polyactis) Based on TMT-Labeled Quantitative Proteomic. Food. Chem. 2022, 366, 130600. DOI: 10.1016/j.foodchem.2021.130600.
- Li, D.; Zhao, H.; Muhammad, A. I.; Song, L.; Guo, M.; Liu, D. The Comparison of Ultrasound-Assisted Thawing, Air Thawing and Water Immersion Thawing on the Quality of Slow/Fast Freezing Bighead Carp (Aristichthys Nobilis) Fillets. Food. Chem. 2020, 320, 126614. DOI: 10.1016/j.foodchem.2020.126614.
- Li, B.; Sun, D.-W. Novel Methods for Rapid Freezing and Thawing of Foods – a Review. J. Food Eng. 2002, 54(3), 175–182. DOI: 10.1016/S0260-8774(01)00209-6.
- Peng, Z.; Zhu, M.; Zhang, J.; Zhao, S.; He, H.; Kang, Z.; Ma, H.; Xu, B. Physicochemical and Structural Changes in Myofibrillar Proteins from Porcine Longissimus Dorsi Subjected to Microwave Combined with Air Convection Thawing Treatment. Food. Chem. 2021, 343, 128412. DOI: 10.1016/j.foodchem.2020.128412.
- Chizoba Ekezie, F.-G.; Sun, D.-W.; Han, Z.; Cheng, J.-H. Microwave-Assisted Food Processing Technologies for Enhancing Product Quality and Process Efficiency: A Review of Recent Developments. Trends Food Sci. Tech. 2017, 67, 58–69. DOI: 10.1016/j.tifs.2017.05.014.
- Jia, W.; Shi, Q.; Shi, L. Effect of Irradiation Treatment on the Lipid Composition and Nutritional Quality of Goat Meat. Food. Chem. 2021, 351, 351. DOI: 10.1016/j.foodchem.2021.129295.
- Xu, Y.; Xu, X. Modification of Myofibrillar Protein Functional Properties Prepared by Various Strategies: A Comprehensive Review. Compr. Rev. Food Sci. Food Saf. 2021, 20(1), 458–500. DOI: 10.1111/1541-4337.12665.
- Du, X.; Zhao, M.; Pan, N.; Wang, S.; Xia, X.; Zhang, D. Tracking Aggregation Behaviour and Gel Properties Induced by Structural Alterations in Myofibrillar Protein in Mirror Carp (Cyprinus Carpio) Under the Synergistic Effects of pH and Heating. Food .Chem. 2021, 362, 130222. DOI: 10.1016/j.foodchem.2021.130222.
- Pan, N.; Hu, Y.; Li, Y.; Ren, Y.; Kong, B.; Xia, X. Changes in the Thermal Stability and Structure of Myofibrillar Protein from Quick-Frozen Pork Patties with Different Fat Addition Under Freeze-Thaw Cycles. Meat. Sci. 2021, 175, 108420. DOI: 10.1016/j.meatsci.2020.108420.
- Gan, S.; Zhang, M.; Mujumdar, A. S.; Jiang, Q. Effects of Different Thawing Methods on Quality of Unfrozen Meats. Int. J. Refrig. 2022, 134, 168–175. DOI: 10.1016/j.ijrefrig.2021.11.030.
- Zhang, W.; Cao, A.; Shi, P.; Cai, L. Rapid Evaluation of Freshness of Largemouth Bass Under Different Thawing Methods Using Hyperspectral Imaging. Food. Control. 2021, 125, 125. DOI: 10.1016/j.foodcont.2021.108023.
- Cai, L.; Wan, J.; Li, X.; Li, J. Effects of Different Thawing Methods on Conformation and Oxidation of Myofibrillar Protein from Largemouth Bass (Micropterus Salmoides). J. Food Sci. 2020, 85(8), 2470–2480. DOI: 10.1111/1750-3841.15336.
- Bowker, B.; Zhuang, H. Freezing-Thawing and Sub-Sampling Influence the Marination Performance of Chicken Breast Meat. Poult. Sci. 2017, 96(9), 3482–3488. DOI: 10.3382/ps/pex117.
- Kim, H. W.; Lee, S. H.; Choi, J. H.; Choi, Y. S.; Kim, H. Y.; Hwang, K. E.; Park, J. H.; Song, D. H.; Kim, C. J. Effects of Rigor State, Thawing Temperature, and Processing on the Physicochemical Properties of Frozen Duck Breast Muscle. Poult. Sci. 2012, 91(10), 2662–2667. DOI: 10.3382/ps.2012-02154.
- Wu, X.; Song, X.; Qiu, Z.; He, Y. Mapping of TBARS Distribution in Frozen-Thawed Pork Using NIR Hyperspectral Imaging. Meat. Sci. 2016, 113, 92–96. DOI: 10.1016/j.meatsci.2015.11.008.
- Liu, R.; Zhao, S.-M.; Xie, B.-J.; Xiong, S.-B. Contribution of Protein Conformation and Intermolecular Bonds to Fish and Pork Gelation Properties. Food. Hydrocolloid. 2011, 25(5), 898–906. DOI: 10.1016/j.foodhyd.2010.08.016.
- Zhao, B.; Zhang, S.; Li, S.; Zhou, H.; Ren, S.; Li, J.; Chen, W.; Zhao, Y.; Wang, S. Effect of Lipid Oxidation on Myofibrillar Protein Oxidation, structure and Functional Characteristics. Food. Sci. 2018, 39(5), 40–46. DOI: 10.7506/spkx1002-6630-201805007.
- Jia, G.; Nirasawa, S.; Ji, X.; Luo, Y.; Liu, H. Physicochemical Changes in Myofibrillar Proteins Extracted from Pork Tenderloin Thawed by a High-Voltage Electrostatic Field. Food. Chem. 2018, 240, 910–916. DOI: 10.1016/j.foodchem.2017.07.138.
- Cao, R.; Chen, Y.; Zhao, Y.; Liu, Q.; Huang, X. Effect of Thawing Methods on Processing Quality of Antarctic Krill. Trans. Chin. Soc. Agric. Eng. 2015, 31(17), 289–294. DOI: 10.11975/j.issn.1002-6819.2015.17.038.
- Kissam, A. D.; Nelson, R. W.; Ngao, J.; Hunter, P. Water-Thawing of Fish Using Low Frequency Acoustics. J. Food Sci. 1982, 47(1), 71–75. DOI: 10.1111/j.1365-2621.1982.tb11029.x.
- Cheng, L.; Sun, D. W.; Zhu, Z.; Zhang, Z. Emerging Techniques for Assisting and Accelerating Food Freezing Processes: A Review of Recent Research Progresses. Crit. Rev. Food Sci. Nutr. 2017, 57(4), 769–781. DOI: 10.1080/10408398.2015.1004569.
- Tuell, J. R.; Seo, J. K.; Kim, Y. H. B. Combined Impacts of Initial Freezing Rate of Pork Leg Muscles (M. Biceps Femoris and M. Semitendinosus) and Subsequent Freezing on Quality Characteristics of Pork Patties. Meat. Sci. 2020, 170, 108248. DOI: 10.1016/j.meatsci.2020.108248.
- Wan, H.; Ying, X.; Zhao, B.; Zhang, M.; Gong, C.; Xu, K.; Wang, Y.; Yang, Z.; Chen, G.; Wu, T., et al. Effects of Different Thawing Methods on the Thawing Quality of Sashimi Fillets. Food. Sci. 2021. DOI: 10.7506/spkx1002-6630-20210524-290.
- Xia, X.; Kong, B.; Xiong, Y.; Ren, Y. Decreased Gelling and Emulsifying Properties of Myofibrillar Protein from Repeatedly Frozen-Thawed Porcine Longissimus Muscle are Due to Protein Denaturation and Susceptibility to Aggregation. Meat. Sci. 2010, 85(3), 481–486. DOI: 10.1016/j.meatsci.2010.02.019.
- Ji, X.; Luo, X.; Zhu, L.; Mao, Y.; Lu, X.; Chen, X.; Hopkins, D. L.; Zhang, Y. Effect of Medium Voltage Electrical Stimulation and Prior Ageing on Beef Shear Force During Superchilled Storage. Meat. Sci. 2021, 172, 108320. DOI: 10.1016/j.meatsci.2020.108320.
- Li, X.; Wang, Y.; Sun, Y. Y.; Pan, D. D.; Cao, J. X. The Effect of Ultrasound Treatments on the Tenderizing Pathway of Goose Meat During Conditioning. Poult. Sci. 2018, 97(8), 2957–2965. DOI: 10.3382/ps/pey143.
- Zhang, X.; Gao, T.; Song, L.; Zhang, L.; Jiang, Y.; Li, J.; Gao, F.; Zhou, G. Effects of Different Thawing Methods on the Quality of Chicken Breast. Int J. Food Sci. Tech. 2017, 52(9), 2097–2105. DOI: 10.1111/ijfs.13488.
- Taşkıran, M.; Olum, E.; Candoğan, K. Changes in Chicken Meat Proteins During Microwave and Electric Oven Cooking. J. Food Process. Pres. 2019, 44(2). DOI: 10.1111/jfpp.14324.
- Vieira, C.; Diaz, M. T.; Martinez, B.; Garcia-Cachan, M. D. Effect of Frozen Storage Conditions (Temperature and Length of Storage) on Microbiological and Sensory Quality of Rustic Crossbred Beef at Different States of Ageing. Meat. Sci. 2009, 83(3), 398–404. DOI: 10.1016/j.meatsci.2009.06.013.
- Rawls, H. R.; Santen, P. J. V. Singlet Oxygen: A Possible Source of Original Hyperoxides in Fatty Acids. Ann. Ny. Acad. Sci. 1970, 171(1 International), 135–137. DOI: 10.1111/j.1749-6632.1970.tb39316.x.
- Wang, A.; Kang, D.; Zhang, W.; Zhang, C.; Zou, Y.; Zhou, G. Changes in Calpain Activity, Protein Degradation and Microstructure of Beef M. Semitendinosus by the Application of Ultrasound. Food. Chem. 2018, 245, 724–730. DOI: 10.1016/j.foodchem.2017.12.003.
- Li, Z.; Li, M.; Du, M.; Shen, Q. W.; Zhang, D. Dephosphorylation Enhances Postmortem Degradation of Myofibrillar Proteins. Food. Chem. 2018, 245, 233–239. DOI: 10.1016/j.foodchem.2017.09.108.
- Setyabrata, D.; Kim, Y. H. B. Impacts of Aging/Freezing Sequence on Microstructure, Protein Degradation and Physico-Chemical Properties of Beef Muscles. Meat. Sci. 2019, 151, 64–74. DOI: 10.1016/j.meatsci.2019.01.007.
- Boonsumrej, S.; Chaiwanichsiri, S.; Tantratian, S.; Suzuki, T.; Takai, R. Effects of Freezing and Thawing on the Quality Changes of Tiger Shrimp (Penaeus Monodon) Frozen by Air-Blast and Cryogenic Freezing. J. Food Eng. 2007, 80(1), 292–299. DOI: 10.1016/j.jfoodeng.2006.04.059.
- Wang, X.; Muhoza, B.; Wang, X.; Feng, T.; Xia, S.; Zhang, X. Comparison Between Microwave and Traditional Water Bath Cooking on Saltiness Perception, Water Distribution and Microstructure of Grass Crap Meat. Food. Res. Int. 2019, 125, 108521. DOI: 10.1016/j.foodres.2019.108521.
- Du, X.; Li, H.; Nuerjiang, M.; Shi, S.; Kong, B.; Liu, Q.; Xia, X. Application of Ultrasound Treatment in Chicken Gizzards Tenderization: Effects on Muscle Fiber and Connective Tissue. Ultrason. Sonochem. 2021, 79, 105786. DOI: 10.1016/j.ultsonch.2021.105786.
- Chen, L.; Feng, X. C.; Zhang, Y. Y.; Liu, X. B.; Zhang, W. G.; Li, C. B.; Ullah, N.; Xu, X. L.; Zhou, G. H. Effects of Ultrasonic Processing on Caspase-3, Calpain Expression and Myofibrillar Structure of Chicken During Post-Mortem Ageing. Food. Chem. 2015, 177, 280–287. DOI: 10.1016/j.foodchem.2014.11.064.
- Giroud, A.; Leblond, C. P. The Keratinization of Epidermis and Its Derivatives, Especially the Hair, as Shown by X-Ray Diffraction and Histochemical Studies. Ann. Ny. Acad. Sci. 1951, 53(3), 613–626. DOI: 10.1111/j.1749-6632.1951.tb31963.x.
- Rudall, K. M.; Kenchington, W. Arthropod Silks: The Problem of Fibrous Proteins in Animal Tissues. Annu. Rev. Entomol. 1971, 16(1), 73–96. DOI: 10.1146/annurev.en.16.010171.000445.
- Alix, A. J. P.; Pedanou, G.; Berjot, M. Fast Determination of the Quantitative Secondary Structure of Proteins by Using Some Parameters of the Raman Amide I Band. J. Mol. Struct. 1988, 174, 159–164. DOI: 10.1016/0022-2860(88)80151-0.
- Herrero, A. M.; Cambero, M. I.; Ordonez, J. A.; De La Hoz, L.; Carmona, P. Raman Spectroscopy Study of the Structural Effect of Microbial Transglutaminase on Meat Systems and Its Relationship with Textural Characteristics. Food. Chem. 2008, 109(1), 25–32. DOI: 10.1016/j.foodchem.2007.12.003.
- Wang, B.; Kong, B.; Li, F.; Liu, Q.; Zhang, H.; Xia, X. Changes in the Thermal Stability and Structure of Protein from Porcine Longissimus Dorsi Induced by Different Thawing Methods. Food. Chem. 2020, 316, 126375. DOI: 10.1016/j.foodchem.2020.126375.
- Xu, B.; Zhang, M.; Bhandari, B.; Sun, J.; Gao, Z. Infusion of CO2 in a Solid Food: A Novel Method to Enhance the Low-Frequency Ultrasound Effect on Immersion Freezing Process. Innov. Food Sci. Emerg. 2016, 35, 194–203. DOI: 10.1016/j.ifset.2016.04.011.
- Cai, L.; Zhang, W.; Cao, A.; Cao, M.; Li, J. Effects of Ultrasonics Combined with Far Infrared or Microwave Thawing on Protein Denaturation and Moisture Migration of Sciaenops Ocellatus (Red Drum). Vol. 55. [J]. Ultrason Sonochem. 2019, pp. 96–104. doi:10.1016/j.ultsonch.2019.03.017
- Lan, W.; Zhao, Y.; Gong, T.; Mei, J.; Xie, J. Effects of Different Thawing Methods on the Physicochemical Changes, Water Migration and Protein Characteristic of Frozen Pompano (Trachinotus Ovatus). J. Food Biochem. 2021, 45(8), e13826. DOI: 10.1111/jfbc.13826.
- Sun, F.; Huang, Q.; Hu, T.; Xiong, S.; Zhao, S. Effects and Mechanism of Modified Starches on the Gel Properties of Myofibrillar Protein from Grass Carp. Int. J. Biol. Macromol. 2014, 64, 17–24. DOI: 10.1016/j.ijbiomac.2013.11.019.
- Xia, X.; Kong, B.; Liu, J.; Diao, X.; Liu, Q. Influence of Different Thawing Methods on Physicochemical Changes and Protein Oxidation of Porcine Longissimus Muscle. LWT - Food Sci. Technol. 2012, 46(1), 280–286. DOI: 10.1016/j.lwt.2011.09.018.
- Kelly, S. M.; Jess, T. J.; Price, N. C. How to Study Proteins by Circular Dichroism. Acta. Bioch Bioph Sin. 2005, 1751(2), 119–139. DOI: 10.1016/j.bbapap.2005.06.005.
- Li, F.; Wang, B.; Liu, Q.; Chen, Q.; Zhang, H.; Xia, X.; Kong, B. Changes in Myofibrillar Protein Gel Quality of Porcine Longissimus Muscle Induced by Its Structural Modification Under Different Thawing Methods. Meat. Sci. 2019, 147, 108–115. DOI: 10.1016/j.meatsci.2018.09.003.