
 ?Mathematical formulae have been encoded as MathML and are displayed in this HTML version using MathJax in order to improve their display. Uncheck the box to turn MathJax off. This feature requires Javascript. Click on a formula to zoom.
ABSTRACT
The sweet aromas of red jujube extracts and caramel products are similar, and their reactions could bring synergistic flavors. However, the reaction conditions and the characteristic flavor compounds involved are not well known. In this study, the Maillard reaction was performed using red jujube extracts and glucose caramel products. The reaction factors, such as reaction temperature, reaction time, initial pH, and sample-to-solvent ratio, were optimized by the analysis of sensory scores, total flavor compound (TFC) content, and UV absorption at 420 nm. The optimization of the above factors was further performed by response surface methodology, and antioxidant activities were investigated. Single-factor optimization suggested that the preferred conditions for the Maillard reaction were a temperature of 120°C, a reaction duration of 80 min, an initial pH of 8.0, and a sample-to-solvent ratio of 7:1 (jujube extract: caramel product = 7:1). According to the response surface model, the influence of four factors on the TFC content decreased in the following order: reaction temperature > reaction time > sample-to-solvent ratio > initial pH. The optimal conditions were further established according to the response surface model. GC-MS analysis suggested that the TFC content of Maillard products under the optimized conditions increased by 30.8% compared with those of the unreacted samples. The characteristic flavor compounds in the Maillard products were furfuryl alcohol, 3,5-dihydroxy-2-methyl-4H-pyran-4-one (DDMP), and 5-hydroxymethylfurfural (5-HMF), with the contents of 44.68, 176.26, and 139.75 µg/g, respectively. Moreover, the reaction products exhibited potent antioxidant effects.
KEYWORDS:
Introduction
The Maillard reaction, which is a nonenzymatic browning reaction, constitutes a series of reactions between carbonyl compounds (reducing sugars, aldehydes, or ketones) and amino compounds (amino acids, proteins, peptides, etc.). The Maillard reaction has been widely used in food processing and can result in a brown color and unique flavor.[Citation1,Citation2] Common Maillard reactions are performed in aqueous systems using plant extracts, protein hydrolyzates, and amino acids to react with reducing sugars.[Citation3] Additionally, several Maillard reactions can be performed in oil or oil-in-water emulsion systems to study the oxidative stability and roasted flavor of edible oils.[Citation4,Citation5]
The Maillard reaction can be affected by various factors, such as material composition, reaction time, temperature, pH, and solvent.[Citation1,Citation3] Due to the multiple and complex factors, experimental design optimizations, such as single-factor, orthogonal, and response surface methodology (RSM) tests, were used to establish the proper reaction conditions and the impact of each factor.[Citation6] RSM is a visual optimization technique that readily addresses nonlinear problems, and interactions between different factors can be revealed. RSM was used to optimize the Maillard reaction conditions of L-theanine with D-galacturonic acid in tea leaves and xylose with cysteine in fish hydrolyzates.[Citation6–8]
Red jujube is an important fruit belonging to the Ziziphus genus and Rhamnaceae family with high amounts of sugar and nutritions.[Citation9] This fruit can also be used as a raw material for the preparation of flavor and fragrance agents due to its unique sweet and fruity aroma.[Citation10] Previous studies have revealed the bioactive and volatile components formed by the Maillard reaction of jujube during its drying and blackening processes.[Citation11,Citation12] The key Maillard reaction intermediates, such as Amadori and Heyns compounds, in the dried jujubes were also analyzed by HPLC-MS.[Citation13] Moreover, the sweet aroma of red jujubes is similar to that of the caramel products, and their reaction can result in synergistic flavors, which could be a promising way to develop synergistic food flavors.[Citation14,Citation15] However, few studies on this kind of synergistic Maillard reactions have been reported, and neither the process conditions nor the characteristic flavor compounds involved are known.
In this study, the Maillard reaction of red jujube extracts (RJEs) in combination with glucose caramel products (GCPs) was carried out to prepare synergistic food flavors. Four factors, namely, the reaction temperature, reaction time, initial pH, and sample-to-solvent ratio, were studied and optimized. The process conditions were further optimized by RSM using the total flavor compound (TFC) content as the response index. The characteristic flavor compounds and free radical scavenging effects were also studied.
Materials and methods
Materials and instruments
Red jujube with high quality was purchased from Hotan Prefecture, Xinjiang Province, People’s Republic of China. It is identified as Ziziphus jujuba Mill. var. jujuba (Rhamnaceae) and a voucher specimen is kept in the Key Biotechnology Laboratory of Zhengzhou University of Light Industry.
Sodium hydroxide, dichloromethane, ethanol, phenethyl acetate, and 1,1-diphenyl-2-trinitrophenylhydrazine (DPPH) were purchased from Sigma-Aldrich (St. Louis, USA). Glucose (food grade) was obtained from Fufeng Biotechnology Co., Ltd (Inner Mongolia, China). Anhydrous sodium carbonate and anhydrous sodium sulfate were acquired from Damao Chemical Reagent Factory (Tianjin, China).
Red jujube was ground by Q-100A3 high-speed multi-function pulverizer (Shanghai Bingdu Electric Appliance Co., Ltd., Shanghai, China). UV was determined on Ultra-3400 UV-Vis spectrophotometer (Shenzhen Hualun Kangsheng Technology Co., Ltd., Shenzhen, China). GC-MS was carried out on Agilent 6890/5973 GC-MS (Agilent Instruments, Santa Clara, USA). The RJEs were concentrated by R-210 Rotavapor (Buchi Instruments, Flawil, Switzerland).
Preparation of red jujube water extract
High quality red jujubes were ground to powder by a pulverizer. Red jujube powder (400.0 g) was extracted with 4000 mL of water (1:10) at 60°C for 6 h. Subsequently, the water extract was centrifuged at 3000 rpm, and the lower-layer jujube residue was extracted with 4000 mL of water under the above conditions again. Subsequently, the water solutions were combined and concentrated to obtain a dilute crude extract (350.0 g).
Preparation of glucose caramel products
According to the methods in the literature,[Citation15] anhydrous glucose (50.0 g) and anhydrous sodium carbonate (6.0 g) were dissolved in 125 mL of water. Subsequently, the solution was heated in an oil bath at 160°C for 30 min to obtain the glucose caramel products (175.0 g).
Optimization of the reaction temperature
In this study, red jujube water extract was dilute and flowing solution that used as the aqueous solvent. The glucose caramel products were viscous solutions. With a sample-to-solvent ratio of 5:1 (RJE:GCP = 5:1) and initial pH of 7.0, the mixtures were reacted at 80, 100, 120, 140, and 160°C in an oil bath for 100 min. Subsequently, the TFC content and UV420 absorbance of the Maillard products were determined, and sensory evaluations were also carried out.[Citation16]
Optimization of the reaction time
With a sample-to-solvent ratio of 5:1 (RJE:GCP = 5:1) and initial pH of 7.0, the mixtures were reacted at 120°C in an oil bath for 40, 60, 80, 100, and 120 minutes. The TFC content and UV420 absorbance of the Maillard products were determined, and sensory evaluations were also performed as aforementioned.
Optimization of the initial pH
With a sample-to-solvent ratio of 5:1 (RJE:GCP = 5:1), the initial pH of the mixture was adjusted to 5.0, 6.0, 7.0, 8.0, and 9.0 with 1 mol/L NaOH solution. Subsequently, all the mixtures were reacted at 120°C for 80 min. The TFC content and UV420 absorbance of the Maillard products were measured, and sensory evaluations were carried out.[Citation6]
Optimization of the sample-to-solvent ratio
With an initial pH of 8.0, the sample-to-solvent ratios (RJE:GCP) were set to 1:1, 3:1, 5:1, 7:1, and 9:1. Subsequently, all the mixtures were reacted at 120°C for 80 min. The TFC content and UV420 absorbance of the Maillard products were determined, and sensory evaluations were carried out.
GC-MS analysis
The Maillard reaction product (1.0 g) was extracted with 50 mL of CH2Cl2 by ultrasonication for 30 min. The CH2Cl2 layer was obtained and concentrated to 0.9 mL at 50°C under atmospheric pressure. Subsequently, 0.1 mL of the internal standard solution (phenethyl acetate, 0.8211 mg/mL) was added, and the samples were analyzed by GC-MS.
A HP-5 MS column (30 m × 0.25 mm × 0.25 μm) was chosen for GC-MS analysis with injection volume of 1.0 µL. The carrier gas was helium, and the flow rate of carrier gas was 1.0 mL/min. The injector temperature was set at 280°C and split ratio was 10:1. The column temperature was as set as following: initial temperature 50°C, 50°C to 280°C, 6 ℃/min, hold for 10 min. Mass spectrometry condition was EI source and electron energy was 70 eV. The temperature of quadrupole was 150°C and the mass scanning range was 35–550 amu.
The GC-MS data were analyzed, and volatile component identification was performed by comparison of the measured mass data with those in the National Institute of Standards and Technology (NIST) 2020 mass spectral library. GC-MS peaks were identified when its matching score was more than 85%. In combination with the retention index (RI) of linear alkanes C6-C30, the RI of each volatile compound was calculated and further compared with the reported RIs in the literatures.[Citation17,Citation18] The key flavor components, such as furfuryl alcohol, 5-HMF, 2,5-dimethyl pyrazine, and 2,4-dihydroxy-2,5-dimethyl-3(2H)-furan-3-one, were further qualitatively identified by comparison of their retention times and ion fragments with those of the standard compounds in the authors’ laboratory.
For quantitative analysis, an internal standard method was used. For sample preparation, 0.9 mL of the above mentioned concentrated CH2Cl2 extract of the Maillard product was added with 0.1 mL of the internal standard phenethyl acetate solution (0.8211 mg/mL). The contents of all the volatile components were calculated by comparison of their peak areas with those of the internal standard.
Sensory evaluation
The Maillard reaction products (1.0 g) were diluted with 10 mL of pure water. Sensory evaluation was carried out by a professionally trained team (3 males and 3 females). According to the literatures,[Citation17,Citation18] the main aroma characteristics of jujube extract are revealed as sweet, roasted sweet, baking, caramel, fruity, mellow, balsam, bitter, and sour. Based on the primary sensory evaluation results, five key aroma types were selected, namely, caramel, sweet, baking, balsam, and fruit aromas. A caramel aroma is defined as an odor similar to that of sweet caramel, and a baking aroma is the odor produced during the grain baking process. A sweet aroma is a smell similar to that of sugar or honey. The aroma of balsam is considered to be a mixture of sweet, creamy, and extract odors, and the fruit aroma is known as the characteristic smell of fruits. The sensory evaluation scores ranged from 0–4. Finally, the aroma radar maps were constructed by the average evaluation scores.[Citation19]
UV evaluation
The UV absorbance at 420 nm was determined using the diluted Maillard reaction products (0.01 g/mL).[Citation1,Citation6]
Box-Behnken response surface design
Based on single-factor experiments, a response surface optimization test was carried out.[Citation6–8] A three-level, four-variable Box-Behnken design (BBD) was used with reaction temperature (A), reaction time (B), initial pH (C), and sample-to-solvent ratio (D) as the independent variables and TFC content (Y) as the response value (). The BBD was constructed with by Design Expert 10.0 software, and a total of 27 combination experiments were performed. The factors and levels of BBD are shown in . The model was considered significant when p < 0.05. Through ANOVA using the F-test with p <0 .05, the significance of the regression coefficients was determined.
Table 1. Factors and levels of response surface methodology.
DPPH free radical scavenging evaluation
DPPH was dissolved in 50% ethanol to the concentration of 0.1 mg/mL. The unreacted samples (USs) and Maillard reaction samples under the optimized conditions (MRSs) were diluted to the concentrations of 0.2, 0.4, 0.6, 0.8, 1.0, 2.0, 3.0, 4.0, 5.0, 6.0, 7.0, 8.0, 9.0, and 10.0 mg/mL in the plugged test tube, respectively. Subsequently, US and MRS solutions at above concentrations were added with equal volume of DPPH solution. After 30 min at room temperature in the dark, the absorbance of test group was recorded at 517 nm (C2). The blank group (C1) was obtained using equal volume of anhydrous ethanol with US or MRS solutions. The control group (C0) was defined as equal volume of water with DPPH solution. The scavenging rates were calculated through the following formula:
Statistical analysis
Statistical analyses were carried out with GraphPad Prism 8.0, ORIGIN 2022, and Microsoft Excel 2010. The data are expressed as the mean values ± standard deviations (SDs) of triplicate experiments.
Results and discussion
Optimization of the reaction temperature
Red jujube powder was extracted with water to obtain a dilute crude extract, and glucose caramel products were also prepared. With a sample-to-solvent ratio of 5:1 (RJE:GCP = 5:1) and an initial pH of 7.0, the mixtures were reacted at 80, 100, 120, 140, and 160°C in an oil bath for 100 min. Maillard reaction, a kind of nonenzymatic browning reaction, can yield browning products that exhibit strong UV absorption at 420 nm. Therefore, the absorbance at this wavelength can be used to determine the degree of browning.[Citation1,Citation6] As the reaction temperature increased, the A420 signal gradually increased (). A significant increase in A420 signal was observed when the reaction temperature exceeded 120°C.
Figure 1. The TFCs (a, c) and UV absorptions at 420 nm (b, d) of Maillard products at different temperatures and time.
The TFC contents of the Maillard reaction products and the sensory evaluation results are shown in . With increasing reaction temperature, the contents of TFCs first increased and then decreased, and the highest content was found at the 120°C. It was reported that the proper Maillard reaction temperature for L-theanine and D-galacturonic acid was 130°C, which was similar to our results.[Citation6] Moreover, the Maillard products at 120°C exhibited better sensory evaluation results than the other products, especially for the caramel, sweet, and balsam aromas.[Citation17] However, when the temperature was higher than 120°C, some uncomfortable burnt smells could be generated. Therefore, according to the TFC contents and sensory evaluation results, the proper reaction temperature was determined to be 120°C.
Optimization of the reaction time
As shown in , the A420 signal gradually increased with increasing heating time, which suggested the formation of browning pigments. With increasing reaction time, the TFC content first increased and then decreased, and the highest content was found at a reaction time of 80 min, which was also in accordance with the literature.[Citation8,Citation16] Additionally, the caramel, sweet, baking, and balsam flavors of the Maillard products at this reaction time were better than those at other reaction times. Overall, the preferred reaction time was suggested to be 80 min.
Optimization of the initial pH
The initial pH can also affect the quality of Maillard products.[Citation18] Thus, using a sample-to-solvent ratio of 5:1 (RJE:GCP = 5:1), the initial pH of the mixture was adjusted to 5.0, 6.0, 7.0, 8.0, and 9.0. Subsequently, all the mixtures were reacted at 120°C for 80 min. The results are shown in .
Figure 2. The TFCs (a, c) and UV absorptions at 420 nm (b, d) of Maillard products of different initial pH and sample-to-solvent ratios.
Figure 3. Aroma radar diagrams of Maillard products of different reaction temperatures (a), time (b), initial pH (c), and sample-to-solvent ratios (d).
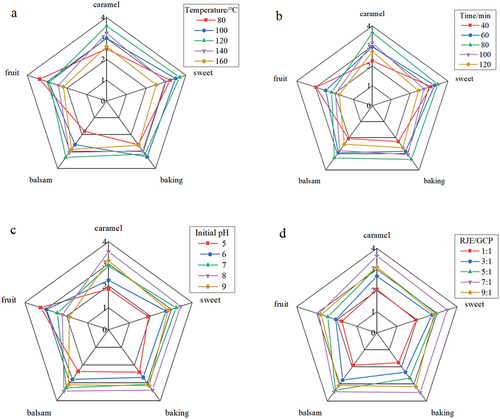
According to , the TFC content first increased and then decreased along with increasing initial pH, and the highest content was revealed at pH 8.0. Moreover, the caramel, sweet, baking, and balsam flavors of the Maillard products at pH 8.0 were better than those of the other products. The colors and UV absorptions of the Maillard products obtained at pH 5.0 ~ 7.0 were similar. However, when the pH exceeded 8.0, the reaction became more drastic, and the color became darker. It has been revealed that acidic conditions can lead to amino groups in the protonated form, preventing the Maillard reaction with sugar and resulting in weak flavors.[Citation9] Therefore, the proper initial pH was suggested to be 8.0.
Optimization of the sample-to-solvent ratio
As shown in , the A420 signal increased with increasing red jujube extract proportion. According to the TFC content and sensory evaluation results (), the optimal RJE/GCP ratio was suggested to be 7:1.
Response surface analysis
Based on single-factor optimization, the response surface test was further carried out with reaction temperature (A), reaction time (B), initial pH (C), and sample-to-solvent ratio (D) as independent variables using the TFC content (Y) as the response value (). A total of 27 experiments were designed and performed according to the three-level, four-variable BBD, and the results are shown in .[Citation6,Citation7,Citation19] The quadratic regression equation was obtained as follows:
Table 2. Test design scheme and results of BBD.
According to the ANOVA results (), the chosen model was highly significant (p < 0.01 and F = 54.333) and the lack of fit term was not significant (p >0 .05), which suggested that the chosen model was appropriate and that the regression equation was well fitted.[Citation16,Citation17] The determination coefficient of the model was R2 = 98.45%, and the adjusted determination coefficient was R2Adj = 96.64%. These results indicated that the model was accurate and could be used for experimental analysis and prediction. According to the P and F values, the influence of the four factors on the TFC (Y) decreased in the order A > B > D > C, which indicated that the reaction temperature exhibited the strongest effect and that the initial pH had a weaker effect on the reaction. The quadratic terms A2, B2, C2 and D2 exhibited highly significant effects on the TFC content (p <0 .01).
Table 3. ANOVA for the response surface model.
According to the response surface models shown in , the top of the surface models could be clearly observed. The interactions between four independent variables could be revealed and analyzed. According to the p values, the interaction terms AD, BC, BD, and CD were significant (p < 0.05, ), and the interaction between reaction time (B) and sample-to-solvent ratio (D) was the strongest (p =0 .004). The effects of four factors on the contents of aroma substances displayed a parabolic trend, which indicated that the response models exhibited maximum values within the chosen area.[Citation19]
Figure 4. Response surface and interaction between four factors on the contents of TFC. a, sample-to-solvent ratio with temperature; b, initial pH with reaction time; c, sample-to-solvent ratio with reaction time; d, sample-to-solvent ratio with initial pH.
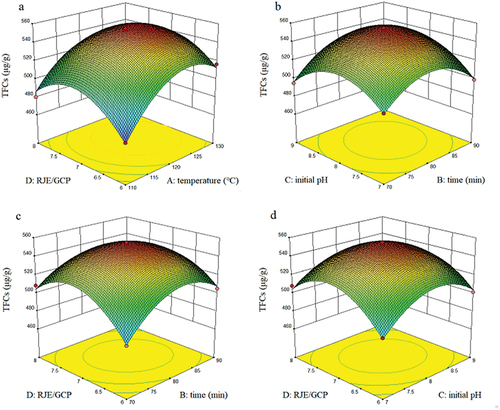
Using the maximal TFC content (Y) as the optimization goal, the best reaction conditions were determined by multiple regression fitting: A = 124.429, B = 81.638, C = 8.085, D = 7.120. The response maximal value Y was 572.107 at these conditions. The optimum process parameters were slightly modified as a reaction time of 124.4°C, a heating duration of 81.6 min, an initial pH of 8.0, and a sample-to-solvent ratio of 7:1. Three individual tests were conducted under these conditions, and the average TFC content was 569.29 μg/g. The experimental results were close to the predicted values, which suggested that the results could be accurately predicted by the response surface model.[Citation6]
GC-MS analysis
The flavor compounds in the RJE, US, and MRS were determined by GC-MS analysis. The relative contents of flavor compounds were calculated according to the internal standard method (). A total of 54 flavor substances were identified from three samples, which were further classified as acids, alcohols, amines, alkanes, ketones, aldehydes, phenols, esters, olefins, furans, and nitrogen heterocyclic compounds. Interestingly, both the total number and the total content of volatile compounds were greater in MRS than in RJE and US. The TFC of MRS (569.29 μg/g) was 30.8% greater than that of US (435.38 μg/g), which suggested that the Maillard reaction could enhance the aroma of this synergistic flavor.
Table 4. Flavor compounds of RJE, US, and MRS identified by GC-MS (µg/g).
Moreover, the contents of alcohol, ketone, and aldehyde flavor compounds were significantly greater in MRS than in US. Among them, furfuryl alcohol (alcohol), 2,3-dihydro-3,5-dihydroxy-6-methyl-4H-pyran-4-one (DDMP, ketone), and 5-hydroxymethylfurfural (5-HMF, aldehyde) were revealed as the characteristic flavor compounds. After the Maillard reaction under the optimized conditions, the contents of furfuryl alcohol, DDMP, and 5-HMF increased from 1.66 to 44.68, from 97.06 to 176.26, and from 85.12 to 139.75 μg/g, respectively. Previous studies have revealed that furfuryl alcohol, DDMP, and 5-HMF are the typical flavor products of the Maillard reaction, which was also in accordance with our study.[Citation10,Citation18] The above three flavor compounds could be formed by the reaction of sugars in RJE and GCP.
Antioxidant activities
In the DPPH free radical scavenging assay (), MRS exhibited overall stronger effects than US. At concentrations of 0 ~ 6 mg/mL, the DPPH free radical scavenging rates of the two samples increased quickly. At concentrations of 6 ~ 10 mg/mL, the free radical scavenging rates were maintained at high levels with values of 80.39% for MRS (10 mg/mL) and 61.60% for US (10 mg/mL). It is known that DDMP and its derivatives exhibit potent radical scavenging effects.[Citation20,Citation21] Thus, the stronger antioxidant effects of MRS could be associated with its greater amount of DDMP, which was approximately 0.82-fold greater than that of US.
Figure 5. DPPH free radical scavenging effects of MRS and US.
Conclusion
To develop new kinds of food flavors and expand the application of red jujubes, the Maillard reaction was carried out using red jujube extracts in combination with caramel products. Single-factor optimization suggested the preferred conditions were a reaction temperature of 120°C, a reaction duration of 80 min, an initial pH of 8.0, and a sample-to-solvent ratio of 7:1. The results were further optimized by response surface methodology. The influence of these four factors on the TFCs was as follows: reaction temperature > reaction time > sample-to-solvent ratio > initial pH. Under the optimized conditions, the TFC content of MRS was 30.8% greater than that of US. MRS also exhibited stronger antioxidant effects than US. All these results suggested that the Maillard reaction of red jujube extracts with caramel products could yield new kinds of synergistic food flavors, and these flavors could be used as food additives in the food industry for further development.
Authors’ contributions
T.-X. Li and Y. Cao wrote the manuscript. Q.-Y. Zhang T. Zhou, and J.-K. Su designed and guided the project. T.-X. Li, Y. Cao, and J.-L. Huang carried out the experiments. L. Guo, D. Xu, and Y. Wang processed the data analyses. Y.-H. Jia and C.-P. Xu contributed to methodology. All authors have read and agreed to the published version of the manuscript.
Disclosure statement
No potential conflict of interest was reported by the author(s).
Additional information
Funding
References
- Shakoor, A.; Zhang, C.; Xie, J.; Yang, X. Maillard Reaction Chemistry in Formation of Critical Intermediates and Flavour Compounds and Their Antioxidant Properties. Food Chem. 2022, 393, 133416. DOI: 10.1016/j.foodchem.2022.133416.
- Jiang, W.; Liu, Y.; Yang, X.; Hu, S. Antioxidant and Antibacterial Activities of Modified Crab Shell Bioactive Peptides by Maillard Reaction. Int. J. Food. Prop. 2018, 21, 2730–2743. DOI: 10.1080/10942912.2018.1561463.
- Habinshuti, I.; Mu, T. H.; Zhang, M. S. Aroma, and Sensory Characteristics of Maillard Reaction Products from Sweet Potato Protein Hydrolysates As Influenced by Different Ultrasound-Assisted Enzymatic Treatments. Food Chem. 2021, 361, 130090. DOI: 10.1016/j.foodchem.2021.130090.
- Troise, A. D.; Fogliano, V.; Vitaglione, P.; Berton-Carabin, C. C. Interrelated Routes Between the Maillard Reaction and Lipid Oxidation in Emulsion Systems. J. Agric. Food. Chem. 2020, 68(43), 12107–12115. DOI: 10.1021/acs.jafc.0c04738.
- Han, Y.; You, M.; Wang, S.; Yuan, Q.; Gao, P.; Zhong, W.; Yin, J.; Hu, C.; He, D.; Wang, X. Enzymatic Methods for the Preparation of Fragrant Rapeseed Oil: Effect of Reducing Sugars on Flavor Production Using the Maillard Reaction. LWT. 2023, 189, 115497. DOI: 10.1016/j.lwt.2023.115497.
- Wang, H.; Yang, Y.; Chen, L.; Xu, A.; Wang, Y.; Xu, P.; Liu, Z. Identifying the Structures and Taste Characteristics of Two Novel Maillard Reaction Products in Tea. Food Chem. 2024, 431, 137125. DOI: 10.1016/j.foodchem.2023.137125.
- Fan, S.; Yang, G.; Zhang, J.; Li, J.; Bai, B. Optimization of Ultrasound-Assisted Extraction Using Response Surface Methodology for Simultaneous Quantitation of Six Flavonoids in Flos Sophorae Immaturus and Antioxidant Activity. Molecul. 2020, 25(8), 1767. DOI: 10.3390/molecules25081767.
- Gao, P.; Xia, W.; Li, X.; Liu, S. Optimization of the Maillard Reaction of Xylose with Cysteine for Modulating Aroma Compound Formation in Fermented Tilapia Fish Head Hydrolysate Using Response Surface Methodology. Food Chem. 2020, 331, 127353. DOI: 10.1016/j.foodchem.2020.127353.
- Rahman, E.; Momin, A.; Zhao, L.; Guo, X.; Xu, D.; Zhou, F.; Ji, B. B. Bioactive, Nutritional Composition, Heavy Metal and Pesticide Residue of Four Chinese Jujube Cultivars. Food Sci. Biotechnol. 2018, 27(2), 323–331. DOI: 10.1007/s10068-017-0256-2.
- Choi, S. H.; Ahn, J. B.; Kim, H. J.; Im, N.; Kozukue, N.; Levin, C. E.; Friedman, M. Changes in Free Amino Acid, Protein, and Flavonoid Content in Jujube (Ziziphus jujube) Fruit During Eight Stages of Growth and Antioxidative and Cancer Cell Inhibitory Effects by Extracts. J. Agric. Food. Chem. 2012, 60(41), 10245–10255. DOI: 10.1021/jf302848u.
- Liu, Y.; Liao, Y.; Guo, M.; Zhang, W.; Sang, Y.; Wang, H.; Cheng, S.; Chen, G. Comparative Elucidation of Bioactive and Volatile Components in Dry Mature Jujube Fruit (Ziziphus Jujuba Mill.) Subjected to Different Drying Methods. Food Chem. X 2022, 14, 100311. DOI: 10.1016/j.fochx.2022.100311.
- Song, Y.; Wang, F.; Zhang, R.; Vidyarthi, S. K.; Sun, X.; Pan, Z. Comparison of Volatile Compounds and Fatty Acids of Jujubes (Ziziphus Jujuba Mill.) Before and After Blackening Process. Int. J. Food. Prop. 2022, 25, 1079–1098. DOI: 10.1080/10942912.2022.2070641.
- Yuan, H.; Sun, L.; Chen, M.; Wang, J. The Simultaneous Analysis of Amadori and Heyns Compounds in Dried Fruits by High Performance Liquid Chromatography Tandem Mass Spectrometry. Food Anal. Methods 2017, 10, 1097–1105. DOI: 10.1007/s12161-016-0669-1.
- Golon, A.; Kuhnert, N. Characterisation of “Caramel-Type” Thermal Decomposition Products of Selected Monosaccharides Including Fructose, Mannose, Galactose, Arabinose and Ribose by Advanced Electrospray Ionization Mass Spectrometry Methods. Food Funct. 2013, 4(7), 1040–1050. DOI: 10.1039/c3fo30352g.
- Li, T. X.; Ji, L. B.; Jiang, Z. R.; Geng, Z. Z.; Shentu, H. Q.; Liu, M. C.; Xie, Y. F.; Hu, J.; Liu, Y. F.; Li, D. L. Caramel Products of Glucose with Water During Heating Process and Their Bioactivities. Int. J. Food. Prop. 2020, 23(1), 971–978. DOI: 10.1080/10942912.2020.1770788.
- Lin, J. T.; Liu, S. C.; Hu, C. C.; Shyu, Y. S.; Hsu, C. Y.; Yang, D. J. Effects of Roasting Temperature and Duration on Fatty Acid Composition, Phenolic Composition, Maillard Reaction Degree and Antioxidant Attribute of Almond (Prunus dulcis) Kernel. Food Chem. 2016, 190, 520–528. DOI: 10.1016/j.foodchem.2015.06.004.
- Wang, L.; Zhu, J.; Wang, Y.; Wang, X.; Chen, F.; Wang, X. W. Characterization of Aroma-Impact Compounds in Dry Jujubes (Ziziphus Jujube Mill.) by Aroma Extract Dilution Analysis (AEDA) and Gas Chromatography-Mass Spectrometer (GC-MS). Int. J. Food. Prop. 2018, 21(1), 1844–1853. DOI: 10.1080/10942912.2016.1273234.
- Yan, X.; Pan, S.; Liu, X.; Tan, M.; Zheng, X.; Du, W.; Wu, M.; Song, Y. Profiling the Major Aroma-Active Compounds of Microwave-Dried Jujube Slices Through Molecular Sensory Science Approaches. Foods 2023, 12(16), 3012. DOI: 10.3390/foods12163012.
- Li, T. X.; Shi, F. C.; Li, P. H.; Luo, C.; Li, D. L. A Roasting Method with Sugar Supplement to Make Better Use of Discarded Tobacco Leaves. Food Sci Tech-Brazil 2022, 42, e36521. DOI: 10.1590/fst.36521.
- Chen, K.; Yang, X.; Huang, Z.; Jia, S.; Zhang, Y.; Shi, J.; Hong, H.; Feng, L.; Luo, Y. Modification of Gelatin Hydrolysates from Grass Carp (Ctenopharyngodon idellus) Scales by Maillard Reaction: Antioxidant Activity and Volatile Compounds. Food Chem. 2019, 295, 569–578. DOI: 10.1016/j.foodchem.2019.05.156.
- Yu, X. Y.; Zhao, M. Y.; Liu, F.; Zeng, S. T.; Hu, J. Identification of 2,3-diHydro-3,5-diHydroxy-6-metHyl-4H-Pyran-4-One As a Strong Antioxidant in Glucose–Histidine Maillard Reaction Products. Food. Res. Int. 2013, 51(1), 397–403. DOI: 10.1016/j.foodres.2012.12.044.