
ABSTRACT
Wild edible fruits provide a valuable source of sustenance and economic benefit for indigenous communities, which being often overlooked and underexploited. In order to meet the growing need for alternative nutritional sources, we conducted a study to evaluate the nutritional composition of seven (7) wild edible fruits viz. pummelo (Citrus grandis), kuji-thekera (Garcinia kydia), Nepal berry (Mahonia nepaulensis), bayberry (Myrica esculenta), laurel cherry (Prunus undulata), wild jamun (Syzygium cumini), and tamarind (Tamarindus indica) of Mizoram, north-east India. The research demonstrates that Mahonia napaulensis contains significant amounts of anthocyanin (678 ± 28 mg 100 g−1), carotenoid (1.64 ± 0.01 mg 100 g−1), total sugars (21 ± 4%), non-reducing sugars (9 ± 2%), and TSS 16.07 ± 0.32 °B. Myrica esculenta exhibited high levels of vitamin E (23.8 ± 0.6 mg 100 g−1), carbohydrate (79.84 ± 3.74%), moisture (89 ± 1%), cellulose (67.4 ± 0.7 mg 100 g−1), and Mn (28 ± 1 mg 100 g−1). Tamarindus indica is rich in starch (10.68 ± 0.30 mg 100 g−1), protein (60 ± 1%), energy (490 ± 12 kcal), dry matter (41 ± 1%), crude fiber (20.8 ± 0.4%), lignin (13.69 ± 0.01%), hemicellulose (12.09 ± 0.01%), Ca (398 ± 82 mg 100 g−1), Cu (33 ± 6 mg 100 g−1) and Zn (11.4 ± 0.7 mg 100 g−1). The findings suggest that all fruits exhibit nutritional and anti-nutritional characteristics, making them very potential for use in nutraceutical and pharmaceutical sectors. The outcomes will provide a fundamental repository of the nutritional composition of these fruits and raise public consciousness about the significance of the fruit, promoting the conservation of the biodiversity.
Introduction
In several tropical nations, rural inhabitants have a longstanding practice of gathering a diverse assortment of leafy vegetables, roots, tubers, and fruits from the wild. This is mostly due to their appealing flavor, cultural significance, and usage as dietary supplements to alleviate food scarcity. Wild edible fruits, sometimes referred to as famine or hunger food, have been acknowledged for their ability to address both family food and economic security[Citation1] Most of the tribes of the world still depend on wild plants for their livelihood. Various wild fruits have been extensively used for ages across the Indian subcontinent due to their nutritional and therapeutic qualities. The incorporation of these compounds into dietary patterns serves as a means to enhance vital nutrients and introduce distinct bioactive molecules that may have significant implications for human well-being. The increasing global demand for natural medicines has led to their widespread recognition and appreciation in the market.[Citation2] Certain indigenous fruits have been shown to possess superior nutritional content compared to commercially grown fruits.[Citation3,Citation4] In recent years, there has been an increasing interest in assessing the nutritional characteristics of several wild edible plants.[Citation5] Introducing a diverse range of plant species, especially those that are currently overlooked, into our agricultural practices and diets can have significant positive impacts on nutrition, well-being, livelihoods, and the environment.[Citation6]
There is significant untapped potential in wild fruit that have not been fully utilized.[Citation7] The health benefits of wild fruits primarily arise from their rich content of natural antioxidants, such as phenolic compounds, ascorbic acid, tocopherol, carotenoids, and anthocyanins. Several factors, among others, can help reduce oxidative damage. To improve food security, nutrition, health, income generation, and environmental services, efforts are being made to address the issue of unrecognized hunger caused by deficiencies in essential micronutrients.[Citation8] Gaining knowledge about the nutritional composition, bioactive chemicals, and potential health implications of wild edible fruits is crucial for maximizing their nutritional advantages for human consumption.
A database of untamed food resources, together with ethno-botanical data on its adaptation and nutritional assessment is necessary to confirm that non-cultivated species may indeed serve as substitutes for domesticated or cultivated species. An examination of plants from different tropical forest regions using component analysis may result in the identification of important wild species. These species may then undergo crop improvement and hybridization processes to be developed into cultivated varieties.[Citation9] It is essential to acknowledge the significance of the wild edible fruits in various areas, including human nutrition, food security, health, and sources of revenue. It is important to recognize the significance of these fruits.[Citation10] Researching the vast array of untamed edible plants presents a promising avenue for discovering unique hues, tastes, and bioactive substances. Additionally, these plants have the potential to serve as valuable resources for nutritional supplements or functional foods.[Citation11]
In NE India, the inhabitants live in and around forest areas, and gather wild edible plants from community forests and some are also grown in kitchen gardens/homesteads.[Citation12] However, so far, there is negligible documented study on the nutritional aspects of these valuable wild edible fruits of the biodiversity hotspots of the world. Keeping all the above mentioned information in mind, the present study was undertaken for scientific validation of wild edible fruits of Mizoram, north-east India including its nutritional, anti-nutritional and phytochemical properties present therein.
Materials and methods
Sample collection
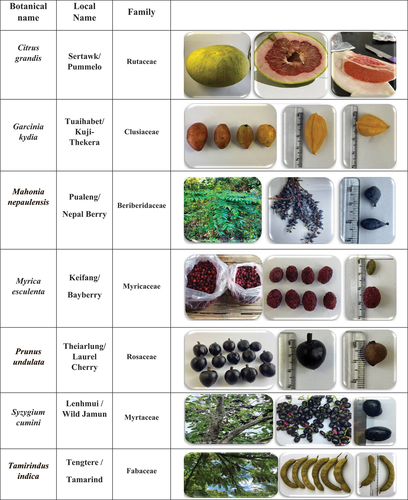
During 2021 - 2022, a varied selection of seven distinct wild edible fruits was gathered from six districts of Mizoram, north-east India namely Kolasib, Saitual, Aizawl, Khawzawl, Serchhip and Lunglei. The stated fruits includes pummelo (Citrus grandis (L.) Osbeck), kuji- thekera (Garcinia kydia Roxb), Nepal berry (Mahonia nepaulensis DC), bayberry (Myrica esculenta Buch.-Ham. ex D. Don), laurel cherry (Prunus undulata Buch.-Ham. ex D. Don), wild jamun (Syzygium cumini (L) Skeels), and tamarind (Tamarindus indica L) (). The necessary analytical reagents for the inquiry were acquired from Sigma-Aldrich, Hi-media, and Merck. The UV-vis spectrophotometer (Biotech Epoch 2 microplate reader) and atomic absorption spectrophotometer (Perkin Elmer Pinnaacle 900F) were used in this study.
Figure 1. Seven (7) wild edible fruits of Mizoram.
Sample preparation
Each of the seven listed wild edible fruits was first cleaned using aqueous ethanol and then rinsed with distilled water. Following washing, the fruits underwent air-drying. The specimen was subjected to desiccation in a controlled atmosphere using an oven, with the temperature between 50 and 60°C. The fruit was pulverized, resulting in the development of a finely pulverized powder. During the quantitative examination, the powdered compounds underwent a final sieving using a 20 µm mesh size. Subsequently, they were stored in securely sealed containers to avoid any external contamination. The samples were subjected to a rotary evaporator, (Buchi R-300) to get extracts.
Nutrient content and proximate analysis
The moisture, dry matter, ash, crude fiber, fat, lignin, and hemicellulose content in the fruits were measured following the established protocols outlined in the[Citation13] guidelines.
Sugar contents, TSS and acidity
The evaluation of sugars, including total sugars, reducing sugar, and non-reducing sugar, was performed using a UV-Vis spectrophotometer. The determination of the total sugars content was performed using anthrone reagent, as described by.[Citation14] 25 mg of powdered sample was dissolved in 10 ml of 80% ethanol. The resultant solution underwent centrifugation at 4000 rpm for 10 minutes. The supernatant was collected and modified to reach a total volume of 10 ml. An aliquot of 0.1 ml of the extract was added to a solution consisting of 4 ml of anthrone, The resultant combination was thereafter heated for 10 minutes in a water bath. After reaching room temperature, the absorbance (A) at 625 nm was measured using a UV-vis spectrophotometer. A reagent blank was used as the reference. The total sugars was quantified by using a standard curve of glucose, which was created using known concentrations of glucose (varying from 10 to 200 g/ml) in a solution of anthrone reagent.
The methodology proposed by[Citation14] was used to determine the reducing sugar concentration. It included macerating 100 mg sample with 5 ml of 80% ethanol at a higher temperature. The specimen was subjected to centrifugation at 3000 rpm for 5 minutes. Water was added to aid the breakdown of the sugars. An aliquot of 0.2 ml was obtained and then diluted with distilled water to get a final amount of 2 ml. 1 cc of alkaline copper tartrate was added to each tube. The tube was immersed in boiling water for 10 minutes. The tube was subjected to chilling, after which 1 ml of arsenomolybolic acid reagent was added to each tube. The solution’s final volume was adjusted to 10 ml by adding distilled water. The sample underwent incubation for a period of 10 minutes. The sample was assessed using a UV-visible spectrophotometer at 620 nm after 10-minute, compared to the blank solution. The reducing sugar in the sample was determined by measuring the slope of the glucose standard curve.
The TSS of the collected fruits was quantified using a digital refractometer that has a measurement range of 0–85 °Brix. The fruit’s titratable acidity was determined by titration of the fruit juice using 0.1 N NaOH solution. Phenolphthalein was used as an indicator to identify the end point, indicated by pale-pink hue. The titratable acidity was then measured as a percentage, relative to the quantity of citric acid.
Determination of pigments
The computation of carotenoid content was carried out using the methodology described by.[Citation15] We homogenized fresh 100 mg fruit tissues in 5 ml of 80% acetone utilizing a clean mortar and pestle. The liquid component was extracted after the mixture was subjected to centrifuge force at 5000 rpm for 5 minutes. The liquid that was collected has been utilized to determine the concentration of total carotenoids by assessing the absorbance at specific wavelengths using a UV-vis spectrophotometer.
The method outlined by[Citation16] was used to measure the amount of anthocyanin. The given sample (1 g) was mixed with 10 ml of ethanolic Hydrochloric acid (HCl) and then transferred to 100 ml volumetric flask to achieve the desired volume. The mixture was placed in a refrigerator at a temperature of 4°C overnight. Afterward, 0.2 ml of the mixture was taken out and then it was further diluted to 10 ml. The optical density (OD) was measured at 535 nm.
The cellulose content was assessed using the method suggested by.[Citation17] 1 g of sample was taken and three ml of a specific reagent was added to it, and the mixture was thoroughly mixed using a vortex mixer. The tubes were placed in a water bath and heated to a temperature of 100°C for 30 minutes. The contents were thoroughly examined and analyzed. The sample underwent centrifugation at a speed of 3000 rpm for 15 minutes. The pellet was gathered and underwent a thorough cleaning procedure using distilled water. The residue was treated with 10 ml of 67% sulfuric acid and left to stand for 1 hour. A volume of 1 ml of the diluted sample was mixed with distilled water to reach a final volume of 100 ml. One ml of the diluted sample was combined with 10 ml of anthrone reagent. The tubes were placed in a boiling water bath and left for 10 minutes. The sample underwent a cooling process and was then measured at a wavelength of 630 nm using a UV-vis spectrophotometer. A blank solution was used as the reference for comparison.
Determination of vitamins
The ascorbic acid was determined by using spectrophotometer.[Citation13] The fresh fruit samples were homogenized in a water bath with metaphosphoric acid, particularly a solution containing 5% metaphosphoric acid in 10% acetic acid solution. Subsequently, the resultant combination underwent filtration and was subjected to treatment with a solution containing 85% H2SO4 and 2, 4-dinitrophenyl-hydrazine. Afterward, the samples were placed in an incubator and exposed to 60°C for 60 minutes. The measurement was performed using a UV-vis spectrophotometer at a wavelength of 520 nm.
The methodology outlined by[Citation14] was used to ascertain the vitamin E concentration. 10 ml of 0.1N H2SO4 was added to of 0.5 g, of the given specimen, and the resultant solution was kept undisturbed for overnight. The material was filtered, and then, 1.5 ml of tissue extract, standard solution, and water were put into three separate test tubes using a pipette. Both the test and blank samples each were added 1.5 ml ethanol, while the standard sample received a 1.5 ml of water. Afterwards, the samples underwent centrifugation. Each tube was supplemented with 1.5 ml of xylene, and then subjected to stirring and centrifugation. Subsequently, 1 ml from the xylene layer was meticulously transferred into a distinct tube, and 1 ml of the 2,2-dipyridyl was added. 1.5 ml of the liquid sample was extracted using a pipette and then examined at 460 nm, comparing it to a blank solution. After 15-minutes, 0.33 ml of ferric chloride was added to each test tube labeled as the blank. Afterwards, the liquid that remained above the silt was quantified using a UV-vis spectrophotometer at 520 nm, with the blank solution used as the point of comparison.
Proximate composition
The total carbohydrate was estimated using Anthrone method, as described by.[Citation14] 100 mg sample was placed into a boiling tube and exposed to hydrolysis for three hours. The procedure was conducted using a water bath and included using a 5 ml amount of 2.5 N HCl. The material was chilled and then neutralized till the effervescence stopped. The volume was increased to 100 ml, then the contents were centrifuged and the supernatant was collected. An aliquot of one ml was extracted and then mixed with four ml of anthrone reagent. The sample was exposed to a boiling water bath for eight minutes, after which it was let to cool. The resultant color was measured at a wavelength of 630 nm using a UV-vis spectrophotometer, with a blank solution used as a reference.
The starch estimation technique was based on the methods provided by.[Citation14] 500 mg sample was homogenized in a solution of 80% hot ethanol to remove any sugars. Subsequently, the mixture was subjected to centrifugation, and the resultant solid residue was collected. The residue was subjected to several washes using a solution of 30% hot ethanol until the washings no longer showed any coloring when examined with the anthrone reagent. The remaining product underwent a drying procedure with a water bath. The remaining substance was dissolved in 5 ml of water, and then 6.5 ml of perchloric acid with a concentration of 52% was added. The resultant mixture was thereafter incubated at a temperature of 0°C for 20 minutes. The specimen was subjected to centrifugation at 3000 rpm for 5 minutes, leading to the acquisition of the supernatant. The extraction procedure was repeated using freshly made perchloric acid, and the resultant liquid above the sediment was merged to achieve a total volume of 100 ml with each succeeding extraction. 0.2 ml of the supernatant was removed using a pipette, and then the resultant amount was diluted to 1 ml with distilled water. Then, 4 ml of anthrone reagent was introduced into the solution. The material was then heated in a water bath at the temperature of boiling for 8 minutes, and then rapidly cooled. The intensity of the dark green color was quantified at a wavelength of 630 nm using a UV-vis spectrophotometer, with the blank solution used as the reference.
The protein quantity was evaluated employing the method outlined by.[Citation18] Test tubes were used to gather 0.1 ml and 0.2 ml of the sample extract. Ensuring that the volume in all the test tubes is precisely calibrated to 1 ml. The void is shown with a cylindrical vessel holding 1 ml of water. Add 5 ml of reagent C to every tube, including the control tube. Thoroughly blend the components and let the mixture rest for a length of 10 minutes. Subsequently, add 0.5 ml of reagent D to the mixture, making sure to mix it well. Then, incubate the solution at room temperature in a light-protected area for a period of 30 minutes. A hue in the shade of blue has been generated. Quantify the optical absorption specifically at a wavelength of 660 nm. The energy value assessment was performed using the conversion parameters specified in the Food and Agriculture Organization (FAO) publication.[Citation19]
Energy value (kcal/100 g) = (% available carbohydrate × 4) + (% protein × 4) + (% fat × 9)]
Qualitative determination of anti-nutrients
A preliminary analysis was conducted to detect the presence of alkaloids, saponins, phytic acid, oxalates, and tannins using standard protocols.[Citation13] The alkaloid analysis involved the addition of Mayer’s reagent, which consisted of 1.3 g of HgCl2 and 5 g of KI dissolved in 100 ml of distilled water, dropwise to a mixture containing 2 ml of concentrated HCl and 1 ml of the blended sample. The confirmation of the presence of alkaloids is shown by the production of a precipitate with a creamy appearance. The standard procedure employed for the qualitative analysis of saponins is combining 2 ml of an aqueous extract with 2 ml of distilled water in a graduated cylinder, followed by vigorous shaking for 15 minutes. The presence of saponins elicits a favorable reaction in the form of a 1 cm foam layer. In the examination of phytic acid, a volume of 5 ml from the sample was combined, allowed to undergo a curing process for 5 hours, and subsequently filtered. Aliquots of 2500 ml of filtrate were introduced into a conical flask containing 5 ml of ammonium thiocyanate solution at a concentration of 0.30%. The resulting mixture was subjected to titration using a standardized solution of iron (III) chloride until a consistent and lasting brownish yellow coloration was achieved, which persisted for 4 minutes. In order to isolate tannin, a quantity of 1 gm of the substance was subjected to boiling in 20 ml of distilled water, followed by filtration. A little quantity of ferric chloride solution with a concentration of 0.1% was introduced, and the subsequent appearance of a blue-black hue was seen. This color change serves as an indication of the existence of tannins.
Quantitative determination of anti-nutrients
The approach outlined by[Citation20] was used to ascertain the alkaloid content. The desiccated powder was soaked in a solution containing 80% ethanol. Afterwards, the solvent was evaporated at a temperature of 72°C to get a concentrated solution. After dissolving a 1 mg amount of fruit extract in dimethyl sulfoxide (DMSO), an additional 1 milliliter of 2 N hydrochloric acid (HCl) was added, and then the mixture was filtered. After transferring the solution into a separating funnel, 5 ml of bromocresol green and an equal amount of phosphate buffer were added. The mixture was vigorously stirred with chloroform before transferred into a 10 ml flask. It was then diluted to its final volume using chloroform. Several reference standard solutions were prepared, each containing different concentrations of atropine (20, 40, 60, 80, and 100 μg ml− 1). The absorbance was measured at 470 nm using a UV-visible spectrophotometer, with the reagent blank used as the reference.
The quantification of the saponins was performed using the method described by,[Citation21] with some modifications, which is based on the vanillin-sulfuric acid colorimetric reaction. 50 µl of fruit extract were mixed with 250 µl of distilled water. Following that, about 250 μl of vanillin was added, which included 800 mg of vanillin dissolved in 10 ml of 99.5% ethanol. Afterwards, 2.5 ml of 72% H2SO4 was added to the mixture, and then well mixed. The solution was placed in a water bath at 60°C for 10 minutes. After 10 minutes, the material underwent a cooling procedure in water with low temperature. The absorbance was measured at 544 nm. The results were measured and expressed as diosgenin equivalents (mg DE/g extract) by using a standard curve.
Phytic acid was determined by following the methodology described by.[Citation22] For this, 1 ml of supernatant produced from the 5% H2SO4 extraction was mixed with an equal volume of ferric (III) chloride solution. The obtained solution was then heated in a water bath at 100°C for 30 minutes. Afterwards, the solution was treated with ice-cold water for 15 minutes and then centrifuged at a speed of 4000 rpm for 30 minutes. 1 ml of supernatant was transferred into a cuvette, and then a little amount of 2,2’ bipyridine solution was added until a bright pink color appeared. The absorbance of the reaction mixture was instantly measured at 519 nm, with pure water used as a reference.
The oxalate estimation was performed using the titrimetric method outlined by.[Citation23] 2-gram dry sample was digested for 1 hour using 10 ml of 6 M HCl. Subsequently, the resultant mixture was allowed to cool. The solution was made by putting it into a 250 ml volumetric flask and thereafter undergoing filtration. 125 ml of the filtrate was meticulously placed into the beakers, and then 3 to 4 drops of methyl red were added. An NH4OH solution with a high concentration was gradually added to the test solution until the observed color changed from salmon pink to a light yellow. The pH of the resultant solution was subsequently determined. Each component was heated to a temperature of 90°C, then cooled, and then filtered to remove the precipitate. Again, the filtrate was heated to a temperature of 90°C. Afterwards, a 10 ml of 5% CaCl2 solution was added while continuously stirring. The solution was separated by decantation, and then the solid particles were completely dissolved in a 10 ml solution containing 20% (v/v) H2SO4. The filtrate was raised to 300 ml level, and 125 ml of the filtrate was heated until the boiling point. Afterwards, the filtrate was titrated using a standardized solution of 0.05 M KMnO4. At the end point, a long-lasting pink coloration appeared and remained for a period of 30 seconds.
The tannin was estimated using[Citation24] method. A 0.5 g sample was placed into a conical flask, and then 75 ml of water were added. The material was boiled for 30 minutes and then centrifuged at 2000 rpm for 20 minutes. The supernatant, was meticulously placed into a volumetric flask and then diluted with distilled water to get a volume of 100 ml. 1 ml of the sample extract was added to a volumetric flask containing 75 ml of water. Following the addition of 5 ml of Folin-Denis reagent and 10 ml of Na2CO3, the solution was further diluted with water to reach a final volume of 100 ml. After incubating for 30 minutes, the contents were analyzed using a UV-visible spectrophotometer at 700 nm, with the blank solution used as the reference.
Mineral nutrients contents
The minerals Ca, Co, Cu, Fe, Mg, Mn, Na, K, and Zn were determined using AAS in the produced sample solution. The N was estimated using the Kjeldhal apparatus, whereas the P was estimated using the spectrophotometric vanadium phosphomolybdate technique.
Data analysis
The SPSS window version 25.0 (IBM Corp., 2017) was used to analyze the data for variance (ANOVA) using the general linear model (GLM) approach. The values were represented as the average and the measure of dispersion known as the standard deviation. The treatment means were statistically differentiated using the Duncan Multiple Range Test at a significance threshold of 5% (p < .05).
Results and discussion
The results of our investigation indicated that the nutritional and anti-nutritional components of the tested fruits showed noteworthy differences.
Pigment, vitamins and proximate composition of wild edible fruits
displays the colors, vitamins, and proximate composition of seven wild edible fruits. Regarding pigment content, Mahonia napaulensis exhibited the highest concentration of anthocyanin pigment (678 ± 28 mg 100 g−1), followed by Prunus undulata (328 ± 8 mg 100 g−1) and Syzygium cumini (313 ± 6 mg 100 g−1). On the other hand, Garcinia kydia displayed the lowest concentration of anthocyanin pigment (218 ± 8 mg 100 g−1), which was statistically similar to Citrus grandis (227 ± 8 mg 100 g−1). The level of anthocyanin in fruits may vary according to several external and internal factors, such as genetic and agronomic characteristics, light intensity and quality, temperature, and other important aspects.[Citation25] The measured anthocyanin content in Syzygium cumini is consistent with the findings reported by.[Citation26]
Table 1. Pigments, Vitamins and proximate composition of the seven wild edible fruits.
The carotene pigment concentration was greatest in Mahonia napaulensis (1.64 ± 0.01 mg 100 g−1), followed by Myrica esculenta (1.43 ± 0.01 mg 100 g−1) and Garcinia kydia (0.39 ± 0.01 mg 100 g−1). The lowest level of carotene pigment was seen in Syzygium cumini (0.03 ± 0.01 mg 100 g−1). The carotenoid pigment found in Myrica esculenta was found to be consistent with the results of.[Citation27]
Vitamins are key organic substances that play a crucial role in basic bodily activities, including development, maintenance of health, and metabolism. Vitamins C and E function as antioxidants, counteracting the detrimental impact of free radicals and safeguarding against the development of illnesses.[Citation28] Among the three plants studied, Prunus undulata had the highest concentration of vitamin C (126 ± 42 mg 100 g−1). It was followed by Syzygium cumini (104 ± 6 mg 100 g−1) and Mahonia napaulensis (101 ± 7 mg 100 g−1). The vitamin C content of Syzygium cumini and Mahonia napaulensis were not significantly different from each other. The content of vitamin C in Myrica esculenta (61 ± 5 mg 100 g−1) was the lowest among all. This value was statistically similar to that of Garcinia kydia (61 ± 4 mg 100 g−1) and Tamarindus indica (65 ± 8 mg 100 g−1). The vitamin C recorded in Syzygium cumini was found to be comparable to the levels documented by.[Citation26] The differences in the levels of ascorbic acid across various fruit species might be due to various roles that ascorbate plays in plant cells and its regulation in tissues containing chlorophyll.[Citation29]
The highest concentration of vitamin E was observed in Myrica esculenta (23.3 ± 0.6 mg 100 g−1), followed by Garcinia kydia (23.2 ± 0.7 mg 100 g−1) and Syzygium cumini (23.2 ± 0.4 mg 100 g−1), which exhibited statistically similar levels. Prunus undulata (21.7 ± 0.6 mg 100 g−1) and Tamarindus indica (21.9 ± 0.7 mg 100 g−1) had lower quantities of vitamin E, while Citrus grandis recorded the lowest (21.4 ± 0.6 mg 100 g−1). These values were statistically similar. The vitamin E content in Myrica esculenta was found to be comparable to the results reported by.[Citation27]
The intrinsic acidity of a product has a dual role, serving as both a means of preserving the substance and guaranteeing its safety for ingestion. The acidity of fleshy fruits plays a crucial role in defining the sensory quality of the fruit. Microorganisms face more obstacles in terms of their survival and proliferation when they come into contact with extremely acidic meals that are typified by low pH values. This may be assessed by measuring titratable acidity and/or pH levels.[Citation30] The acidity of the analyzed fruits was found to be maximum in Citrus grandis (5.64 ± 0.45%), which was statistically comparable to Tamarindus indica (5.54 ± 0.98%) and Garcinia kydia (4.50 ± 0.60%). When comparing acidity levels, Syzygium cumini (0.74 ± 0.25%) and Myrica esculenta (1.38 ± 0.31%) had lower acidity levels, whereas Mahonia napaulensis (0.88 ± 0.21%) had the lowest acidity level. The acidity percentage recorded in Citrus grandis was found to be comparable to the results of.[Citation31] The genetic and environmental variables play a crucial role in regulating the build up of malic acid and citric acid, the main organic acids, in ripe fruits throughout the fruit development process.[Citation32]
Macronutrients are the vital sources of energy that include the required components present in food to support the body’s upkeep of its physiological systems and structures. Carbohydrates, proteins, and lipids are the main macronutrients included in food, and they are vital nutrients required in large amounts every day accounting for 90% of the overall bulk diet.[Citation33] Among the studied fruits, Garcinia kydia and Mahonia napaulensis had the highest fat percentage, measuring 6.23 ± 0.06% and 4.43 ± 0.06% respectively. Prunus undulata closely trailed after with a fat percentage of 2.32 ± 0.03%. In contrast, the Tamarindus indica (0.45 ± 0.05%) had the lowest fat. The fat content of Tamarindus indica is consistent with the results reported by [Citation34] [Citation35]) proposes that fruit species with high crude fats might be important sources of oil-soluble vitamins, which are essential for their antioxidant properties. The present study suggests that the fruit species being studied have a low fat content.
The ripening process in fruits is marked by a gradual decrease in starch and carbohydrate levels, subsequently leading to the accumulation of glucose, fructose, and sucrose. The occurrence of this phenomena may be ascribed to the diverse genetic compositions present within the species.[Citation36] The research found that Myrica esculenta (79.84 ± 3.74%) had the highest carbohydrate content, followed by Mahonia nepaulensis (71.68 ± 0.95%), Tamarindus indica (61.85 ± 3.46%) and Syzygium cumini (59.13 ± 1.31%). Garcinia kydia (43.04 ± 0.48%) and Citrus grandis (34.32 ± 0.90%) ahad lower amounts of carbohydrate, while Prunus undulata (20.67 ± 0.06%) recorded lowest carbohydrate. The carbohydrate content measured in Tamarindus indica was statistically consistent with the results of.[Citation37] Tamarindus indica had the greatest starch content at 10.68 ± 0.30 mg 100 g−1, followed by Mahonia nepaulensis at 9.88 ± 0.14 mg 100 g−1 and Citrus grandis at 9.62 ± 0.51 mg 100 g−1. On the other hand, Myrica esculenta (7.62 ± 0.02 mg 100 g−1) had the lowest starch content, which was statistically similar to that of Prunus undulata (8.00 ± 0.02 mg 100 g−1).
Proteins are crucial macronutrients that act as essential building blocks for many biological tissues. The deficiency of proteins leads to several health issues, especially among the younger population, including increased susceptibility to infections, and decreased physical development.[Citation38] Fruits with high protein content are considered attractive nutritional choices for persons following a vegetarian lifestyle. The research found that Tamarindus indica (60 ± 1%) had the highest protein content, followed by Myrica esculenta (25.0 ± 0.4%) and Mahonia nepaulensis (25.0 ± 0.3%). The quantity of Garcinia kydia (7.2 ± 1.0%) was the lowest, and it was statistically similar to the amount of Citrus grandis (8.3 ± 0.1%). The protein content derived from Garcinia kydia is within the same range as reported by.[Citation39]
The utilization of energy is exclusively sourced from the metabolism of carbohydrates, proteins, and fats. Many anatomical structures of the human body, such as muscles, brain, heart, and liver, need energy to perform their respective physiological processes. Among the studied fruits, Tamarindus indica had the highest energy value of 490 ± 12 kcal, followed by Myrica esculenta (434 ± 13 kcal), which was statistically similar to Mahonia napaulensis (426 ± 2 kcal). The lowest energy level was found in Prunus undulata (171 ± 3 kcal), which was statistically similar to Citrus grandis (179 ± 4 kcal). The higher energy level of the fruit may be explained by its increased fat content, since lipids have the greatest caloric density per unit mass.[Citation40]
Nutrients composition, sugars, TSS, and correlations
The moisture content of the fruit is a critical determinant in assessing its overall quality. Fruit that contains a significant amount of moisture has a reduced amount of solid material, known as dry matter. Assessing the moisture content is considered a vital analysis since moisture has a substantial impact on the physical properties and shelf life of the fruit.[Citation41] The analysis revealed that Myrica esculenta (89.00 ± 1.00%) had the greatest moisture content (). It was closely followed by Citrus grandis (88.64 ± 0.88%) and Garcinia kydia (84.02 ± 1.02%). Mahonia napaulensis (65.17 ± 0.76%) and Prunus undulata (74.78 ± 4.33%) exhibited lower moisture content values. However, Tamarindus indica (59.40 ± 1.12%) had the lowest moisture content. The heightened moisture content seen in Myrica and Citrus fruits may be due to the substantial amount of liquid contained inside these fruits. This behavior is expected since Myrica and Citrus fruits are well-known for their high juice content and are primarily eaten for their taste satisfaction. The moisture content of Myrica esculenta is within the range specified by.[Citation4]
Table 2. Nutrient composition of the seven wild edible fruits.
The dry matter exhibited a negative connection with the moisture content, with the greatest values seen in Tamarindus indica (40.60 ± 1.12%), Mahonia napaulensis (34.83 ± 0.76%), and Prunus undulata (25.22 ± 4.33%) (). On the other hand, Myrica esculenta had the lowest dry matter content, (11.00 ± 1.00%). The flesh of fruits consists of all biochemical constituents except water in its dry matter makeup. Dry matter content refers to the proportion of dry material in relation to the total fresh mass. Therefore, Myrica fruits with a substantial moisture content exhibit the least quantity of dry matter.
The ash content of fruits refers to the inorganic residue that remains after the sample has been completely burned. From consumer’s perspective, it also signifies the mineral nutritional content of a fruit. The study revealed that Citrus grandis had the highest ash content of 9.21 ± 0.06%. Prunus undulata followed closely with an ash content of 6.87 ± 0.07%, while Tamarindus indica had a comparatively lower value of 3.24 ± 0.07% (). Nevertheless, Garcinia kydia exhibited the lowest ash content levels, (2.37 ± 0.09%), along with Myrica esculenta, (2.75 ± 0.08%). The presence of ash in fruits may significantly affect several physico-chemical and nutritional properties. The ash content in Tamarindus indica falls within the range reported by.[Citation37] On the other hand, the ash content of Citrus grandis was slightly higher than the reports of[Citation28]). The observed differences in fruit ash levels can be attributed to factors such as variations in environmental conditions, light exposure, and water availability.
Crude fiber is known for its beneficial effects on digestion and promoting regular bowel movements. Among the studied fruits, Tamarindus indica had the highest levels of crude fiber (20.78 ± 0.40%), followed by Syzygium cumini (17.18 ± 0.42%) and Prunus undulata (12.20 ± 2.24%), while the lowest was recorded in Citrus grandis (3.61 ± 0.08%), Myrica esculenta (4.72 ± 0.44%), and Garcinia kydia (5.47 ± 1.22%), which showed no significant difference (). The fiber composition of fruits may vary depending on the specific fruit variety and its level of maturity.[Citation42] In our present investigation, the fiber content in Tamarind is comparable to the results reported by.[Citation34]
Lignins have diverse array of advantageous characteristics, such as antioxidant, antibacterial, antiviral, anticancer, antidiabetic, and anticoagulant effects.[Citation43] Lignins has the capacity to be used in the treatment of obesity and the mitigation of blood cholesterol levels. The lignin content of plant-based foods often increases as they mature or develop for a longer period of time. In our present investigation, among the studied fruits, Tamarindus indica had the highest amounts of lignin (13.69 ± 0.01%), followed by Syzygium cumini (12.66 ± 0.01%) and Garcinia kydia (4.91 ± 0.01%). Myrica esculenta and Citrus grandis had the lowest amounts of lignin, measuring 2.76 ± 0.01% and 2.84 ± 0.01% respectively (). These values were statistically similar. The lignin content detected in Citrus grandis is consistent with the results reported by.[Citation31]
Cellulose and hemicellulose play a vital role in providing strength and rigidity to the cell wall of plants.[Citation44] This study found that Myrica esculenta had the highest cellulose content (67.39 ± 0.65 mg 100 g−1), followed by Garcinia kydia (58.59 ± 2.50 mg 100 g−1) and Prunus undulata (51.30 ± 3.70 mg 100 g−1). On the other hand, Mahonia nepaulensis had the lowest cellulose content (37.72 ± 0.54 mg 100 g−1), which was statistically similar to Citrus grandis (42.72 ± 1.63 mg 100 g−1) and Syzygium cumini (44.24 ± 0.11 mg 100 g−1) (). The cellulose content of Prunus undulata is comparable to other species within the genus Prunus as reported by Angami et al.. (2023). The Tamarindus indica has the highest hemicellulose concentration (12.09 ± 0.01%), followed by Mahonia nepaulensis (6.40 ± 0.01%). In contrast, Citrus grandis had the lowest hemicellulose concentration, measuring 1.98 ± 0.01%. The scope of gathered data may differ based on the level of development and the analysis technique used.
Sugars serve several biological functions, including daily caloric intake and acting as a mechanism for energy storage inside an organism. The sugar concentration in various types of fruits may be ascribed to the process of starch hydrolysis, resulting in the production of sucrose as fruits mature and ripen.[Citation45] Furthermore, the plant-specific amylase enzyme has significant efficacy in breaking down carbohydrates, resulting in the synthesis of polysaccharides and hydrolysis processes throughout the maturation stage. Thus, this enzymatic mechanism has a role in increasing the sweetness of fruits.[Citation46] In our present investigation, the highest total sugars was found in Mahonia nepaulensis (20.56 ± 4.19%), Syzygium cumini (19.31 ± 2.79%), and Myrica esculenta (17.59 ± 2.31%), but all of them were statistically comparable. Subsequently, Prunus undulata (3.28 ± 0.16%) and Garcinia kydia (3.72 ± 0.28%) had somewhat lower total sugars, although Citrus grandis (2.72 ± 0.02%) had the lowest total sugars, but these three were statistically equivalent (). In our study, the overall total sugars aligns with the results reported by.[Citation26] The recorded data shows that Syzygium cumini (12.02 ± 2.15%), Mahonia napaulensis (11.59 ± 1.67%), and Myrica esculenta (10.55 ± 30.56%) have the highest concentration of reducing sugars. These values are statistically similar. On the other hand, Prunus undulata (2.86 ± 0.08%) has a moderately lower reducing sugars, along with Garcinia kydia (3.18 ± 0.15%), which is statistically similar to Citrus grandis (2.11 ± 0.11%). The findings obtained for Prunus undulata are comparable to[Citation27] for Prunus. Non-reducing sugars consist of the disaccharide sucrose and tetrasaccharides. Our study’s results revealed that Mahonia napaulensis (8.52 ± 2.40%) had the highest non-reducing sugars, followed by Syzygium cumini (6.93 ± 0.60%) and Myrica esculenta (6.69 ± 1.67%). Prunus undulata (0.40 ± 0.08%) had a lower non-reducing sugars, whereas Citrus grandis (0.58 ± 0.12%) had the lowest. The non-reducing sugar content found in Syzygium cumini is comparable to the reports of.[Citation26]
Total soluble solids (TSS) refer to a variety of substances present in fruits, including sugars, organic acids, and a small amount of vitamins, proteins, and minerals. The TSS is a crucial determinant of consumer preferences in fruit product selection, as it serves as an indicator of the fruit’s level of sweetness. The present research found that Mahonia napaulensis had TSS content of 16.07 ± 0.32 °B, while Syzygium cumini had TSS level of 14.38 ± 2.15 °B. However, Prunus undulata (10.77 ± 0.25 °B) and Garcinia kydia (10.60 ± 0.36°B), which were statistically similar, had lower contents content (). In contrast, Citrus grandis (7.10 ± 0.26 °B) exhibited the lowest TSS. The TSS content recorded in Syzygium cumini is comparable to the reports of.[Citation26] The higher TSS in the fruits may be ascribed to their production in an environment characterized by restricted water availability and inadequate care and management. These circumstances facilitate the build up of dry matter, resulting in an increased TSS content.[Citation47]
The construction of correlations among the elements discovered in the inquiry was achieved by analyzing linear regression correlations. The correlation coefficients that corresponded to the given data are shown in . The presence of anthocyanin showed a strong positive relationship with total carotenoid (r = 0.70), total sugar (r = 0.64) and TSS (r = 0.68). A strong positive connection was observed between total carotenoid and anthocyanin (r = 0.70), carbohydrate (r = 0.67), energy (r = 0.50), and total sugars (r = 0.62). The research revealed a significant negative correlation (r = −0.56) between vitamin E and starch, indicating that as the levels of vitamin E increase, the levels of starch decrease. A negative link was detected between fat and protein, with a correlation coefficient (r = −0.47). A direct relationship was seen between carbohydrate levels and the concentrations of total carotenoid (r = 0.67), energy (r = 0.89), total sugars (r = 0.77) and TSS (r = 0.65). A direct negative relationship was seen between starch vitamin E (r = −0.56). A negative association was observed between protein and fat (r = −0.47), whereas a positive correlation was found with starch energy (r = 0.77) and TSS (r = 0.46). The correlation coefficients (r) between energy and total carotenoid, carbohydrate, protein, total sugar and TSS were 0.60, 0.50, 0.89, 0.77, 0.54 and 0.71 respectively. These positive values suggest a direct link between energy and these variables. The amount of sugars showed positive associations with anthocyanin (r = 0.64), total carotenoid (r = 0.62), carbohydrate (r = 0.77), energy (r = 0.54) and TSS (r = 0.68). A positive correlation was seen between TSS and anthocyanin (r = 0.68), carbohydrate (r = 0.65), protein (r = 0.46), energy (r = 0.71) and total sugars (r = 0.68).
Table 3. Correlation among the nutritional composition of the seven wild edible fruits.
Anti-nutrient composition wild edible
Anti-nutrients are natural compounds found in plants that have traditionally been considered harmful to human health because they might hinder the absorption and utilization of essential nutrients.[Citation48] Recently, there has been a growing acknowledgment of the beneficial impacts and therapeutic possibilities of anti-nutrients in the management of various illnesses.[Citation49] Plants create anti-nutrients, such as oxalates, tannins, saponins, phytate and alkaloids, as a means of protecting themselves from their surroundings. In the present investigation, among all the studied fruits, Myrica esculenta had the greatest alkaloid concentration of 153.47 ± 3.53 mg 100 g−1, which is statistically equivalent to the alkaloid content of Mahonia napaulensis (150.81 ± 1.19 mg 100 g−1) (). Garcinia kydia (143.26 ± 3.75 mg 100 g−1) followed it. On the other hand, Prunus undulata (123.94 ± 5.57 mg 100 g−1),and Tamarindus indica (124.03 ± 5.47 mg 100 g−1) had lower levels of alkaloids, while Citrus grandis had the lowest(122.11 ± 2.39 mg 100 g−1). The alkaloid content measured in Myrica esculenta is consistent with the values reported by.[Citation27] The biosynthesis route of fruit species is regulated by many enzymes at different phases of plant growth and development, hence influencing the concentration of alkaloids.[Citation50]
Table 4. Anti-nutrient composition of the seven wild edible fruits.
Saponins are a very prevalent and diverse group of plant chemicals. They serve several ecological roles, including enhancing plant resistance against diseases and herbivores, and perhaps functioning as allelopathic agents in competitive plant interactions.[Citation51] It is revealed from the data presented in that among the studied fruits, Tamarindus indica had the highest saponin content (911.93 ± 1.08 mg 100 g−1), followed by Syzygium cumini (10.24 ± 0.55 mg 100 g−1) which is statistically similar with Mahonia napaulensis (10.23 ± 1.16 mg 100 g−1). In contrast, Prunus undulata had the lowest saponin content of 5.58 ± 0.65 mg 100 g−1().
The concentration of phytic acid, mainly in the form of phytate, was found to be highest in Mahonia napaulensis (4.49 ± 0.09 mg 100 g−1), followed by Tamarindus indica (4.06 ± 0.05 mg 100 g−1), and Myrica esculenta (3.67 ± 0.13 mg 100 g−1) (). The elevated content of phytic acid in these species may be ascribed to its chemical makeup, which is created and stored over the course of growth and fruit ripening.[Citation52] The Syzygium cumini had the lowest phytate (3.26 ± 0.12 mg 100 g−1). Myrica esculenta had a phytic acid level that was consistent with the findings reported by.[Citation27]
Some plant species synthesize oxalate as a defensive reaction to herbivory or tissue injury.[Citation53] Among the studied fruits, Garcinia kydia (13.42 ± 1.10 mg 100 g−1) had the maximum oxalate, followed by Syzygium cumini (7.92 ± 1.32 mg 100 g−1), which was statistically similar to Myrica esculenta (6.60 ± 2.20 mg 100 g−1) (). On the other hand, Citrus grandis (2.64 ± 0.44 mg 100 g−1) had the least amount of oxalate. Consuming a large amount of oxalate in one’s diet may greatly increase the amount of oxalate excreted in urine, even in persons who do not have any issues with oxalate metabolism.[Citation54]
The perception of astringency, which may be ascribed to the existence of tannins, is regulated by several structural and regulatory genes. The data presented in reveals that Myrica esculenta (138.44 ± 1.02 mg 100 g−1) had the highest tannin content. This was followed by Mahonia nepaulensis (114.44 ± 3.42 mg 100 g−1) and Syzygium cumini (111.56 ± 5.43 mg 100 g−1). The lowest value was recorded in Garcinia kydia (46.44 ± 0.39 mg 100 g−1). Various studies have shown that the accumulation of tannins is affected by both the inherent genetic factors of the species and external environmental factors such as temperature, light, moisture, and other environmental factors.[Citation53]
Mineral composition of wild edible underutilised fruits
Fruits provide a significant advantage by supplying minerals, which are essential for supporting proper biological functions in our bodies. Minerals are often classified into two main classes, micro and macro-minerals, based on these recommended daily intake rather than their relative importance or physiological functions.[Citation55] Macro minerals, such as Ca, P, Mg, S, Na, and K are often needed in daily amounts above 100 mg. On the other hand, micro minerals are necessary in daily amounts less than 100 mg and include vital elements like Fe, Zn, I, Se, Mn, Cr, Cu, Mo, F, B, Co, Si, Al, Ar, Sn, Li, and Ni.[Citation55] These minerals are crucial for maintaining a well-rounded diet, making them an important factor in evaluating the nutritional value of fruits. N and P are crucial constituents of DNA and RNA, which play a vital role in the storage and transfer of genetic information. Moreover, both N and P play a crucial role in the synthesis of adenosine triphosphate (ATP), which acts as the principal energy source in cells. The process of phosphorylation is considered essential for the modification of many proteins and carbohydrates.[Citation56] Our present research findings indicated that Citrus grandis had the highest N content of 12.14 ± 0.49%, followed by Myrica esculenta (6.85 ± 0.19%) and Prunus undulata (5.91 ± 0.28%) (). Garcinia kydia had N level of 3.70 ± 0.32%, whereas Tamarindus indica had a slightly lower N value of 3.38 ± 0.20%. Mahonia napaulensis had the lowest N content, of 2.68 ± 0.31%. The diversity in N composition across various fruits may be ascribed to the quantities of N present in the soil environment. The detected N content in Prunus undulata is consistent with the range reported on the same genus by.[Citation57] The data showed that Citrus grandis (0.46 ± 0.04%) had the highest phosphorus level, followed by Mahonia napaulensis (0.33 ± 0.02%) and Prunus undulata (0.17 ± 0.01%). In contrast, Myrica esculenta (0.10 ± 0.01%) had the lowest levels of phosphorus. In our present investigation, the P level measured in Myrica esculenta corresponds to the findings of.[Citation58]
Table 5. Mineral composition of seven wild edible fruits.
K is a vital element necessary for the efficient operation of cellular, tissue, and organ systems in the human body. To maintain proper electrolyte balance, there is a constant exchange of water, Na, and K between the intracellular and extracellular fluid compartments.[Citation59] The findings demonstrated that Prunus undulata had the highest K content of 3.93 ± 0.05%, followed by Citrus grandis (2.56 ± 0.03%) and Garcinia kydia (2.21 ± 0.05%). The levels of K in Myrica esculenta (1.61 ± 0.03%) and Mahonia esculenta (2.12 ± 0.02%) were rather low (). Furthermore, Syzygium cumini exhibited the lowest K concentration, with a value of 1.28 ± 0.03%. In our present investigation, the quantity of K detected in Garcinia kydia is consistent with the findings reported by.[Citation58]
Ca is a vital macronutrient that has a pivotal effect in the neuromuscular function and the process of mineralization in the skeletal system.[Citation60] In our study, the maximum Ca was observed in Tamarindus indica (397.70 ± 82.47 mg 100 g−1), followed by Citrus grandis (188.05 ± 3.39 mg 100 g−1) and Mahonia napaulensis (93.65 ± 3.77 mg 100 g−1). On the other hand, Syzygium cumini contained the least amount of Ca (31.05 ± 4.76 mg 100 g−1) (). The concentration of Ca in Citrus grandis is similar to the results reported by.[Citation28] Mg plays a crucial part in a wide variety of biochemical and physiological processes and is essential for production of adenosine triphosphate (ATP), oxidative phosphorylation, and glycolysis.[Citation61] The data presented in revealed that the highest r Mg was observed in Prunus undulata (377.33 ± 6.45 mg 100 g−1), followed by Mahonia nepaulensis (353.33 ± 3.40 mg 100 g−1) and Myrica esculenta (311.55 ± 7.27 mg 100 g−1). The lowest Ca was observed in Garcinia kydia, (109.33 ± 3.51 mg 100 g−1). Mg has a crucial role in promoting the active transport of Ca and K ions across cell membranes thus function as an important vital element for the availability of these minerals.[Citation62] Na is widely acknowledged as a vital function in aiding the uptake of essential macronutrients such amino acids, water, and carbohydrates.[Citation62] The fruit Syzygium cumini had the greatest content of Na (77.48 ± 2.55 mg 100 g−1), followed by Prunus undulata (57.15 ± 2.08 mg 100 g−1) and Myrica esculenta (48.13 ± 2.75 mg 100 g−1). In contrast, the Garcinia kydia had the lowest Na (30.06 ± 0.33 mg 100 g−1). Our results obtained for Syzygium cumini exhibited values within the range reported by.[Citation63]
The human body needs micronutrients like Co, Cu, Fe, Mn and Zn)in lower amounts, although they are crucial for sustaining good physical well-being. The data presented in displays that Garcinia kydia had the most elevated levels of Co (3.95 ± 0.10 mg 100 g−1) and Fe (43.09 ± 1.56 mg 100 g−1), whereas Citrus grandis (0.03 ± 0.02 mg 100 g−1) and Myrica esculenta (1.09 ± 0.01 mg 100 g−1) showed the lowest Co and Fe, respectively. In our study, the Fe levels in Myrica esculenta are marginally elevated as compared to the results of Bhatt et al.. (2023). Tamarindus indica had the highest levels of Cu (32.94 ± 5.62 mg 100 g−1) and Zn (11.43 ± 0.71 mg 100 g−1), while Citrus grandis (2.95 ± 0.25 mg 100 g−1) and Myrica esculenta (1.09 ± 0.01 mg 100 g−1) had the lowest amounts. The Myrica esculenta had highest Mn content (27.66 ± 1.04 mg 100 g−1). It was followed by Garcinia kydia (11.30 ± 0.12 mg 100 g−1), and Mahonia napaulensis (9.48 ± 0.20 mg 100 g−1). In contrast, Citrus grandis had the lowest concentration of Mn (0.50 ± 0.01 mg 100 g−1). The variations in mineral levels among the studied wild edible fruits may be impacted by soil conditions, light exposure, and moisture availability, and the environment in which they are acclimated.
The correlation coefficients among the macro and micro nutrients are shown in . The analysis reveals a substantial positive connection (r = 0.55) between the variables N and P, while also indicating a negative correlation with Zn (r = −0.65). The variable P has a strong positive association with N, as shown by a correlation coefficient of 0.55. Ca has a strong positive correlation with the variables Cu (r = 0.90) and Zn (r = 0.71). Similarly, there were notable inverse correlations observed between Mg and Co (r = −0.43). The variable Na showed a strong negative connection with Co (r = −0.43). Co has negative associations with Mg (r = −0.43), Na (r = −0.77), and Fe (r = −0.77). Cu has strong positive relationships with Ca (r = 0.90) and Co (r = 0.95). T Fe has a strong positive association with Co (r = −0.77) and a strong negative correlation with Na (r = −0.77). Zn showed significant positive associations with Ca (r = 0.71) and Cu (r = 0.89), as well as a robust negative link with nitrogen (N) (r = −0.65).
Table 6. Correlation among the mineral composition of seven wild edible fruits.
Principal component analysis (PCA)
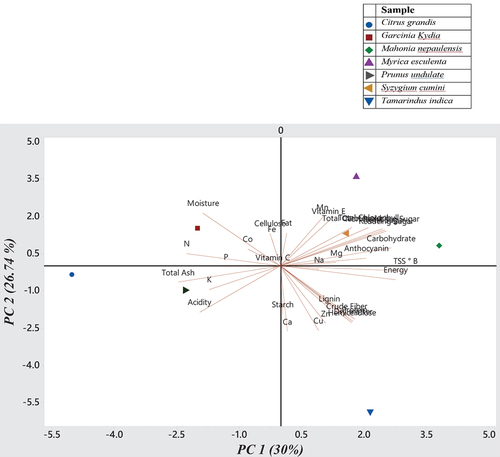
To evaluate the relationships between nutritional components and the studied fruits, PCA was conducted using the physical and chemical characteristics of the fruits and are presented in . In the PCA of 33 variables, six principal components (with eigenvalues greater than 1.0) were identified. These components explained 100% of the observed variance among the seven wild edible fruits. The other principal components had eigenvalues less than 0.5 and were not analyzed further. The first principal component (PC1) accounted for 30.01% of the overall variance. PC1 mostly exhibited the attributes of non-reducing sugars (0.98), total sugars (0.97), reducing sugar (0.95), carbohydrate (0.86), TSS (0.77), total carotenoid (0.76), and anthocyanin (0.74). Principal Component 2 (PC2) accounted for 26.74% of the observed variance and was mostly characterized by fruit attributes, such as hemicellulose (0.98), Cu (0.96), Zn (0.95), dry matter (0.82), and Ca (0.82). Fe with a representation of 0.95, fat (0.94) and Co (0.91) were the biggest contributors to PC3, accounting for 16.18%. The components PC4 included cellulose (0.86) and Mn (0.83), which together accounted for 11.54% of the overall variance. Principal Component 5 (PC5) accounted for 9.13% of the variance, as shown by the values of P (0.86) and starch (0.75). The composition of PC6 included 0.90% Mg and 0.73% K, making up a total of 6.41%. To summarize, PCA revealed significant variability in the physicochemical features of the seven wild edible fruits, emphasizing the notable variations found.[Citation38] in their study identified five major components derived by analyzing different nutritional features of the fruits that together accounted for 100% of the overall variance.
Table 7. Principal components (PC) and component loadings extracted from different parameters analyzed from seven fruits.
The bi-plot in illustrates the relationship between PC1 and PC2, showcasing all the parameters studied in seven fruit samples. The loading plot depicts the impact of components and their correlation, namely the closeness of angles. The text provides a concise overview of the parallels and differences among the samples, as well as the nutritional attributes that were examined. Additionally, it showcases the positioning of seven wild edible fruits and the dispersion of desirable characteristics across a specific area based on the first and second PCA dimensions, as seen in . Mahonia napaulensis, Myrica esculenta, and Syzygium cumini are located in the positive quadrant of both PC1 and PC2, suggesting that they contain a significant abundance of the nutrients represented in both quadrants. The quadrant analysis reveals that Tamarindus indica exhibits high levels of energy, crude fiber, lignin, starch, hemicellulose, dry matter Ca, and Cu. Citrus grandis and Prunus undulata are located in the negative quadrant of PC1 and PC2, indicating a negative correlation between the characteristics found in this region.[380] also reported similar biplot analysis results of PC1 and PC2 to segregate chosen fruits based on their features.
Figure 2. Principal Component Analysis (PCA) Bi-plot (score and loading plot) of all the parameters of seven fruit samples.
Multi-dimensional scaling and clustering of wild edible fruits
displays the cluster mean for several nutritional parameters using the Wards technique. Cluster I had the highest average values for moisture (81.18%), total ash (5.07%), N(6.82%), K (2.50%), and Co (1.02 mg 100 g−1). Cluster-II had the highest average values for vitamin E (22.62 mg 100 g−1), acidity (3.46%), protein (42.35%), energy (462 kcal), crude fiber (12.75%), lignin (8.23%), cellulose (mg 100 g−1), hemicellulose (8.47%), Ca (238.82 mg 100 g−1), Na (46 mg 100 g−1), Cu (17.01 mg 100 g−1), Mn (14.52 mg 100 g−1), Zn (7.44 mg 100 g−1), vitamin A (39.84 mg 100 g−1), vitamin B1 (0.05 mg 100 g−1), vitamin E (26.87 mg 100 g−1), crude fat (3.98%), and energy (69.25 kcal 100 g−1). Among the 7 wild edible fruits being studied, Mahonia napaulensis stands out as the only one that falls into a distinct major cluster III, based on its nutritional makeup. Mahonia nepaulensis exhibited the highest average values for anthocyanin (678.33 mg 100 g−1), total carotenoid (1.64 mg 100 g−1), vitamin C (100.93 mg 100 g−1), fat (4.43%), carbohydrate (71.68%), starch (9.88mg 100 g−1), dry matter (34.83%), total sugars (20.56%), reducing sugar (11.59%), non-reducing sugar (5.82%), TSS (16.07 °Brix), Mg (353.33 mg 100 g−1), and the lowest average values for acidity (0.81%), moisture (65.17%), ash (2.97%), lignin (3.21%), cellulose (37.72 mg 100 g−1), N (2.68%), and Na (34.69 mg 100 g−1).
Table 8. Cluster mean of nutritional compositions as per Wards method.
displays the cluster mean of several anti-nutritional aspects using the Wards approach. Cluster I had the highest concentration of saponin (11.93 mg 100 g−1) and phytic acid (16.23 mg 100 g−1). The total oxalate in cluster-II were the highest, with a value of 13.42 mg 100 g−1. Cluster-III had the greatest alkaloid (153.47 mg 100 g−1) and tannin (138.44 mg 100 g−1). By using cluster analysis to categorize fruit species, one may get a comparative understanding of the nutritional and anti-nutritional traits among different fruits. The clustering pattern in the present research is not applicable for hybridization due to variations in the genus and species of the studied fruit. The clustering patterns indicated that fruit species taken from the same geographical region or family did not always fall into the same cluster, which may be attributed to genetic variables.[Citation64] The wild edible fruit species examined in this research are extensively found in the tropical, subtropical, and temperate regions of the Indian subcontinent, as well as in various countries in East Asia, Southeast Asia, and Europe. This suggests that they possess the ability to thrive in diverse environmental conditions.[Citation4] A significant number of these natural resources have become limited due to excessive exploitation in their original environment and a lack of understanding about their nutritional significance. In order to secure the long-term use and conservation of wild edible fruits, it is crucial to have comprehensive awareness of the nutritional makeup and possible therapeutic properties of both known and unknown species.
Table 9. Cluster mean of anti-nutritional compositions as per Wards method.
Conclusion
An in-depth examination of the nutritional make-up of wild edible fruit species conducted in Mizoram, north-east India has revealed that all of these species serve as a significant and advantageous reservoir of vital nutrients, such as minerals, pigments, vitamins, sugars, carbohydrates, fat, protein, energy, and other essential components. These fruits may be regarded as healthy alternatives to the conventional diet. Mahonia napaulensis, due to its intense coloring, includes substantial levels of anthocyanin, total carotenoid, total sugars, non-reducing sugars, and TSS, while exhibiting a relatively low concentration of total oxalate. This attribute makes it a valuable reservoir of these substances. Myrica esculenta fruits are rich in vitamin E, carbohydrates, moisture, cellulose, and Mn. Tamarindus indica is abundant in carbohydrate, protein, energy, dry matter, and has relatively lower levels of alkaloid and total oxalate. The Citrus grandis has elevated levels of acidity, total ash, N, and P, while displaying low levels of alkaloid, saponin, total oxalate, and tannin. Garcinia kydia has elevated levels of fat and Co, while displaying decreased levels of saponin and tannin. Syzygium cumini exhibited a high concentration of reducing sugar and Na, while demonstrating a reduced quantity of phytic acid. Prunus undulata is rich in K and Mg, but has lower levels of alkaloids, saponins, and phytic acid. Myrica esculenta exhibited a substantial presence of anti-nutritional components, namely alkaloids and total oxalate. On the other hand, Tamarindus indica, Mahonia nepaulensis, and Garcinia kydia showed large levels of saponins, phytic acid, and tannins, respectively. Gaining comprehensive knowledge on the health-promoting properties of these wild edible fruits may lead to a better understanding of their benefits, including their use in functional foods, nutraceuticals, and pharmaceuticals. These native fruit species show great potential in guaranteeing food and nutritional security during times of food scarcity, furthermore, by the processing of these fruits, their utilization may be improved by minimizing waste, guaranteeing year-round availability, and generating more favorable selling opportunities through the manufacturing of value-added goods. These fruits may be efficiently used in plant biodiversity and germplasm conservation programmes. Recognizing the nutraceutical characteristics and value-added products of these fruits is crucial in local, national, and global markets.
Figure 1 .docx
Download MS Word (4.8 MB)Figure 2.docx
Download MS Word (166.7 KB)Acknowledgments
The authors offer special thanks to Department of Science and Technology (DST), Govt. of India for the Inspire fellowship in enabling the whole research. The authors are immensely thankful to the Department of Horticulture Aromatic and Medicinal Plants, Mizoram University for the research facilities and the authors are thankful to the local farmers who were more than willing to help and accompanied in the collection and identification of the collected fruits through harsh weather and hilly terrain.
Disclosure statement
No potential conflict of interest was reported by the author(s).
Supplementary material
Supplemental data for this article can be accessed online at https://doi.org/10.1080/10942912.2024.2374498
Additional information
Funding
References
- Kebu, B.; Fassil, K. Ethnobotanical Study of Wild Edible Plants in Derashe and Kucha Districts, South Ethiopia. J Ethnobiol. Ethnomed. 2006, 2(1), 53. DOI: 10.1186/1746-4269-2-53.
- Krishnamurthy, S. R.; Sarala, P. Determination of Nutritive Value of Ziziphus Rugosa Lamk.: A Famine Edible Fruit and Medicinal Plant of Western Ghats. Ind. J. Nat. Prod. Resour. 2011, 3(1), 20–27.
- Deepika, K. A.; Saini, A.; Kapoor, S.; Saxena, S.; Saxena; Sarita, S. Traditional Wild Edible Fruits of Himalaya: A Review. Food Humanity 2024, 2, 2100269. DOI: 10.1016/j.foohum.2024.100269.
- Rymbai, H.; Verma, V. K.; Talang, H.; Assumi, S. R.; Devi, M. B.; Vanlalruati Sangma, R. H. C. H.; Biam, K. P.; Chanu, L. J.; Makdoh, B.; Singh, A. R. Biochemical and Antioxidant Activity of Wild Edible Fruits of the Eastern Himalaya, India. Front. Nutr 2023, 10, 1039965. DOI: 10.3389/fnut.2023.1039965.
- Nazarudeen, A. Nutritional Composition of Some Lesser-Known Fruits Used by Ethnic Communities and Local Folks of Kerela. Ind. J. Tradit. Knowl 2010, 9(2), 398–402.
- Santhi, V. P.; Masilamani, P.; Sriramavaratharajan, V.; Murugan, R.; Gurav, S.; Sarasu, V. P.; Parthiban, S.; Ayyanar, M. Therapeutic Potential of Phytoconstituents of Edible Fruits in Combating Emerging Viral Infections. J. Food Biochem. 2021, 45(8). DOI: 10.1111/jfbc.13851.
- Gangapriya, P.; Arulraj, M. S.; Amalraj, S.; Murugan, R.; Ayyanar, M. J. Phytochemical Composition, Enzyme Inhibitory Potential, Antioxidant and Antibacterial Activities of Pisonia Grandis R.br. (Lettuce Tree) Leaves. Food Meas. Charact. 2022. DOI: 10.1007/s11694-022-01361-x.
- Cisneros-Zevallos, L. The Power of Plants: How Fruit and Vegetables Work as Source of Nutraceuticals and Supplements. Int. J. Food. Sci. Nutr. 2021. DOI: 10.1080/09637486.2020.1852194.
- Mahapatra, A.; Mishra, S.; Basak, U.; Panda, P. Nutrient Analysis of Some Selected Wild Edible Fruits of Deciduous Forests of India; an Explorative Study Towards Non Conventional Bio-Nutrition. Adv. J. Food Sci. Tech 2012, 4, 15–21.
- Bvenura, C.; Sivakumar, D. The Role of Wild Fruits and Vegetables in Delivering a Balanced and Healthy Diet. Food Res. Int. 2017, 99, 15–30. DOI: 10.1016/j.foodres.2017.06.046.
- Salvatore, S.; Pellegrini, N.; Brenna, O. V.; Del Rio, D.; Frasca, G.; Brighenti, F.; Tumino, R. Antioxidant Characterization of Some Sicilian Edible wild Greens. J. Agric. Food. Chem. 2005, 53(24), 9465–9471. DOI: 10.1021/jf051806r.
- Talang, H.; Yanthan, A.; Rathi, R. S.; Pradheep, K.; Longkumer, S.; Imsong, B.; Singh, L. H.; Assumi, R. S.; Devi, M. B.; Vanlalruati. Nutritional Evaluation of Some Potential Wild Edible Plants of North Eastern Region of India. Front. Nutr 2023, 10, 1052086. DOI: 10.3389/fnut.2023.1052086.
- A.O.A.C. Official Methods of Analysis, 21st Edn , 2019, Association of Official Analytical Chemists. Washington, 2019.
- Sadasivam, S.; Manickam, A. Biochemical Methods, 3rd ed.; New Age International Publishers: New Delhi, India, 2018.
- Nayak, J.; Mathan, J.; Mohanty, M.; Pradhan, C. An in vitro Hydroponic Study on Physiological and Biochemical Responses of Indian Wild Rice to Varying Doses of Hexavalent Chromium. Int Res.J. Env. Sci 2014, 3, 20–28.
- Ranganna, S. Handbook of Analysis and Quality Control for Fruit and Vegetable Products, 2nd ed.; Tata McGraw-Hill Pub.Co.: New Delhi, 2000.
- Bauer, S.; Ibáñez, A. B. Rapid Determination of Cellulose. Biotechnol. Bioeng. 2014, 111(11), 2355–2357. DOI: 10.1002/bit.25276.
- Subroto, E.; Lembong, E.; Filianty, F.; Indiarto, R.; Primalia, G.; Putri, M. S. K. Z.; Theodora, H. S.; Junar, S. The Analysis Techniques of Amino Acid and Protein in Food and Agricultural Products. Int. J. Sci. Technol. Res 2020, 9(10), 29–36.
- FAO Food energy- methods of analysis and conversion factors. Food and Nutrition Paper No. 77. Fao,rome. 2003. ftp://ftp.fao.org/docrep/fao/006/y5022e/y5022e00.pdf.
- Vijay, D. T.; Rajendra, S. B. Res. Rev. J. Pharmacog. Phytochem 2014, 2, 41.
- Anh Le, V.; Parks Sophie, E.; Nguyen Minh, H.; Roach, P. D. Improving the Vanillin-Sulphuric Acid Method for Quantifying Total Saponins. Technologies 2018, 6(3), 84. DOI: 10.3390/technologies6030084.
- Saad, N.; Esa, N. M.; Ithnin, H.; Shafie, N. H. Optimization of Optimum Condition for Phytic Acid Extraction From Rice Bran. African Journal of Plant Science. Afr. J. Plant. Sci. 2011. DOI: 10.5897/AJPS.9000180.
- Adeniyi, S. A.; Orjirekwe, C. L.; Ehiagbonare, J. E. Determination of Alkaloid and Oxalate in Some Selected Food Samples in Nigeria. Afr. J. Biotechnol. 2009, 8(1), 110–112.
- Lahare, R. P.; Yadav, H. S.; Bisen, Y. K.; Dashahre, A. K. Estimation of Total Phenol, Flavonoid, Tannin and Alkaloid Content in Different Extracts of Catharanthus Roseus from Durg District, Chhattisgarh, India. Scholars Bull. 2021, 7(1), 1–6. DOI: 10.36348/sb.2021.v07i01.001.
- Kayesh, E.; Shangguan, L.; Korir, N. K.; Sun, X.; Bilkish, N.; Zhang, Y.; Han, J.; Song, C.; Cheng, Z. M.; Fan, J. Fruit Skin Color and The Role of Anthocyanin. Acta Physiol. Plant. 2013. DOI: 10.1007/s11738-013-1332-8.
- El-Safy, S.; Khalifa, A. M.; Almashad, A. A.; Khalil, A. M.; Hammad, E.; Sami, R.; Aljahani, A. H.; Pareek, S.; Helal, M.; Alharthi, S. Utilization of Jamun fruit (Syzygium cumini L.) for value added food products. J. Food Qual. 2023, 2023, 1–10. DOI: 10.1155/2023/5460642.
- Angami, T.; Wangchu, L.; Debnath, P.; Sarma, P.; Singh, B.; Singh, A. K.; Hazarika, B. N.; Singh, M. C.; Touthang, L. ‘ Ayyanar, M.’ Exploring the Nutritional Potential and Anti-Nutritional Components of Wild Edible Fruits of the Eastern Himalayas. J. Food Measur.Charact 2023, 18(1), 1–18. DOI: 10.1007/s11694-023-02147-5.
- Ani, P. N.; Abel, H. C. Nutrient, Phytochemical, and Antinutrient Composition of Citrus Maxima Fruit Juice and Peel Extract. Food Sci. Nutri. 2018, 6(3), 653–658. DOI: 10.1002/fsn3.604.
- Davey, M. W.; Montagu, M. V.; Inzé, D.; Sanmartin, M.; Kanellis, A.; Smirnoff, N.; Fletcher, J. Plant L-Ascorbic Acid: Chemistry, Function, Metabolism, Bioavailability and Effects of Processing. J. Sci. Food Agric. 2000, 80, 825–860. DOI: 10.1002/(SICI)1097-0010.
- Bugaud, C.; Deverge, E.; Daribo, M. O.; Ribeyre, F.; Fils‐Lycaon, B.; Mbéguié‐A‐Mbéguié, D. Sensory Characterisation Enabled the First Classification of Dessert Bananas. J. Sci. Food Agric. 2011, 91(6), 992–1000. DOI: 10.1002/jsfa.4270.
- Pan, T.; Kong, L.; Zhang, X.; Wang, Y.; Zhou, J.; Fu, Z.; Pan, H.; She, W.; Yu, Y. Fruit Quality and Volatile Constituents of a New Very Early-Ripening Pummelo (Citrus maxima) Cultivar ‘Liuyuezao’. Front. Plant. Sci. 2023, 13, 13. DOI: 10.3389/fpls.2022.1089009.
- Etienne, A.; Génard, M.; Lobit, P.; Mbeguié-A-Mbéguié, D.; Bugaud, C. What Controls Fleshy Fruit Acidity? A Review of Malate and Citrate Accumulation in Fruit Cells. J.f Exp.l Bot. 2013, 64(6), 1451–1469. DOI: 10.1093/jxb/ert035.
- Biesalski, H. K.; Jana, T. Micronutrients in the Life Cycle: Requirements and Sufficient Supply. Nfs J. 2011, 11, 1–11. DOI: 10.1016/j.nfs.2018.03.001.
- Iago Garcia eSilva, E.; Barbosa da Silva, J.; Macedo Albuquerque, J.; Bazílio de Omena Messias, C. M. Physico-Chemical Characterization of Tamarind Residues (Tamarindus Indica L.): Nutritional and Anti-Nutritional Potential. O Mundo. da Saúde. 2020, 44, 595–606. DOI: 10.15343/0104-7809.202044595606.
- Adepoju, T. O. Proximate Composition and Micronutrient Potentials of Three Locally Available Wild Fruits in Nigeria. Afr. J. Agric. Res. 2009, 4(9), 887–892. http://www.academicjournals.org/AJAR.
- Hazarika, T. K.; Lalnunsangi, C. Genet. Resour. Crop Evol. 2018. DOI: 10.1007/s10722-018-0695-5.
- Kanfon, R. E.; Fandohan, A. B.; Agbangnan, P. D. C.; D Chadare, F. J. Ethnobotanical and Nutritional Value of Pulps, Leaves, Seeds and Kernels of Tamarindus Indica L.: A Review. Agron. Afr. 2023, 35(2), 297–322.
- Biswas, S. C.; Kumar, P.; Kumar, R.; Das, S.; Misra, T. K.; Dey, D. Nutritional Composition and Antioxidant Properties of the Wild Edible Fruits of Tripura, Northeast India. Sustainability. 2022, 14(19), 12194. DOI: 10.3390/su141912194.
- Parthsarathy, U.; Nandakishore, O. P. A Study on Nutrient and Medicinal Compositions of Selected Indian Garcinia Species. Curr.Bioact. Comp. 2014, 10(1), 55–61. DOI: 10.2174/157340721001140725001152.
- Insel, P. M.; Ross, D.; McMohan, K. Nutrition: Myplate Update; Jones & Bartlett publishers: Massachusetts, 2012.
- Rl, B., Jr. Moisture and Total Solids Analysis. In Food Analysis, Nielsen, S., Ed.; Springer Science and Business Media: New York, NY, 2010. DOI: 10.1007/978-1-4419-1478-1_6.
- Cvrk, R.; Junuzović, H.; Smajić-Bećić, A.; Kusur, A.; Brčina, T. Determination of Crude Fiber Content and Total Sugars in Correlation with the Production Process and Storage Time. Int. J. Res. Appl. Sci. Biotech. 2022, 9(3), 1–6. DOI: 10.31033/ijrasb.9.3.1.
- Vinardell, M. P.; Mitjans, M. Lignins and Their Derivatives with Beneficial Effects on Human Health. Int. J. Mol. Sci. 2017, 18(6), 1219. DOI: 10.3390/ijms18061219.
- Holtzapple, M. T. Cellulose, in Encyclopedia of Food Sciences and Nutrition, 2nd ed.; Texas A & M University: Texas, 2003.
- Pandey, S.; Deen, B. Studies on the Pattern of Changes Biochemical Constitutes of Ber (Zizyphus mauritiana Lamk.) Fruits cv. Narendra Ber Selection-1. Int. J. Curr. Microb. Appl. Sci. DOI: 10.20546/ijcmas.2018.704.071.
- Al-Qarni, S. S. M. Correlation between Amylase Activity & Reducing Sugar Content in Date Fruits: A Case of Increased Amylase Activity with a Proportional Increase in Reducing-Sugar Content of Fruits. J. Nutr. Food Sci. 2020. DOI: 10.35248/2155-9600.20.10.767.
- Meghwal, P. R.; Azam, M. M. Performance of Some Aonla Cultivars in Arid Region of Rajasthan. Ind. J. Hort. 2004, 61(1), 87–88.
- Phan, M. A. T.; Paterson, J.; Bucknall, M.; Arcot, J. Interactions Between Phytochemicals from Fruits and Vegetables: Effects on Bioactivities and Bioavailability. Crit. Rev. Food Sci. Nutr. 2018, 58(8), 1310–1329. DOI: 10.1080/10408398.2016.1254595.
- Petroski, W.; Minich, D. M. Is There Such a Thing As “Anti-nutrients”? A Narrative Review of Perceived Problematic Plant Compounds. Nutrients. 2020, 12(10), 2929. DOI: 10.3390/nu12102929.
- Tiwari, U. Cummings, E. Factors Influencing Levels of Phytochemicals in Selected Fruit and Vegetables During Pre- and Post-harvest Food Processing Operations. Food Res. Int. 2013. DOI: 10.1016/j.foodres.2011.09.007.
- Mugford, S. T.; Osbourn, A. Saponin Synthesis and Function. Isoprenoid Synth Plant Microorganisms: New Concepts And Exp. App. 2013, 405–424.
- Konietzny, U.; Jany, K. D.; Greiner, R. Phytate - An Undesirable Constituent of Plant-based Foods? J. Ernährungsmedizin. 2006, 8(3), 18–28.
- He, H.; Veneklaas, E. J.; Kuo, J.; Lambers, H. Physiological and Ecological Significance of Biomineralization in Plants. Trends Pl. Sci. 2014, 19(3), 166–174. DOI: 10.1016/j.tplants.2013.11.002.
- Siener, R.; Bade, D. J.; Hesse, A.; Hoppe, B. Dietary Hyperoxaluria Is Not Reduced by Treatment with Lactic Acid Bacteria. J. Transl. Med. 2013, 11(1), 306. DOI: 10.1186/1479-5876-11-306.
- Morris, A. L.; Mohiuddin, S. S. In Stat Pearls [Internet]; StatPearls Publishing: Treasure Island (FL), 2021.
- Sun, M.; Wu, X.; Yu, Y.; Wang, L.; Xie, D.; Zhang, Z.; Chen, L.; Lu, A.; Zhang, G.; Li, F. Disorders of Calcium and Phosphorus Metabolism and the Proteomics/metabolomics-Based Research. Front. Cell. Dev. Biol. 2020, 8, 8. DOI: 10.3389/fcell.2020.576110.
- Borgohain, B.; Borthakur, A.; Neog, B.; Saikia, P. A Review on Botanical Characteristics, Bioactive Compounds and Traditional Uses of Some Selected Unconventional Fruits of Upper Brahmaputra Valley, Assam. Asian J. Biol. Life Sci. 2022, 11(3), 647. DOI: 10.5530/ajbls.2022.11.86.
- Bhatt, S. C.; Kumar, V.; Gupta, A. K.; Mishra, S.; Naik, B.; Rustagi, S.; Preet, M. S. Insights on Bio-Functional Properties of Myrica Esculenta Plant for Nutritional and Livelihood Security. Food Chem. Adv. 2023, 3, 100434. DOI: 10.1016/j.focha.2023.100434.
- Pohl, H. R.; Wheeler, J. S.; Murray, H. E. Sodium and Potassium in Health and Disease. Metal Ions In Life Sci. 2013, 13, 29–47.
- Lombardi, G.; Ziemann, E.; Banfi, G.; Corbetta, S. Physical Activity-Dependent Regulation of Parathyroid Hormone and Calcium-Phosphorous Metabolism. IJMS 2020, 21(15), 21. DOI: 10.3390/ijms21155388.
- Grober, U.; Schmidt, J.; Kisters, K. Magnesium in Prevention and Therapy. Nutrients. 2015, 7(9), 8199–8226. DOI: 10.3390/nu7095388.
- Goff, J. P. Invited Review: Mineral Absorption Mechanisms, Mineral Interactions That Affect Acid–Base and Antioxidant Status, and Diet Considerations to Improve Mineral Status. J. Dairy. Sci. 2018, 101(4), 2763–2813. DOI: 10.3168/jds.2017-13112.
- Saeed, A.; Kauser, S.; D Iqbal, M. Nutrient, Mineral, Antioxidant, and Anthocyanin Profiles of Different Cultivars of Syzygium Cumini (Jamun) at Different Stages of Fruit Maturation. Pak. J. Bot. 2018, 50(5), 1791–1804.
- Wangchu, L.; Tamut, G.; Singh, B.; Singh, S. R.; Singh, S. Studies on Genetic Variability of Pummelo (Citrus grandis L.) in East Siang District of Arunachal Pradesh, India. Int. J. Basic Appl. Biol. 2017, 4(2), 64–73.