
 ?Mathematical formulae have been encoded as MathML and are displayed in this HTML version using MathJax in order to improve their display. Uncheck the box to turn MathJax off. This feature requires Javascript. Click on a formula to zoom.
ABSTRACT
The objective of the current study prepare yogurt enriched with roasted barley and oat flour in different treatments. The manual cleaning of oats and barley was carried out and placed in a traditional sand roaster with an iron pan at 280 ± 5°C for 20 seconds. Roasted barley and oat flours were used in different concentrations of 1:0; 3:0; 5:0; 0:1; 0:3; 0:5; 0.5:0.5; 1.5:1.5; and 2.5:2.5 g/100 g, respectively. The prepared yogurt was stored for 28 days at 4°C, and analyzed during the 7-day intervals. The results showed that roasted barley and oat flours contained higher concentrations of proteins (13.72 & 16.61%) and fibers (16.86 & 3.54%), which aided in the improvement of the properties of yogurt. The pH of the prepared yogurt was decreased (4.5 to 4.2), and titratable acidity was increased (0.61 to 0.70%) non-significantly in all treatments. The syneresis rate was decreased (25 to 19%) with increased concentrations of roasted barley and oats during storage. The microbial analysis of the fortified yogurt decreased the total plate count and total yeast count. Concludingly, roasted barley and oats improved the solid contents along with proteins, fats, and fiber contents of the prepared yogurts, improving the nutritional value of yogurt.
KEYWORDS:
Introduction
Milk as a complete diet is popular among the nations. Therefore, milk-based products have gained importance in ancient eras. The familiarity with dairy products and their complete nutritional attributes has increased their demand, i.e., ice creams, butter, cheeses, and various cultured yogurts. Cultured yogurt is commonly made by fermenting cow’s milk with lactic acid bacteria.[Citation1] Yogurt, a common fermented dairy product, has been shown to aid those with obesity by improving their gut health and preventing diabetes.[Citation2] Dairy products use milk fat to form their characteristic textures, flavors, and hues.[Citation3] The potential health benefits of nonfat yogurt enhanced with β-glucan, inulin, and microcrystalline cellulose for many persons suffering from chronic conditions have piqued the interest of the food industry.[Citation4,Citation5]
Cereals are farmed and consumed worldwide because of their high nutritional value. Consuming whole cereal grains containing prebiotics has been shown to improve intestinal health by promoting the growth of probiotics and reducing the risk of cardiovascular, cancer, and diabetes disease.[Citation6,Citation7] Barley (Hordeum vulgare L.) was one of the first crops cultivated by humans.[Citation8] Barley was cultivated in 36.1 thousand hectares, and its production was 37 thousand tons, according to the Economic Survey of Pakistan, 2022–23.[Citation9] Barley contains higher concentrations of vitamins, fiber, and protein than most other grains. Some specific minerals, i.e., Ca, Se, Mn, Zn, Cu, Fe, and P, are generally higher in barley than in corn. Barley is rich in 18 amino acids and varieties of unsaturated fatty acids, such as oleic acid, linolenic acid, and linoleic acid.[Citation10] Health benefits such as reduction in blood cholesterol levels, controlling glycemic index, antioxidant activity, weight loss, lower blood pressure, glucose levels in Type 2 diabetics, and protection against colon cancer have increased interest in utilizing barley in food production.[Citation11] Ciric et al.[Citation12] observed that combining barley with a dairy product like yogurt creates a very nutritious food that benefits consumer health. Roasting barley develops a unique nutty flavor while improving color, flavor, and scent. The roasting process improves the texture, crispiness, and volume of the roasted grain. Additionally, roasting increases the shelf life, color, flavor, and digestibility of cereals and legumes while lowering their antinutrient content.[Citation13]
Oat (Avena sativa L.) is a major crop among cereals, providing value-added nutrients in several industries, including human nutrition, animal feed, medicine, and even cosmetics.[Citation14] The global oat production in 2023/24 was 19,435 thousand metric tons (Grain: World Markets and Trade, 2024). The oat grain has several uses because of its nutrients, i.e., proteins (globulins), phenolic compounds, dietary fiber (especially β-glucan), vitamins, and minerals. Oat is set apart from other cereals. Husked oat has the greatest fiber content.[Citation15,Citation16] Oat protein comprises 80% globulins.[Citation17] It has been reported that roasting oats at temperatures up to 160°C might improve their flavor and nutritional profile. Roasting had slight to no effect on the fat, protein, carbohydrate, and β-glucan contents, although it somewhat altered the fiber fractions.[Citation18] Roasting is a method of food processing at temperatures of 150 to 300°C that modifies the food’s structure in ways that are beneficial to digestion, flavor, texture, color, taste, shelf life, and digestibility for a more enjoyable eating experience.[Citation19,Citation20] The enzymes in grain can be rendered inactive by a roasting process, extending its storage life. The low processing cost of roasting inactivation makes it a popular method for grain stabilization.[Citation21,Citation22]
The current study aimed to use cereals (barley and oats) in yogurt development as cereals can enhance dietary fibers, essential nutrients, and the rheological properties of yogurt. Cereal roasting enhanced digestibility and palatability and reduced food’s anti-nutrition factors. Purposely, this study was designed to develop yogurt from roasted barley and oat flour, owing to their high nutritional and antioxidant profile. This research is related to food product development and fortification, as it improves yogurt’s protein, fiber, and overall nutritional profile.
Materials and Methods
Procurement of raw material
Whole milk (buffalo), barley, oat, and starter cultures, i.e., Lactobacillus bulgaricus and Streptococcus thermophilus were obtained from Dairy Technology laboratory of the National Institute of Food Science and Technology (NIFSAT), University of Agriculture Faisalabad, Pakistan. Moreover, 0.1 N H2SO4, 4% Boric acid, 40% NaOH, Sulfuric acid digestion tablets, 1% methyl red indicator, hydrogen peroxide, sodium hydroxide, 1-diphenyl-2-picrylhydrazyl (DPPH), carboxymethyl cellulose (CMC) were purchased from a Merck Sigma-Aldrich® Solutions, Germany.
Roasted oat and barley flour preparation
The manual cleaning of oats and barley was carried out and placed in a traditional sand roaster with an iron pan with 610 mm (depth) and 915 mm (diameter) at 280 ± 5°C for 20 seconds. A diesel burner ignited the roaster, and oat and barley grains were continuously stirred to ensure proper heating. Then, roasted oat and barley grains were cooled down and passed by a 250 μm sieve to separate the grains from the sieve. The roasted grains of oats and barley were ground to make their flour. The prepared flours were placed in plastic containers of screw-tight lids and stored for further analysis at 4°C.[Citation23]
Proximate analysis of roasted flours
The flours of oat and barley were analyzed for their proximate compositions, i.e., fiber, ash, moisture, protein, fat, total carbohydrates, and Nitrogen extract free, using the modified methods.[Citation24]
Yogurt preparation
The full-fat yogurt used in the control treatment was made from whole buffalo milk (WBM) and cultured milk concentrate (CMC) (T0). Roasted barley and oat flours were used in different treatments, i.e., T1, T2, T3, T4, T5, T6, T7, T8, and T9 at concentrations of 1:0; 3:0; 5:0; 0:1; 0:3; 0:5; 0.5:0.5; 1.5:1.5; and 2.5:2.5 g/100 g, respectively. Following the addition of roasted flour and whole milk (500 ml) in predetermined ratios, the mixtures were heated to 85°C for 15 minutes, cooled to 42°C, and then inoculated with the beginning culture (0.1 g) and then stored in the refrigerator until further usage.[Citation25,Citation26]
Storage stability
The yogurt prepared with different treatments was stored for 28 days at 4°C, and different parameters, i.e., physiochemical analysis, syneresis, total antioxidant analysis, microbial growth, and textural analysis, were studied during the storage period with 7-day intervals.
Physiochemical analysis of yogurt
The total solids of prepared yogurts were determined according to the method described in AOAC,[Citation27] (Method; 952.23). The procedure described in AOAC,[Citation24] was utilized to determine the amount of crude fiber in barley and oat-enriched yogurt. The protein concentrations in yogurt samples were determined using the methodology specified by AOAC (method No. 955.04) with a slight modification regarding the sample preparation and modifying the yogurt dilution ratio or applying an alternative homogenization technique to better suit the consistency of the yogurt. The fat, total carbohydrate, pH, and titratable acidity (AOAC; Method 947.05) were determined by following the procedures described by Horwitz et al.[Citation28]
Syneresis
Syneresis was measured according to the methodology outlined by Vareltzis et al.[Citation29] In this study, yogurt samples weighing 30–40 g were centrifuged using a T 52.1 centrifuge model manufactured by VEB MLW Zentrifugenwerk Engelsdorf, Germany. The centrifugation was done at 222 G speed for 10 minutes while maintaining a temperature of 4°C. The transparent liquid portion was decanted, measured, and documented as a syneresis percentage.
Total antioxidant activity
Free Radical Scavenging Activity (DPPH): DPPH methanol solution (0.3 mM) was prepared and combined with various sample solutions. The solution consisted of a mixture of yogurt extracts (2.5 mL) and methanol (1.0 mL). The absorbance values of the samples and standard were recorded at a wavelength of 518 nm after 30 minutes.[Citation30] These results were then translated into antioxidant activity percentages utilizing the provided formula.
Ferric Reducing Antioxidant Power (FRAP): The ferric-reducing antioxidant capacity of the extract was assessed by following the slightly modified method of Zahin et al.[Citation31] A dried extract weighing 0.025 g was added in methanol and dissolved thoroughly, along with FRAP solution (200uL), into the tube. The spectrophotometer (IRMECO, U2020, Germany) was used to measure the absorbance values of the sample and control at 593 nm wavelength. The substitution of FeSO4 is made in place of the sample to make a standard curve.
Total phenolic contents
The total phenolic contents of yogurt were assessed using the modified method suggested by Turoli et al.[Citation32] The ABTS radical stock solution was made with the addition of 38.4 mg ABTS (2,2-azinobis) (3-ethylbenzthiazoline-6-acid) in 10 cm3 of a sodium persulfate solution with a concentration of 2.45 mM. Yogurt samples, with a volume of 0.01 cm3, were subjected to a reaction with 1 cm3 of the ABTS•+ working solution for 10 minutes at ambient temperature. The antioxidant capacity of the yogurt samples was quantified by measuring the Trolox equivalent (TE) amount in milligrams per 100 cm3 of yogurt. This measurement was obtained using a calibration curve, considering the percentage recovery.
Microbial analysis
The Petri plates were cleaned, and a 10 g yogurt sample was diluted using 0.01% peptone sterilized water. Sterile water (5%) supplementation and lactose (10%) was done in media M17 agar, and Streptococcus thermophilus was grown on it for 2 days at 45°C in triplicates. The same procedure and environmental conditions were applied to Lactobacillus bulgaricus count, but the media used for its growth was MRS agar, and the pH was adjusted to 5.2.[Citation33,Citation34]
The total plate count of the yogurt was evaluated using Plate Count Agar through incubation for 48 ± 3 hours at 35 ± 1°C. The colony counter was used to count the colonies, and the plate count formula was used to calculate microbes and presented as log CFU/ml.[Citation35] The yeast and mold were obtained from the yogurt and observed using the modified method of Lourens-Hattingh et al.,[Citation36] The yeast cultures were prepared in slants of YM agar containing malt and yeast extract and stored at 51°C. Then the incubation of yeast culture was carried out at 251°C for 2 days and its purity was to check the yeasts.
Viscosity
The rheological properties of yogurt, such as viscosity, were assessed at a temperature of 25 ± 2°C using a Brookfield rotational viscometer DV3T, as described by Chen et al.[Citation37]
Sensory evaluation
A panel of 10 judges, comprising both males and females, was chosen voluntarily. The panelists were instructed on testing terminologies and were asked to assess the yogurt sample’s flavor, body and texture, appearance, color, and overall acceptability. This evaluation was conducted using a 9-point Hedonic scale, where a rating of 1 indicated an extreme dislike and a rating of 9 indicated an extreme liking.[Citation38]
Statistical analysis
The results (average of 3 trials) were analyzed statistically for the test of significance (p < .05) by using ANOVA using SPSS VERSION 24.[Citation39] The mean values and Stdev presented the results. All the analyses were conducted in the triplicate.
Results and Discussion
Proximate analysis of roasted barley and roasted oat
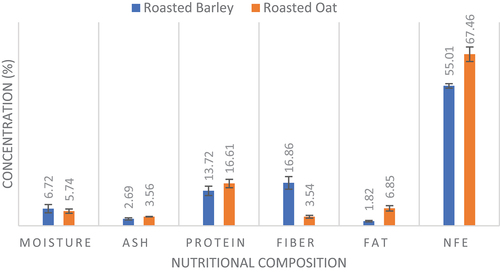
The proximate analysis of roasted barley flour and roasted oat flour was conducted to evaluate their nutritional composition. Roasted barley consisted of moisture, ash, protein, fiber, fat, and Nitrogen free extract (NFE) with concentrations of 6.72 ± 1.61, 2.69 ± 0.41, 13.72 ± 1.83, 16.86 ± 2.49, 1.82 ± 0.27 and 55.01 ± 0.89% as given in . The moisture contents followed the study of Zafar et al.[Citation40] who reported the moisture contents of roasted barley 10.72 ± 0.15%. Moreover, the percentage of other components of roasted barley was also similar to the concentrations of components of the current study. The study of El-Taib et al.[Citation41] also depicted similar percentages of moisture, ash, protein, fiber, protein, fat, and Nitrogen free extract (NFE) to the current study. The percentages of protein, fat, ash, and NFE were higher in roasted oats, i.e., 16.61 ± 1.63, 6.85 ± 1.07, 3.56 ± 0.08 and 67.46 ± 2.88% as compared to the roasted barley; however, the percentages of moisture and fibers were lower in oat, i.e., 3.54 ± 0.55 in comparison to the roasted barley. The moisture contents of roasted oats were similar to those measured by Tiwari et al.[Citation42] which resulted in 5% moisture. The authors also depicted the results of crude proteins, fats, and NFC contents, i.e., 16.2, 6.2 and 66.8%, respectively.
Figure 1. Proximate Composition of Roasted Barley and Roasted Oat.
Physiochemical analysis of yogurt
Any commodity’s sugars and various minerals concentrations represent its total soluble solids. The storage study of the yogurt soluble showed that the highest total soluble solid (TSS) was observed in the T6 group (12.76 ± 0.30%) on 1st day in which roasted oat flour was added, and the lowest was observed in T1 (11.58 ± 0.48%). The TSS of prepared yogurt observed on the 7th day depicted that the TSS was reduced in all treated yogurts, but their decline rate was very low (). On the 14th day of the storage study, the random change was observed in all the treatments, i.e., a minor increase was observed in T0, T1, T2, T3, T4, T5, and T7 with the values of 11.16 ± 0.83, 11.00 ± 0.81, 11.43 ± 0.87, 11.86 ± 0.56, 11.32 ± 0.53, 11.74 ± 0.37, and 11.32 ± 0.3% respectively. However, a decrease in TSS contents was observed in T6 (12.12 ± 0.43%), T8 (11.44 ± 0.30%), and T9 (12.23 ± 0.26%). A minor increase of TSS contents was observed in T0 (10.91 ± 2.15%), T1 (10.75 ± 0.50%), and T6 (11.84 ± 0.69%) and slightly decreased values of TSS contents were observed in all other treatments at 21st day in comparison to the 14th day of storage study. Moreover, similar results with slight variations were observed in all treatments on the 28th day of the storage study. The current research results were relevant to the results of Zafar et al.[Citation40] who found that the total soluble solids were increased with the increase in roasted barley concentrations in yogurt.
Table 1. Effect of Treatment and Storage Period on Physiochemical Properties.
The results indicated that the mean value of Crude Fiber (CF) percentage was higher in T3 with the value of 6.20 ± 0.20%, which was approximately similar to the T6 (6.20 ± 0.51%). The results on 1st day depicted that the CF values of prepared yogurt increased significantly with the increase in the roasted barley and roasted oat concentrations, alone and in different combinations. On the 7th day, the results indicated increased CF concentrations in all treated yogurts. On the 14th day of storage, a minor increase was observed in all prepared yogurt with similar trends to the 7th day. On the 21st day of the study, the CF contents resulted in the highest values of T3 (6.31 ± 0.23%) and T6 (6.29 ± 0.28%) with minor differences. The lowest CF contents were observed in T0 (5.53 ± 0.16%). The CF contents increased further on the 28th day in all treated yogurts. However, the least increment was observed in T0. Current research results were relevant to previous studies.[Citation43] The studies showed that the total soluble solids increased with increased roasted barley and oat concentrations in prepared yogurts.
The highest protein contents were observed in the T3 (3.39 ± 0.05%) group on the 1st day in which the roasted barley flour was added with 5%, and the lowest were observed in T0 (2.82 ± 0.08%). The protein of T6 was 3.38 ± 0.30%, which was lesser than T3 (3.39 ± 0.98%). On the 7th day, the protein contents were increased in all treated yogurts in minor concentrations. On the 14th day of the storage study, random change was observed in all the treatments, i.e., protein contents increased in all treatments randomly. Similarly, a minor increase in protein contents was observed in all treatments on the 21st day compared to the 14th day of storage study.
Moreover, similar results with slight variations were observed in all treatments on the 28th day of the storage study. The current research results were relevant to the results of Rizk et al.[Citation43] They increased proteins with the increase in roasted barley and roasted oat concentrations in prepared yogurts. Zhao et al.[Citation44] showed that adding 1% β-glucan from roasted oats and barley improves yogurt’s protein contents. The highest fat contents were observed in the T6 (3.80 ± 0.09%) group on the 1st day in which the 5% roasted oat flour and the lowest were observed in T7 (2.80 ± 0.22%). The fat of T9 was 3.50 ± 0.19%, which was less than T6 (3.80 ± 0.09%). On the 7th day, the fat contents were increased in all treated yogurts in minor concentrations. The highest value was obtained in T6, followed by T9 with the values of 3.81 ± 0.40 and 3.51 ± 0.23%, respectively. On the 14th day of the storage study, random change was observed in all the treatments, e.g., fat contents increased randomly. A minor increase in fat content was observed in all treatments on the 21st day.
Moreover, similar results with slight variations were observed in all treatments on the 28th day of the storage study. The current research results were relevant to the results of Rizk et al.[Citation43]; Zafar et al.[Citation40] They increased fats and roasted barley and oat concentrations in prepared yogurts. Zhao et al.[Citation44] showed that adding 1% β-glucan from roasted oats and barley improves yogurt’s fat contents.
The storage study of the yogurt resulted in the highest pH in the T0 (4.50 ± 0.11) and T4 (4.50 ± 0.70) group, and the lowest was observed in T1, T6, and T7 with the values 4.20 ± 0.33, 4.20 ± 0.66 and 4.20 ± 0.34, respectively at 1st day. The pH of T3 and T9 were 4.40 ± 0.24 and 4.40 ± 0.59, less than T0 and T4 treated groups. The pH of prepared yogurt observed on the 7th day depicted that the pH was reduced in all treated yogurts in minor concentrations except T3 (4.42 ± 0.83), T6 (4.21 ± 1.24), and T9 (4.41 ± 0.75). On the 14th day of the study, a random change was observed in all the treatments, i.e., pH increased in all treatments randomly. The pH increase was observed in all treatments on the 21st day, which increased further on the 28th day of the storage study. The current research results were relevant to the results of Zafar et al.[Citation40] In this study, the pH decreased with the barley concentrations in prepared yogurts. A study also reported that the pH of yogurt drinks decreased by adding roasted barley flour.[Citation19]
The mean value of titratable acidity (TA) was higher in T0 (0.70 ± 0.09%), which was approximately similar to the T1 (0.69 ± 0.06%), and the lowest TA was observed in T3 (0.61 ± 0.10%) and T7 (0.61 ± 0.12%). The TA value of T9 (0.65 ± 0.07%) was observed after T0 (0.70 ± 0.09%) and T1 (0.65 ± 0.07%). However, the TA concentration in prepared yogurts was found with the descending sequence of T5 (0.64 ± 0.05%), T6 (0.64 ± 0.06%), T4 (0.63 ± 0.10%), T2 (0.62 ± 0.18%), and T8 (0.62 ± 0.03%). On the 7th day, the results indicated that the TA concentrations were decreased in all treated yogurts. The highest value for TA was observed in T0 with a value of 0.71 ± 0.06%. The 2nd highest concentration of TA was observed in T1 (0.70 ± 0.08%) followed by the T9 (0.66 ± 0.08%), T4 (0.65 ± 0.09%), T8 (0.65 ± 0.07%), T5 (0.64 ± 0.07), T2 (0.63 ± 0.12%), T7 (0.63 ± 0.06), T3 (0.62 ± 0.02%) and T6 (0.62 ± 0.06%). The trends were similar to the results of the 7th day, with minor increases in all treatments. On the 21st day of the study, the TA contents resulted in the highest values of T0 (0.72 ± 0.08%) followed by T1 (0.71 ± 0.10%) with a minor difference. The lowest TA contents were observed in T3 and T7 (0.63 ± 0.10 and 0.63 ± 0.01%). The TA contents remained almost the same on the 28th day in all treated yogurts. However, the least increment was observed in T9. A study also reported that the titratable acidity of yogurt drinks was increased with roasted barley flour.[Citation19] Zafar et al.[Citation40] found that the acidity was increased with the increase in roasted barley and roasted oat concentrations in prepared yogurts.
Syneresis and viscosity of prepared yogurts
The storage study of the yogurt showed that the syneresis percentage of prepared yogurts was observed at the 7 days interval till the 28th day. The syneresis of T9 was the lowest (19.00 ± 1.04%), and T0 depicted the highest (25.00 ± 0.90%) syneresis. The syneresis percentage among T6 and T3 treatments was also on the lower side, as shown in . On the 7th day, the syneresis concentrations were increased in all treated yogurts. The highest value for syneresis was observed in T0 (25.38 ± 0.1.36%). The 2nd highest concentration of syneresis was observed in T1 (24.07 ± 1.21%). Similarly, the syneresis levels evaluated on the 14th day of storage showed a slight increase in all the produced yogurts. On the 21st day of the study, the syneresis contents resulted in the highest values of T0 (25.76 ± 3.19%) and T1 (24.43 ± 0.95%) with minor differences. The syneresis contents increased further on the 28th day in all treated yogurts. Kaur et al.[Citation45] conducted a study to evaluate roasted barley-fortified yogurt’s chemical, rheological, and sensory attributes. They concluded that β-glucan in the roasted barley reduced the syneresis phenomenon in the full-fat yogurt. Vasiljevic et al.[Citation46] concluded that adding β-glucan to roasted oats and barley reduced the linkage of whey and casein protein, reducing the syneresis phenomenon.
Table 2. Mean Values for Effect of Treatment and Storage Period on Syneresis (W/W %) and Viscosity (mPa.s).
The viscosity results showed that the lowest viscosity was observed in the T3 group at 1st day. The viscosity of T3 was 3995.00 ± 263.87 mPa.s, which was higher than T9 (3990.00 ± 94.06 mPa.s). On the 7th day, the viscosity concentrations were increased in all treated yogurts. The highest value for viscosity was observed in T3 (3795.25 ± 245.28 mPa.s). On the 14th day of storage, a minor increase was observed in all prepared yogurt. The highest value was observed in T3 and the lowest in T0. On the 21st day of the study, the viscosity contents resulted in the highest values of T3 (3708.19 ± 370.52 mPa.s) and T9 (3703.55 ± 284.28 mPa.s) with minor difference, and a further increase was observed at 28th day in all treated yogurts. A study conducted showed that the viscosity of the roasted barley fortification to some extent in the yogurts varied non-significantly.[Citation40] Gee et al.[Citation47] reported that the roasted barley β-glucan reduced the viscosity of the fortified yogurt.
Total antioxidant activity
The DPPH (2,2-diphenyl-1-picrylhydrazyl) assay determines the potential of any extract to scavenge the radicals of DPPH in organic solutions (methanol, ethanol hexane, etc.) The storage study of the yogurt resulted in the lowest DPPH observed in the T0 group on the 28th day, in which the roasted barley was added with the quantity of 1%. The DPPH of T6 was 2.13 ± 0.09 mM Trolox equivalent/g on day 1st which reduced non-significantly to 2.10 ± 0.06 mM Trolox equivalent/g on the 28th day of storage. T9 had the highest DPPH on 1st day of storage. The DPPH percentage increased among other treatments, i.e., the increasing trend of DPPH included T3 followed by T7, T8, and T9, with the values of 2.31 ± 0.05, 2.41 ± 0.15, 2.78 ± 0.06 mM Trolox equivalent/g respectively. Similarly, the DPPH contents were measured on the 14th day of storage, and a minor decrease was observed in all prepared yogurt. The highest value was observed in T9 and lowest in T1 with the values of 2.78 ± 0.06 and 1.94 ± 0.13 mM Trolox equivalent/g. The total mean values of the treatments depicted that the values varied significantly among the treatments, resulting in the addition of roasted oats and roasted barley flour having the potential to maintain the DPPH percentage during the storage period of 28 days compared to the control. The treatments T3, T8, and T9 depict higher DPPH scavenging activity throughout the storage period with slight variations, respectively (). Noh et al.[Citation48] determined the DPPH of commercial yogurt, resulting in the DPPH in the range of 1.62 to 8.95 mM Trolox eq./g, dw, similar to the current study.
Tabel 3. Mean Values for Effect of Treatment and Storage Period on Antioxidant Properties.
The lowest Total Phenolic Contents (TPC) were observed in the T9 group on the 1st day. The TPC of T1 was 6.620 ± 1.019 mg GAE/g on 1st day, which increased significantly to 7.451 ± 1.147 mg GAE/g on the 28th day of storage. T9 had the lowest percentage of TPC on 1st day of storage. The TPC percentage started increasing till the end of the storage period, which was significant in all the treatments. Compared to 2.5% of each barley, the roasted oats control group had good with the highest contents of TPC. 1% alone barley in T1 and 1% alone roasted oats in T4 were good in the TPC contents. In T1, the TPC value was 6.620 ± 1.019 mg GAE/g at the initial level, which increased to 7.023 ± 1.081 mg GAE/g on the 14th day, and further, a slight increase was observed on the 28th day, i.e., 7.451 ± 1.147 mg GAE/g. In T4 with 1% roasted oats, the value of TPC was 6.600 ± 1.030 mg GAE/g at the start of storage, which increased to 7.212 ± 1.126 mg GAE/g on the 21st day and then 7.428 ± 1.160 mg GAE/g at the 28th day of storage. This significant increase in TPC may be correlated with the effect of fermentation and storage conditions and the changes in the product, i.e., microbial metabolic products and the physicochemical changes in the product. Other factors, like lactic acid production in yogurt, also contribute to increased TPC contents within the storage period. The TPC value was less than that of other treatments in T6, which had 5% roasted oats but not T9. At the start of storage, the TPC contents were 4.400 ± 0.240 mg GAE/g, which increased slightly to 4.488 ± 0.245 mg GAE/g on the 14th day and further 4.579 ± 0.250 mg GAE/g at the end of storage. In a study, the yogurt was fortified with the encapsulated grapes seed extract, which increased the total phenolic contents from 1.19 mg GAE/g of FW to 5.8 mg GAE/g of FW.[Citation49]
The lowest FRAP percentage was observed in the T0 group on the 28th day, on which the roasted barley was added with a quantity of 1%. The FRAP of T3 was 2.195 ± 0.00 μM on day 1st, which reduced non-significantly to 2.109 ± 0.067 μM on the 28th day of storage. T9 had the highest percentage of FRAP on 1st day of storage. The FRAP value was increased among other treatments, i.e., the increasing trend of FRAP included T3 followed by T7, T8, and T9, with the values of 2.195 ± 0.001, 1.695 ± 0.003, and 2.809 ± 0.008 μM respectively from 1st day to 28th day of storage. Different studies suggested that the FRAP value increases with the increase in storage time.[Citation50,Citation51]
Microbial analysis
The concentration of S. thermophilus (CFU/g) was higher in T6. However, the S. thermophilus found in all prepared yogurts was in the descending sequence of T8, T5, T4, T7, T2, T1, and T0. On the 7th day, the S. thermophilus growth was increased in all treated yogurts (). The highest value for S. thermophilus was observed in T3. S. thermophilus growth was increased slightly in all prepared yogurt on the 14th day of storage. On the 21st day of the study, the S. thermophilus contents resulted in the highest values of T6 and T3 with minor differences. The lowest S. thermophilus contents were observed in T0. The S. thermophilus contents increased further on the 28th day in all treated yogurts. However, the least increment was observed in T2. The study of roasted barley fortified resulted in similar trends of S. thermophilus counts during roasted barley fortified yogurt storage.[Citation40]
Figure 2. Effect of Roasted Barley and Oat Addition on the Streptococcus SPPs, L. bulgaricus, total plate count and total yeast count in Prepared Yogurts.
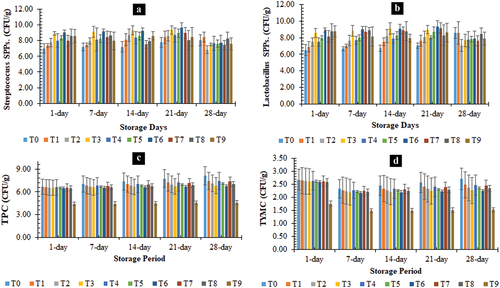
The results indicated that the concentration of L. bulgaricus (CFU/g) was higher in T6. The L. bulgaricus value (CFU/g) of T9 was observed after T6 (). Consequently, the Results on 1st day depicted that the L. bulgaricus values of prepared yogurt increased significantly with the increase in the roasted barley and roasted oat concentrations, alone and in different combinations. On the 7th day, L. bulgaricus growth was increased in all treated yogurts. The highest value for L. bulgaricus was observed in T6, followed by T8, T3, T9, T7, T5, T2, T1 and T0. L. bulgaricus growth increased slightly in all prepared yogurt on the 14th day of storage. On the 21st day of storage, L. bulgaricus had the highest values of T6 (9.35 CFU/g) and T3 (8.98 CFU/g). The lowest L. bulgaricus growth was observed in T0 (7.05 CFU/g). The L. bulgaricus increased further on the 28th day in all treated yogurts. The study of roasted barley fortified resulted in similar trends of L. bulgaricus counts during the storage of roasted barley fortified yogurt.[Citation40]
The results indicated that the total plate count (CFU/g) concentration was higher in T0. The lowest total plate count (CFU/g) was observed in T9. However, the total plate count in prepared yogurts was found with the descending sequence of T1, T2, T4, T5, T3, T8, T6, and T9, as shown in . Consequently, the Results on 1st day depicted that the TPC values of prepared yogurt decreased significantly with the increase in the roasted barley and roasted oat concentrations, alone and in different combinations. On the 7th day, the results indicated that all treated yogurts’ total plate count was altered. The highest value for total plate count was observed in T0. The 2nd highest total plate count was observed in T1. Similarly, the TPC contents were measured on the 14th day of storage, and a minor decrease was observed in all prepared yogurt in the same trend as the 7th day. The highest value was observed in T0 and the lowest in T9. On the 21st day of the study, the total plate count resulted in the highest values of T0 (7.733 ± 1.160 CFU/g). The lowest TPC contents were observed in T9 (4.533 ± 0.248 CFU/g). The TPC contents decreased further on the 28th day in all treated yogurts. However, the least decrease was observed in T0.
The results indicated that Total Yeast and Mold Count (TYMC) (CFU/g) was observed to be higher in T0. The TYMC value (CFU/g) of T7 was observed after T0. However, the TYMC concentration in prepared yogurts was found with the descending sequence of T1, T2, T4, T5, T3, T8, T6, and T9. Consequently, the results on 1st day depicted that the TYMC values of prepared yogurt decreased significantly with the increase in the roasted barley and roasted oat concentrations, alone and in different combinations. On the 7th day, the results indicated that the TYMC concentrations were altered in all treated yogurts. The highest value for TYMC was observed in T0. Similarly, the TYMC was noticed on the 14th day of storage, and a minor decrease was observed in all prepared yogurt. On the 21st day of the study, the TYMC resulted in the highest values of T0 (2.578 ± 0.387 CFU/g) and T9 (1.511 ± 0.083 CFU/g) with a minor difference. The TYMC contents decreased further on the 28th day in all treated yogurts ().
Sensory evaluation of prepared yogurt
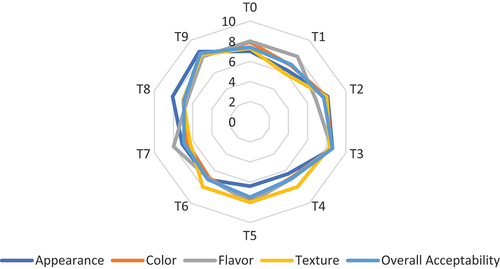
The sensory attributes of any product are the parameters on which a panel of judges decide and characterize the products. The results indicated that the highest points for appearance were given by the judges to the T9 (8.6 ± 0.23) yogurt having 2.5:2.5% roasted barley and roasted oats. Similar values were observed for the T3 (8.6 ± 0.24), having 5% of roasted barley (). The judges gave the points for the color were highest T3 (8.5 ± 0.09). The highest value for the flavor was observed in T3 (8.5 ± 0.14) treated yogurt. The treatments such as T0 (8.0 ± 0.36), T1 (8.0 ± 0.49), T5 (8.0 ± 0.36), T6 (7.0 ± 0.44) and T9 (8.0 ± 0.69) depicted the approximately similar scores. However, the lowest flavor value was observed in T8 (6.6 ± 0.16) treated yogurt. The judges analyzed the texture of yogurt. The panel of judges gave the highest points to the T3 (8.3 ± 0.30), followed by T9 (8.2 ± 0.49) treated yogurt, and the lowest to the T1 (5.9 ± 1.07). The scores of T2 (8.0 ± 0.31), T4 (8.0 ± 0.84), T5 (8.0 ± 0.87), and T6 (8.0 ± 0.87) were similar. The overall acceptability of T3 treated yogurt was highest among all other yogurts followed by the T9, T2, T6, T0, T6, T4, T1, T7 and T8 with the values of 8.6 ± 0.21, 8.4 ± 0.36, 7.7 ± 0.92, 7.5 ± 0.67, 7.4 ± 0.34, 7.0 ± 0.85, 7.0 ± 0.62, 7.1 ± 0.47, 6.9 ± 0.38 and 6.9 ± 0.36, respectively. The current research results were relevant to the results of Zafar et al.[Citation40] who found that the sensory attributes were increased with the increase in roasted barley concentrations in yogurt. Åman et al.[Citation52] also resulted in a study that the increase in the roasted oat-based β-glucan concentrations (0.1, 0.2, 0.3, 0.4, and 0.5 w/w. %) improved the texture of the prepared yogurts.
Figure 3. Effect of Treatment on various Parameters of Sensory Evaluation.
Conclusion and Recommendations
The current study concluded that the fortification of roasted barley and oat flours could be a good source for improving physiochemical attributes, syneresis percentage, and total antioxidant, microbial, rheological, and sensory characteristics. Roasted barley and oats improved the solid contents along with proteins, fats, and fiber contents of the prepared yogurts, improving the nutritional value of yogurt. However, roasted barley alone (T3) and roasted oats (T9) depicted the best results for all studied parameters throughout the storage period. The study suggested that the consumption of roasted barley and oat-fortified yogurt can improve the GIT tract and digestibility by improving the health of gut microbiota. Functional yogurt production on the industrial scale can be a good initiative toward improving population health and reducing disease rates.
Institutional Review Board Statement
This study did not involve humans or animals.
Informed Consent Statement
This study did not involve humans.
Acknowledgment
The authors gratefully acknowledge the University Institute of Food Science & Technology, The University of Lahore, Lahore, Pakistan.
Disclosure statement
No potential conflict of interest was reported by the author(s).
Data availability statement
The data supporting this study’s findings are available from the corresponding author upon reasonable request.
References
- Danielyan, L.; Hovhannisyan, H.; Baghdasaryan, L.; Barseghyan, A. New Generation of Functional Yogurts Fermented with Probiotic Lactic Acid Bacteria Isolated from Human Milk. Funct. Foods Health Dis. 2024, 14(4), 232–247. DOI: 10.31989/ffhd.v14i4.1347.
- Panahi, S.; Tremblay, A. The Potential Role of Yogurt in Weight Management and Prevention of Type 2 Diabetes. J. Am Coll. Nutr. 2016, 35(8), 717–731. DOI: 10.1080/07315724.2015.1102103.
- Ghosh, S.; Sarkar, T.; Chakraborty, R.; Shariati, M. A.; Simal-Gandara, J. Nature’s Palette: An Emerging Frontier for Coloring Dairy Products. Crit. Rev Food Sci Nutr. 2024, 64(6), 1508–1552. DOI: 10.1080/10408398.2022.2117785.
- Ahmed, R. M.; Elsanhoty, R. M.; Al-Saman, M. A. A.; Ramadan, M. F. Hypocholesterolaemic Effect of Probiotic Yogurt Enriched with Barley β-Glucan in Rats Fed on a High-Cholesterol Diet. Mediterr J. Nutr. Metab. 2017, 10(1), 1–12. DOI: 10.3233/MNM-16114.
- Hamid, A. I.; Doosh, K. S. Studying of Physicochemical and Sensory Properties of Reduced Fat Yogurt Manufactured by Adding Beta-Glucan of Barley. Ann. Rom Soc. Cell Biol. 2021, 3287–3301.
- Luca, L.; Oroian, M. Oat Yogurts Enriched with Synbiotic Microcapsules: Physicochemical, Microbiological, Textural and Rheological Properties During Storage. Foods. 2022, 11(7), 940. DOI: 10.3390/foods11070940.
- Xiong, Y.; Zhang, P.; Warner, R. D.; Shen, S.; Fang, Z. Cereal Grain-Based Functional Beverages: From Cereal Grain Bioactive Phytochemicals to Beverage Processing Technologies, Health Benefits and Product Features. Crit. Rev Food Sci Nutr. 2022, 62(9), 2404–2431. DOI: 10.1080/10408398.2020.1853037.
- Giraldo, P.; Benavente, E.; Manzano-Agugliaro, F.; Gimenez, E. Worldwide Research Trends on Wheat and Barley: A Bibliometric Comparative Analysis. Agronomy. 2019, 9(7), 352. DOI: 10.3390/agronomy9070352.
- Ministry of Finance, Government of Pakistan. Pak. Econ. Survey 2023. https://www.finance.gov.pk/survey/chapters_23/02_Agriculture.pdf.
- Guo, T.; Horvath, C.; Chen, L.; Chen, J.; Zheng, B. Understanding the Nutrient Composition and Nutritional Functions of Highland Barley (Qingke): A Review. Trends Food Sci. Technol. 2020, 103, 109–117. DOI: 10.1016/j.tifs.2020.07.011.
- Ruirong, P.; Hassane Hamadou, A.; Xu, B. Germination in Improving the Nutrition, Health Benefits and Processing of Highland Barley. Int. J. Food Sci. Technol. 2024, 59(4), 2162–2171. DOI: 10.1111/ijfs.17012.
- Ciric, A.; Radu, N.; Zaharie, M. G. O.; Neagu, G.; Pirvu, L. C.; Begea, M.; Stefaniu, A. Potential Antitumor Effect of Functional Yogurts Formulated with Prebiotics from Cereals and a Consortium of Probiotic Bacteria. Foods 2023, 12(6), 1250. DOI: 10.3390/foods12061250.
- Sharma, P.; Gujral, H. S.; Rosell, C. M. Effects of Roasting on Barley β-Glucan, Thermal, Textural and Pasting Properties. J. Cereal Sci. 2011, 53(1), 25–30. DOI: 10.1016/j.jcs.2010.08.005.
- Paudel, D.; Dhungana, B.; Caffe, M.; Krishnan, P. A Review of Health-Beneficial Properties of Oats. Foods. 2021, 10(11), 2591. DOI: 10.3390/foods10112591.
- Biel, W.; Kazimierska, K.; Bashutska, U. Nutritional Value of Wheat, Triticale, Barley and Oat Grains. Acta Sci Pol. Zootech. 2020, 19(2), 19–28. DOI: 10.21005/asp.2020.19.2.03.
- Majumdar, A.; Gil-González, A. B.; Grau, A. B.; Sardari, R. R.; Larsson, O.; Thyagarajan, A.; Zambrano, J. A.; Hernández-Hernández, O.; Olsson, O.; Zambrano, J. A. Macromolecular Characterization of High β-Glucan Oat Lines. Heliyon 2024, 10(2), e24552. DOI: 10.1016/j.heliyon.2024.e24552.
- Ibrahim, M. S.; Ahmad, A.; Sohail, A.; Asad, M. J. Nutritional and Functional Characterization of Different Oat (Avena Sativa L.) Cultivars. Int. J. Food Prop. 2020, 23(1), 1373–1385. DOI: 10.1080/10942912.2020.1806297.
- Schlörmann, W.; Zetzmann, S.; Wiege, B.; Haase, N. U.; Greiling, A.; Lorkowski, S.; Dawczynski, C.; Glei, M. Impact of Different Roasting Conditions on Sensory Properties and Health-Related Compounds of Oat Products. Food Chem. 2020, 307, 125548. DOI: 10.1016/j.foodchem.2019.125548.
- Abdeldaiem, A. M.; Ali, A. H.; Mousa, A. H.; Elkot, W. F.; Simal-Gandara, J. Ice Cream Supplemented with Roasted and Grilled Corn Powders: Physical Properties, Rheology, Antioxidant Activity, Color, Sensory Evaluation, and Production Cost. Int J Gastron. Food Sci. 2023, 32, 100692. DOI: 10.1016/j.ijgfs.2023.100692.
- Sruthi, N. U.; Premjit, Y.; Pandiselvam, R.; Kothakota, A.; Ramesh, S. V. An Overview of Conventional and Emerging Techniques of Roasting: Effect on Food Bioactive Signatures. Food Chem. 2021, 348, 129088. DOI: 10.1016/j.foodchem.2021.129088.
- Ikram, A.; Saeed, F.; Afzaal, M.; Imran, A.; Niaz, B.; Tufail, T.; Hussain, M.; Anjum, F. M. Nutritional and End‐Use Perspectives of Sprouted Grains: A Comprehensive Review. Food Sci. Nutr. 2021, 9(8), 4617–4628. DOI: 10.1002/fsn3.2408.
- Zhao, B.; Shang, J.; Liu, L.; Tong, L.; Zhou, X.; Wang, S.; Zhou, S. Effect of Roasting Process on Enzymes Inactivation and Starch Properties of Highland Barley. Int J Biol. Macromol. 2020, 165, 675–682. DOI: 10.1016/j.ijbiomac.2020.09.180.
- Ikram, A.; Saeed, F.; Arshad, M. U.; Afzaal, M.; Anjum, F. M. Structural and Nutritional Portrayal of Rye‐Supplemented Bread Using Fourier Transform Infrared Spectroscopy and Scanning Electron Microscopy. Food Sci. Nutr. 2021, 9(11), 6314–6321. DOI: 10.1002/fsn3.2592.
- AOAC. Official Methods of Analysis of AOAC International, 18th ed.; Gaitherburg: AOAC International, 2011; p. 2590.
- Abdeldaiem, A. M.; Ali, A. H.; Shah, N.; Ayyash, M.; Mousa, A. H. Physicochemical Analysis, Rheological Properties, and Sensory Evaluation of Yogurt Drink Supplemented with Roasted Barley Powder. LWT. 2023, 173, 114319. DOI: 10.1016/j.lwt.2022.114319.
- Anjum, F. M.; Saeed, F.; Afzaal, M.; Ikram, A.; Azam, M. The Effect of Thermal Processing on Probiotics Stability. In Advances in Dairy Microbial Products, Joginder S., Ashish V., Eds. Elsevier: Woodhead Publishing, 2022; pp. 295–302.
- AOAC (Association of Official Analytical Chemists). Official Methods of Analysis. p 1990.
- Horwitz, W.; Albert, R. The Horwitz Ratio (HorRat): A Useful Index of Method Performance with Respect to Precision. J. AOAC Int. 2006, 89(4), 1095–1109. DOI: 10.1093/jaoac/89.4.1095.
- Vareltzis, P.; Adamopoulos, K.; Stavrakakis, E.; Stefanakis, A.; Goula, A. M. Approaches to Minimise Yoghurt Syneresis in Simulated Tzatziki Sauce Preparation. Int. J Dairy Technol. 2016, 69(2), 191–199. DOI: 10.1111/1471-0307.12238.
- Sirivibulkovit, K.; Nouanthavong, S.; Sameenoi, Y. Based DPPH Assay for Antioxidant Activity Analysis. Anal. Sci. 2018, 34(7), 795–800. DOI: 10.2116/analsci.18P014.
- Zahin, M.; Aqil, F.; Ahmad, I. Broad Spectrum Antimutagenic Activity of Antioxidant Active Fraction of Punica Granatum L. Peel Extracts. Mutat. Res. Genet. Toxicol. Environ. Mutagen. 2010, 703(2), 99–107. DOI: 10.1016/j.mrgentox.2010.08.001.
- Turoli, D.; Testolin, G.; Zanini, R.; Bellù, R. Determination of Oxidative Status in Breast and Formula Milk. Acta. Paediatr. 2004, 93(12), 1569–1574. DOI: 10.1111/j.1651-2227.2004.tb00845.x.
- Abbas, M. S.; Saeed, F.; Afzaal, M.; Jianfeng, L.; Hussain, M.; Ikram, A.; Jabeen, A. Recent Trends in Encapsulation of Probiotics in Dairy and Beverage: A Review. Food Process. Preserv. 2022, 46(7), e16689. DOI: 10.1111/jfpp.16689.
- Irkin, R.; Eren, U. V. A Research About Viable Lactobacillus Bulgaricus and Streptococcus Thermophilus Numbers in the Market Yoghurts.
- Manual, B. B. A. Aerobic Plate Count. 2001. https://www.fda.gov/food/laboratory-methods-food/bam-aerobic-plate-count.
- Lourens-Hattingh, A.; Viljoen, B. C. Survival of Dairy-Associated Yeasts in Yoghurt and Yoghurt-Related Products. Food Microbiol. 2002, 19(6), 597–604. DOI: 10.1006/fmic.2002.0515.
- Chen, B.; Cai, Y.; Zhao, X.; Wang, S.; Zhuang, Y.; Zhao, Q.; Van der Meeren, P. A Novel Set-Type Yogurt with Improved Rheological and Sensory Properties by the Sole Addition of Insoluble Soybean Fiber. Food Biosci. 2024, 58, 103739. DOI: 10.1016/j.fbio.2024.103739.
- Ade, I. C.; Ingbian, E. K.; Abu, J. O. Physical, Chemical and Sensory Properties of Baked Products from Blends of Wheat and African Yam Bean (Sphenostylis Stenocarpa) Water-Extractable Proteins. Niger Food J. 2012, 30(1), 109–115. DOI: 10.1016/S0189-7241(15)30019-9.
- Brückner-Gühmann, M.; Benthin, A.; Drusch, S. Enrichment of Yoghurt with Oat Protein Fractions: Structure Formation, Textural Properties and Sensory Evaluation. Food Hydrocoll. 2019, 86, 146–153.
- Zafar, U.; Hameed, A.; Amjad, A.; Javed, M. S.; Afzal, M. I.; Umer, M.; JBawi, A. L. Potential of Barley Enriched Yogurt to Improve Probiotic Growth for the Management of Hypercholesterolemia. Int J. Food Prop. 2023, 26(1), 1177–1189. DOI: 10.1080/10942912.2023.2206064.
- El-Taib, H. I.; Rizk, I. R. S. A.; Yousif, E. I.; Hassan, A. A. Effect of Barley Flour on Wheat Bread Quality. Arab Univ. J. Agric. Sci. 2018, 26(2A), 1109–1119. DOI: 10.21608/ajs.2018.28364.
- Tiwari, N.; Awasthi, P. Effect of Different Processing Techniques on Nutritional Characteristics of Oat (Avena Sativa) Grains and Formulated Weaning Mixes. J. Food Sci Technol. 2014, 51, 2256–2259. DOI: 10.1007/s13197-012-0694-z.
- Rizk, I. R. S.; Rasmy, N. M.; Mahdy, S. M.; Mahdy, S. Effect of Substitution of Wheat Flour with Oat and Barley Meal on the Functional, Rheological and Sensory Properties of Tarhana. Arab Univ. J. Agric. Sci. 2019, 27(1), 445–465. DOI: 10.21608/ajs.2019.43584.
- Zhao, P.; Li, N.; Chen, L.; Guo, Y.; Huang, Y.; Tong, L.; Wang, L.; Fan, B.; Wang, F.; Liu, L. Effects of Oat β-Glucan on the Textural and Sensory Properties of Low-Fat Set Type Pea Protein Yogurt. Molecules. 2023, 28(7), 3067. DOI: 10.3390/molecules28073067.
- Kaur, R.; Riar, C. S. Sensory, Rheological and Chemical Characteristics During Storage of Set Type Full Fat Yoghurt Fortified with Barley β-Glucan. J. Food Sci. Technol. 2020, 57(1), 41–51. DOI: 10.1007/s13197-019-04027-7.
- Vasiljevic, T.; Kealy, T.; Mishra, V. K. Effects of β‐Glucan Addition to a Probiotic Containing Yogurt. J. Food Sci. 2007, 72(7), C405–C411. DOI: 10.1111/j.1750-3841.2007.00454.x.
- Gee, V. L.; Vasanthan, T.; Temelli, F. Viscosity of Model Yogurt Systems Enriched with Barley β-Glucan as Influenced by Starter Cultures. Int. Dairy J. 2007, 17(9), 1083–1088. DOI: 10.1016/j.idairyj.2007.01.004.
- Noh, Y. H.; Jang, A. S.; Pyo, Y. H. Quality Characteristics and Antioxidant Capacities of Korean Commercial Yogurt. Korean J Food Sci. Technol. 2020, 52(2), 113–118.
- Yadav, K.; Bajaj, R. K.; Mandal, S.; Saha, P.; Mann, B. Evaluation of Total Phenol Content and Antioxidant Properties of Encapsulated Grape Seed Extract in Yoghurt. Int. J Dairy Technol. 2018, 71(1), 96–104. DOI: 10.1111/1471-0307.12464.
- Baniasadi, M.; Azizkhani, M.; Saris, P. E. J.; Tooryan, F. Comparative Antioxidant Potential of Kefir and Yogurt of Bovine and Non-Bovine Origins. J. Food Sci Technol. 2022, 59(4), 1307–1316. DOI: 10.1007/s13197-021-05139-9.
- Yilmaz-Ersan, L.; Ozcan, T.; Akpinar-Bayizit, A.; Sahin, S. Comparison of Antioxidant Capacity of Cow and Ewe Milk Kefirs. J. Dairy Sci. 2018, 101(5), 3788–3798. DOI: 10.3168/jds.2017-13871.
- Åman, P.; Rimsten, L.; Andersson, R. Molecular Weight Distribution of β‐Glucan in Oat‐Based Foods. Cereal Chem. 2004, 81(3), 356–360. DOI: 10.1094/CCHEM.2004.81.3.356.