
Abstract
The Community Multiscale Air Quality (CMAQ) modeling system Version 5.0 (CMAQv5.0) was released by the U.S. Environmental Protection Agency (EPA) in February 2012, with an interim release (v5.01) in July 2012. Because CMAQ is a community model, the EPA encourages the development of proven alternative science treatments by external scientists and developers that can be incorporated as part of an official CMAQ release. This paper describes the implementation, evaluation, and testing of a plume-in-grid (PinG) module in CMAQ 5.01. The PinG module, also referred to as Advanced Plume Treatment (APT), provides the capability of resolving sub-grid-scale processes, such as the transport and chemistry of point-source plumes, in a grid model. The new PinG module in CMAQ 5.01 is applied and evaluated for two 15-day summer and winter periods in 2005 to the eastern United States, and the results are compared with those from the base CMAQ 5.01. Eighteen large point sources of NOx in the eastern United States were selected for explicit plume treatment with APT in the PinG simulation. The results show that overall model performance is negligibly affected when PinG treatment is included. However, the PinG model predicts significantly different contributions of the 18 sources to pollutant concentrations and deposition downwind of the point sources compared to the base model.
Implications:
This study describes the incorporation of a plume-in-grid (PinG) capability within the latest version of the EPA grid model, CMAQ. The capability addresses the inherent limitation of the grid model to resolve processes, such as the evolution of point-source plumes, which occur at scales much smaller than the grid resolution. The base grid model and the PinG version predict different source contributions to ozone and PM2.5 concentrations that need to be considered when source attribution studies are conducted to determine the impacts of large point sources on downwind concentrations and deposition of primary and secondary pollutants.
Introduction
The U.S. Environmental Protection Agency (EPA) Community Multiscale Air Quality Model (CMAQ; Byun and Schere, Citation2006) is a comprehensive three-dimensional “one-atmosphere” air quality grid model that is routinely used to address urban, regional-scale and continental-scale multipollutant issues such as ozone, particulate matter, and air toxics. Although the core code in CMAQ is developed and updated by EPA scientists, it is a community model and the EPA encourages the development of proven alternative science treatments by external scientists and developers that can be incorporated as part of the official CMAQ release. The core model lacks a treatment of sub-grid-scale plumes emitted from point sources. Thus, the emissions from these sources are instantaneously mixed into the grid cells containing the sources, with the vertical extent of the mixing defined by the plume rise. In reality, the dimensions of the point-source plumes do not approach grid cell sizes until they have traveled several tens of kilometers downwind. With grid resolutions of 36 km, 12 km, and even 4 km that are commonly used in typical applications, the inability of a grid model to resolve point-source plumes can lead to errors in the treatment of the transport and chemistry of the pollutants emitted from these sources. Finer resolutions (e.g., 1 km) may be adopted to reduce these errors, but this can be prohibitively expensive and can require substantial computing resources for large domain or long-term simulations, due to both the large number of grid cells that must be stored and solved and the smaller time steps that must be used in the solution because of the Courant number restriction on the model time step. Thus, fine-resolution modeling is not yet practical for many typical source attribution studies.
A popular approach to address this limitation of grid models is to incorporate a plume-in-grid (PinG) treatment in the model to explicitly simulate the initial transport and chemistry of point-source emissions using a reactive plume model. In this paper, we describe the implementation of such a proven plume-in-grid treatment in the latest version of CMAQ, and present results from the application of the model to the eastern United States for summer and winter months in 2005. We compare the performance of the model with and without PinG treatment and examine the impact of PinG treatment on point-source contributions to downwind and regional ozone and PM2.5 concentrations.
Sub-Grid-Scale Treatment of Point-Source Emissions
Techniques that have been adopted to address the limitations of grid models in resolving sub-grid-scale effects include the use of multiple nested fine grids, including one-way and two-way nesting, adaptive grid modeling, hybrid modeling, and plume-in-grid modeling. Karamchandani et al. (Citation2011) provide a review of these various approaches and focus on the most popular approach, PinG modeling, which was initially introduced in a grid model more than 30 years ago (Seigneur et al., Citation1983) for modeling ozone concentrations. In the PinG modeling approach, the errors associated with the grid averaging of stack emissions or other sub-grid-scale variations are reduced by embedding a Lagrangian puff or plume model within the Eulerian grid model. The embedded model tracks the sub-grid-scale process (e.g., elevated point-source emissions) until the fine-scale variability becomes unimportant (referred to as the “puff dumping” or “hand-over” point), at which point the grid model takes over the calculations for that process while the embedded model continues tracking sub-grid-scale processes.
While early PinG modeling efforts were focused on emissions from point sources and their impacts on ozone concentrations (e.g., Seigneur et al., Citation1983; Sillman et al., Citation1990; Kumar and Russell, Citation1996; Karamchandani et al., Citation2002; Vijayaraghavan et al., Citation2006), the technique is increasingly being applied in the United States and Europe for multipollutant issues and also for other source categories. The PinG treatment of Karamchandani et al. (Citation2002) in Version 4 of CMAQ was extended to fine particulate matter (Karamchandani et al., Citation2006) and mercury (Vijayaraghavan et al., Citation2008) from elevated point sources such as coal-fired power plants (CFPPs), as well as to simulate near-roadway concentrations of toxic pollutants (Karamchandani et al., Citation2009) and to estimate the export of reactive nitrogen from CFPPs (Vijayaraghavan et al., Citation2009). Yano et al. (Citation2010) coupled a sub-grid-scale plume model with an adaptive grid version of CMAQ to model the air quality impacts of biomass burning emissions. Korsakissok and Mallet (Citation2010a, Citation2010b) incorporated PinG treatment in the European Polyphemus air quality modeling system, and Briant and Seigneur (Citation2013) included a sub-grid-scale treatment of line sources to model roadway air quality impacts in Paris. Rissman et al. (Citation2013) recently applied the PinG model of Karamchandani et al. (Citation2010) to characterize the air quality impacts of aircraft emissions at the Hartsfield–Jackson Atlanta International Airport.
Components of a PinG Model
A PinG model consists of a grid model in which a plume model is embedded as an additional module to track sub-grid-scale features, such as point-source plumes. Thus, the two main components of a PinG model are the grid model, such as CMAQ or CAMx (ENVIRON, Citation2013), also referred to as the host model, and the plume component. As described by Karamchandani et al. (Citation2011), early attempts at PinG modeling used rather simple models for the plume component of the PinG model. There have been significant advances in reactive plume modeling since then. In the last decade, new plume models have been developed that address many of the deficiencies of earlier plume models used for PinG treatment and also include a detailed treatment of atmospheric chemistry. One such model is SCICHEM, a state-of-the science puff model that represents puff expansion using second-order closure with an advanced chemistry module that represents detailed chemical interactions between plume pollutants and the surrounding atmosphere (Karamchandani et al., Citation2000). SCICHEM was initially implemented (Electric Power Research Institute [EPRI], Citation1999) in the prototype to CMAQ, referred to as the Multiscale Air Quality Simulation Platform (MAQSIP; Odman and Ingram, Citation1996). It has since been implemented in various versions of CMAQ (e.g., Karamchandani et al. Citation2002; Citation2006), and recently in a coupled air quality and weather prediction model, WRF/Chem (Karamchandani et al., Citation2012).
PinG Version of CMAQ 5.01
As mentioned earlier, PinG versions of CMAQ have previously been developed by implementing SCICHEM into CMAQ (e.g., Karamchandani et al., Citation2002, Citation2006). These implementations, referred to as CMAQ-APT where APT stands for Advanced Plume Treatment, have used CMAQ 4.x as the host model with the last implementation based on CMAQ 4.6 (Karamchandani et al., Citation2010). The various versions of CMAQ-APT have been successfully applied to track the transport and chemistry of emissions from selected CFPPs (e.g., Karamchandani et al., Citation2002, Citation2006, Citation2010; Vijayaraghavan et al., Citation2006, Citation2008, Citation2009). But these PinG versions have typically lagged the core grid model by a year or more because development on these versions could not be initiated until the official CMAQ release. Thus, the PinG version of a particular CMAQ release often became obsolete quickly, because the next version of the core grid model was released at about the same time the PinG model became available. However, with version 5 of CMAQ, the EPA has facilitated community contributions to the model by providing early access to beta versions of the code to model developers about 6 months in advance of the model release date. The initial development of the PinG version of CMAQ 5, referred to as CMAQ 5-APT, relied upon this early access to the beta code, and differences between the beta and official versions of CMAQ 5 could be quickly incorporated in the PinG version once the official version became available. The PinG version described in this paper is based on CMAQ 5.01, officially released in July 2012, a few months after the initial release of CMAQ 5.0 in February 2012.
CMAQ 5 is considerably more modular than previous versions and incorporates a more flexible approach to manage model species. For the plume-in-grid version described here, the embedded plume model was modified to take advantage of this modularity and to integrate much more seamlessly with the host model than in previous versions of CMAQ-APT. These structural modifications make it easier to update the plume-in-grid version of CMAQ for future versions of CMAQ, since the plume model now directly uses the host model modules for chemical species specification, chemistry mechanisms, and aerosol properties. Emissions from point sources to be treated with PinG are also now directly read from the standard CMAQ point-source files first introduced in CMAQ 4.7.1, so CMAQ 4.7.1-ready emission inputs can be directly used in a CMAQ-APT application, provided the point sources to be modeled with the plume model are identified via the LPING flag. This flag is specified in the CMAQ 4.7.1 stack parameters file, and is ignored in a standard CMAQ application.
In addition to these structural modifications to the plume model, the chemistry components of the model were updated for consistency with CMAQ 5. The SCICHEM gas-phase chemistry mechanism was updated to the CB05 chemistry with the toluene chemistry updates of Whitten et al. (Citation2010), referred to as CB05-TU, and other updates as listed in the CMAQ 5 wiki page. The SCICHEM aerosol module was updated to the AERO6 module in CMAQ. The treatment of cloud chemistry in SCICHEM was also updated to that in CMAQ 5, with one important exception related to changes in the treatment of trace metals in CMAQ 5 and changes between this version and earlier versions in the calculation of iron and manganese trace metal catalyzed SO2 oxidation rates in clouds. These changes and their unrealistic impacts on near-source plume chemistry in clouds are discussed in the following paragraphs, as well as the corrections adopted for the cloud chemistry module in the plume model.
The AERO6 module in CMAQ adds nine new PM2.5 species, including trace metals such as iron and manganese. In previous versions of CMAQ, clean background concentrations of these trace metals were specified for the aqueous-phase chemistry calculations. The speciation of fine PM emissions into these trace elements and other PM2.5 species is based on the work of Reff et al. (Citation2009). However, this is one of the first attempts to speciate fine PM emissions into trace metal emissions in regional modeling inventories, and there are considerable uncertainties associated with the speciation profiles. Iron and manganese are found in dust emissions as well as in emissions from coal-fired power plants, such as the point sources selected for the plume-in-grid application described in the following section.
Iron and manganese play an important role in catalyzing the aqueous-phase oxidation of SO2 to sulfate by oxygen. The rate of this reaction depends on the concentrations of these trace metals, but is also pH dependent and inhibited at low pH (e.g., Ibusuki and Takeuchi, Citation1987). With this update for AERO6 in CMAQ 5, it is possible to get iron and manganese concentrations that are much higher than the clean background values used previously, particularly near sources emitting these trace metals. Thus, it is important to characterize the emissions of these species accurately. Furthermore, unless the rate expression also includes the controlling effect of pH, the higher iron and manganese concentrations can result in unrealistic rates of the catalyzed reaction as SO2 is converted to sulfate, and the cloud water becomes more acidic. Previous versions of CMAQ used a pH-dependent term for this reaction such that the reaction rate was suppressed at low pH, consistent with the work of Ibusuki and Takeuchi (Citation1987). In CMAQ 5, there is no pH dependency, and a single rate expression, based on Martin and Good (Citation1991), which is valid for a pH in the range of 3.0 to 5, is used.
This assumption of a pH-independent reaction rate is probably reasonable for a grid model, where pH values less than 3.0 are unlikely to be encountered frequently, even near a source, because the emissions are diluted over one or more grid cells. However, in a puff model, the puffs in the vicinity of a source have dimensions of the order of meters and the puff volumes are considerably lower than the grid cell volumes, resulting in puffs that have very high concentrations of the emitted species. Freshly emitted puffs from a coal-fired power plant will have significantly higher than background concentrations of acidic species and their precursors, such as SO2, sulfuric acid, and PM2.5 sulfate, as well as the trace metals that are also emitted from the plant. Since the Martin and Good (Citation1991) rate expression does not include a pH dependency, unrealistically high liquid-phase oxidation rates for SO2 in freshly emitted puffs were noted during the initial testing of the PinG version of CMAQ 5. Based on these findings, and after discussions with EPA scientists (G. Sarwar, personal communication, EPA Atmospheric Modeling and Analysis Division, 2012), the pH-dependent synergistic rate expression of Ibusuki and Takeuchi (Citation1987) was used in SCICHEM to control the rate of SO2 oxidation in fresh puffs encountering clouds. The Martin and Good (Citation1991) expression was retained in the grid model since CMAQ tests conducted by the EPA as a result of this discussion showed similar results from the two rate expressions for the range of pH encountered in CMAQ (G. Sarwar, personal communication, EPA Atmospheric Modeling and Analysis Division, 2012). Additionally, the inhibition of the oxidation rate by sulfate in solution, noted by Martin and Good (Citation1991), was included in both the grid and puff models, since the EPA indicated that it would adopt this correction in the next release of CMAQ (G. Sarwar, personal communication, EPA Atmospheric Modeling and Analysis Division, 2012).
In CMAQ-APT 5, the transfer of puff material to the three-dimensional (3-D) grid system is triggered when the horizontal dimensions of the puff are commensurate with the horizontal resolution of the grid. A mass-conserving puff sampling routine is used to distribute the puff material to all the grid cells in the horizontal and vertical directions that are impacted by the puff. The puff material is not distributed equally among the impacted grid cells, but according to a normal distribution that transfers most of the material to the grid cell that contains the puff centroid. Early versions of the model also included an option to use a chemical dumping criterion for fine grid applications where the physical criterion may result in premature transfer of the plume material to the grid (e.g., EPRI, Citation2001; Karamchandani et al., Citation2002). However, for typical PinG applications with grid resolutions of the order of tens of kilometers, the physical criterion is sufficient and is the default criterion in the model.
As shown in EPRI (Citation2001), puffs can travel several grid cells downwind before they grow to a size where they can be handed off to the host model. The actual travel distances will depend on the dispersive properties of the atmosphere in a particular application (i.e., the rate of growth of the puffs) and the grid resolution. In the case study shown in EPRI (Citation2001), where the grid resolution was 4 km, the mode of the distribution of puff mass transferred versus distance traveled was at 12 km, that is, 3 grid cells downwind, but a large number of puffs were also transferred at longer distances, up to 60 km or 15 grid cells downwind. Thus, the downwind distance at which the maximum number of puffs grew to a size of 4 km was about 12 km in the EPRI (Citation2001) study. If a coarser grid resolution of 12 km was used, as in this study (see following section), the corresponding downwind distance would be about 36 km, assuming a similar horizontal puff growth rate. However, puff growth rates typically become smaller at longer downwind distances, so it is likely that the mode of the distribution of transferred puffs would shift to longer downwind distances than 3 grid cells.
Mature puffs that are transferred to the grid system are destroyed after the transfer of material, while active puffs are carried in the puff model and the incremental concentrations in these puffs are saved at hourly intervals in a separate output file. A separate postprocessor reads the outputs of the PinG simulation, that is, the gridded CMAQ concentration file, and the corresponding variables in the SCICHEM puff file for active puffs (i.e., puffs not dumped to the host grid), to create a new gridded file that contains the combined (merged) concentrations. Similarly, the cumulative dry deposition and wet deposition of puff chemical species are also stored in separate output files, and a postprocessor combines the gridded deposition amounts from CMAQ with the puff deposition amounts to create new gridded deposition fields containing the combined values. A postprocessor is also available to output active puff concentrations at discrete receptor locations to calculate sub-grid-scale impacts near sources.
Model Applications
The evaluation and application of CMAQ-APT 5 were conducted for the first 15 days of a winter month (January) and a summer month (July) in 2005. The model was applied to the northeastern United States with a 12-km resolution. The left panel of shows the 12-km modeling domain as well as the 36-km continental United States (CONUS) domain that was used to provide the boundary conditions for the 12-km domain. Predictions from a global chemical transport model (GEOS-Chem) provided the boundary conditions for the 36-km CONUS domain. The right panel in shows the distribution of the 18 power plants selected for PinG treatment within the 12-km domain. Note that some of the 18 sources are close to each other and appear to overlap in the figure. These sources are the top NOx power plant emitters within the domain during the modeling period. The locations, source characteristics, and emissions from these 18 sources are provided in .
Figure 1. Modeling domains (left panel) for PinG simulations. The outer 36-km domain provides the boundary conditions for the inner 12 km domain used in the simulations. The right panel shows the locations of the point sources treated with PinG.
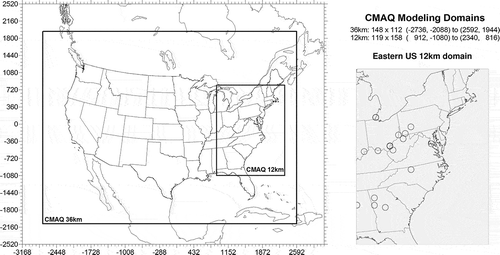
Table 1. Stack parameters and emissions from point sources selected for PinG treatment
The CMAQ model inputs for the applications described here were available from a previous modeling study and were derived from the CAMx modeling data sets for 2005 used by the EPA in developing the Transport Rule in 2010.
CMAQ-ready meteorology files for the 36-km and 12-km resolution domains were obtained by running the Meteorology–Chemistry Interface Processor (MCIP; Otte and Pleim, Citation2010) on the 2005 MM5 outputs provided in the EPA Transport Rule database. The 34 MM5 layers between surface and 100 mb (approximately 15 km) were mapped to 22 layers for the CMAQ modeling, keeping a finer resolution near the surface (40 m thick surface layer and 13 layers in the first kilometer). CMAQ-ready area source emission files for 2005 were obtained by converting the CAMx area source emission files provided in the EPA Transport Rule database. The database also included point-source emission files for 2005, as both CAMx- and CMAQ-ready files. The emissions inventory for these emission files is the EPA’s 2005-based, v4 platform. The emitted species in the available emission files were mapped to the CMAQ 5 species corresponding to the CB05 and AERO 6 gas-phase chemistry and aerosol modules. Similarly, CMAQ initial conditions (IC) and boundary conditions (BC) for the 36-km-resolution CONUS domain were obtained by mapping the species in the corresponding CAMx IC/BC files from the Transport Rule database to CMAQ 5 species. The CONUS CMAQ simulations provided the information necessary to prepare initial and boundary conditions for the 12-km resolution northeastern United States domain simulations.
The following simulations were conducted for the summer and winter periods:
A base CMAQ 5.01 simulation without PinG treatment for selected point sources.
A CMAQ-APT 5.01 simulation with PinG treatment for selected point sources.
A background CMAQ 5.01 simulation without selected point sources.
The background simulation provides a basis for estimating the non-PinG and PinG contributions of the selected point sources to downwind concentrations and deposition by subtracting the background results from the results of simulations (1) and (2), respectively.
Model performance evaluation
An operational model performance evaluation was performed in which CMAQ and CMAQ-APT estimates of ozone and total PM2.5 concentrations were compared with observed values. Total PM2.5 includes all the inorganic and organic primary and secondary aerosol components, such as sulfate, nitrate, ammonium, secondary organic aerosols (SOA), elemental carbon, primary organic aerosols, and so on. Ozone concentrations were compared for the summer period, and PM2.5 concentrations were compared for both summer and winter periods. The comparisons were performed for both the base and PinG configurations of CMAQ 5.01. Ozone observations for the summer period evaluation were obtained from the Air Quality System (AQS) monitoring network. PM2.5 observations from the Interagency Monitoring of Protected Visual Environments (IMPROVE) were used to evaluate model performance for fine particulate matter.
shows the model performance statistics for 1-hr average ozone concentrations for the summer period for both the base and PinG configurations of CMAQ 5.01. Although the EPA has revoked the 1-hr ozone standard, the calculation of model performance statistics for 1-hr ozone concentrations is still recommended (EPA, Citation2007). The statistical measures shown in are defined by the EPA (Citation2007). EPA modeling guidance also recommends using a cutoff value of 60 ppb for the observed hourly ozone mixing ratios to remove the influence of very low observed concentrations on the performance statistics. However, this cutoff results in a large number of data points being discarded in the evaluation. Other studies have investigated the use of 20 ppb and 40 ppb cutoff values in addition to the 60 ppb recommended value (e.g., Hogrefe et al., Citation2001; Baker, Citation2005; Tong and Mauzerall, Citation2006). shows the model performance statistics using both 40 and 60 ppb cutoffs on observed ozone mixing ratios. As shown in , the overall model performance statistics for 1-hr ozone mixing ratios are nearly identical for both model configurations. The performance for both configurations is better with the 40 ppb cutoff than with the 60 ppb cutoff, suggesting that the higher ozone mixing ratios are underpredicted in this application. Note that using a 60 ppb cutoff instead of a 40 ppb cutoff reduces the number of usable ozone observations by more than 70%.
Table 2. Model performance statistics for July 1 to 15, 2005, 1-hr average ozone mixing ratios, using 40 and 60 ppb cutoffs on observed ozone concentrations
The model performance statistics for PM2.5 concentrations are also nearly identical for the base and PinG configurations of CMAQ 5.01, as shown in . Summer PM2.5 concentrations are underestimated with both configurations, while winter PM2.5 concentrations are overestimated. These differences in model performance between summer and winter are generally consistent with other CMAQ modeling studies (e.g., Doraiswamy et al., Citation2010; Liu et al., Citation2010).
Table 3. Model performance statistics for January 1 to 15 and July 1 to 15, 2005, 24-hr average PM2.5 concentrations
The similarity in model performance with and without PinG treatment has been noted in previous PinG modeling studies with CMAQ (e.g., Karamchandani et al., Citation2002, Citation2006, Citation2010) and WRF/Chem (Karamchandani et al., Citation2012) and is not unexpected, given that monitoring stations may only sometimes be impacted by plumes from upwind point sources.
The difficulty in using aggregate model performance statistics at AQS and IMPROVE monitoring locations to distinguish between performance in the base and APT simulations has been noted in previous PinG studies (e.g., Karamchandani et al., Citation2002, Citation2006). In the study conducted by Karamchandani et al. (Citation2006), a performance evaluation for specific plume events was also conducted using special plume measurements from the Southeastern Aerosol Research and Characterization study (SEARCH) network. As described in Karamchandani et al. (Citation2006), the analysis took advantage of the sub-grid-scale information available in the PinG simulation to determine model estimates at discrete receptors within the grid cell containing the measurement location at about the same downwind distance from the power plant associated with the plume event as the distance to the monitoring location. An example of the sub-grid-scale variability is provided for the SEARCH North Birmingham, AL, monitoring location, during a plume event on July 30, 2002. Comparisons of observed versus modeled SO2 concentrations show that during the period when the plume impacts the monitoring location, the observed peak SO2 increment is about 19 ppb above the background. The grid model can only predict a single value of the SO2 increment, that is, the grid cell average value, which is less than 11 ppb, nearly a factor of 2 lower than the observed increment. On the other hand, the PinG approach predicts increments ranging from 0 to 19 ppb within the same grid cell, because it can resolve the concentration gradients within the grid cell. In general, the PinG approach provided a much better representation of many of these plume events at the various SEARCH monitoring sites than the base simulation. Although a similar analysis could not be performed in this study, the earlier results provide an indirect validation of the approach.
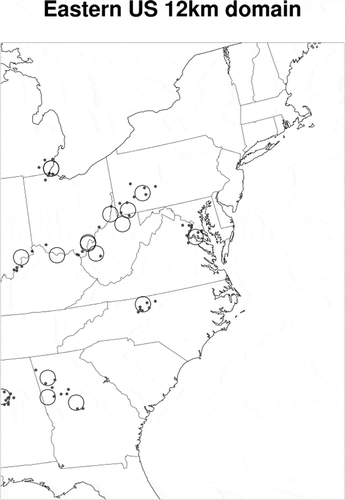
To determine whether differences in model performance could be distinguished by choosing a smaller subset of monitoring stations located near the point sources of interest, we repeated the performance evaluation for hourly ozone mixing ratios by selecting AQS monitoring locations within regions of 5 by 5 (60 km by 60 km) and 9 by 9 (108 km by 108 km) grid cells of the sources. These sub-regions were chosen to provide a reasonable number of AQS sites for the analysis. There are a total of 25 AQS sites within the former subregions (5 by 5 grid cells surrounding each source) and a total of 62 AQS sites within the 9 by 9 grid cell regions. As mentioned previously, the plume-to-grid transfer can occur up to several grid cells downwind, so the effects of the plume-in-grid treatment can be seen in the 5 by 5 region or even the 9 by 9 region, provided the AQS monitor is impacted by the plumes from the source. shows the AQS sites in the 9 by 9 grid cell regions included in the analysis. The subregional analysis was only conducted for hourly ozone mixing ratios. Although hourly PM2.5 measurements at AQS sites are also available for 2005, the measurements did not receive FRM approval until mid-2007 and were not accepted as 88101 (PM2.5 at local conditions) until January 2008 (http://www.epa.gov/ttn/airs/airsaqs/detaildata/downloadaqsdata.htm).
Figure 2. Locations of AQS stations within a 9 by 9 (108 km by 108 km) grid cell region around each PinG source.
The model performance statistics for these subsets of the AQS monitoring locations are shown in and for the 5 by 5 grid cell and 9 by 9 grid cell regions around each source, respectively. As can be seen from the tables, the two model configurations still show almost identical model performance. Time series of hourly ozone mixing ratios at these monitoring locations also show that the two model configurations give similar results with occasional small differences. presents these time series at two locations where there are some noticeable differences between the two configurations of the model for a small number of hours in the simulation period. The time series of observed hourly ozone mixing ratios are also shown in the figure for comparison purposes.
Table 4. Model performance statistics for July 1 to 15, 2005, 1-hr average ozone mixing ratios at AQS monitors within a 5 by 5 grid cell domain around each PinG point source, using 40 and 60 ppb cutoffs on observed ozone concentrations
Table 5. Model performance statistics for July 1 to 15, 2005, 1-hr average ozone mixing ratios at AQS monitors within a 9 by 9 grid cell domain around each PinG point source, using 40 and 60 ppb cutoffs on observed ozone concentrations
Figure 3. Time series of hourly surface ozone mixing ratios at two AQS monitoring sites in a 108 by 108 km region around PinG sources. The Morgantown, WV, site is about 23 km south of the nearest source, while the Holbrook, PA site is about 31 km west of the nearest source.
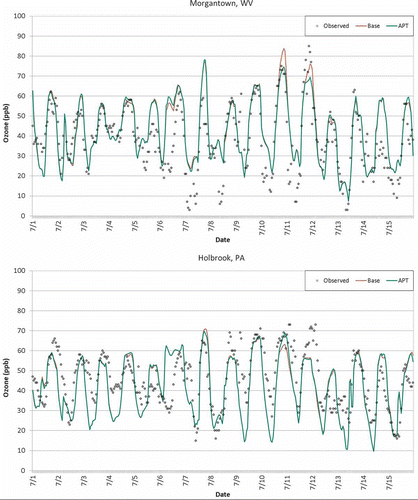
The top panel in shows the time series at an AQS monitoring location in Morgantown, WV, which is located about 23 km south of the nearest PinG source. We see that the predictions from the two models are generally identical at this location, except for some small differences between the two model configurations on July 4 and July 6, and larger differences on July 10 and July 11. On July 10, the peak predicted hourly ozone mixing ratio of 75 ppb from the APT configuration is the same as the observed peak, but the peak mixing ratio from the base configuration is about 84 ppb, 9 ppb higher than the APT and observed values. On the other hand, on July 11, there is better agreement between the observed peak (85 ppb) and the base configuration prediction (76 ppb), while the APT configuration value is lower than the base case value by about 7 ppb.
The bottom panel in shows the observed and predicted hourly ozone mixing ratio time series for a monitoring location in Holbrook, PA. This site is located about 31 km west of the nearest PinG source. As in the case of the Morgantown location, we see that, for the most part, the two model configurations predict identical mixing ratios. There are very small differences on a few days, such as July 4 and 7. The largest difference between the two model configurations is on July 10, when the predicted peak mixing ratio from the APT configuration (68 ppb) is very close to the observed peak (69 ppb), but the base configuration prediction (63 ppb) is about 5 and 6 ppb lower than the APT prediction and the measurement value, respectively.
The previous PinG modeling studies have also shown that predicted spatial patterns of pollutant concentrations and point-source impacts using the PinG approach can be significantly different from those predicted using the traditional gridded approach. In the following section, we look at these differences for the simulations conducted in this study.
Point-source impacts
The left and middle panels in shows the predicted contributions of the 18 CFPPs selected for PinG treatment to maximum daily 8-hr average surface ozone mixing ratios from the base CMAQ 5.01 and CMAQ-APT 5.01 simulations, respectively. The results are shown for the first model layer, centered at a height of approximately 20 m above ground level. The contributions are calculated by subtracting model results from the background simulation (without the PinG sources) from the results with the 18 sources included in the simulation. The right panel shows the differences between the APT and base simulation. Results are shown for the two days in July 2005 (July 11 and 12) for which the highest point-source contributions were predicted by either of the two CMAQ configurations. The locations of the 18 CFPPs selected for PinG treatment with CMAQ-APT are also shown in the various panels.
Figure 4. Predicted source contributions to maximum daily 8-hr average surface ozone mixing ratios (ppb) in the first model layer (center at about 20 m from ground level) from the base CMAQ (left panel) and CMAQ-APT (middle panel) and differences between the APT and base model predicted ozone concentrations (right panel) for July 11, 2005 (top panels), and July 12, 2005 (bottom panels). The circles in the plots represent the point sources selected for PinG treatment.
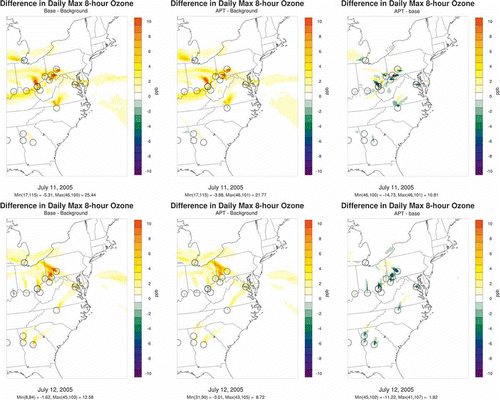
On July 11, the maximum 8-hr ozone contribution from the base configuration is more than 25 ppb, while the corresponding APT contribution is less than 22 ppb. While the ozone plumes from both simulations are comparable, the base configuration plumes are darker initially, suggesting that ozone production begins faster in the base simulation than in the APT simulation. In the APT simulation, initial ozone production near the sources is delayed or occurs at a slower rate than in the base simulation. At longer downwind distances, the PinG configuration forms slightly more ozone than the base model. The NOx emissions from the elevated source are transported aloft in the PinG simulation, and ozone production begins later downwind as the plume mixes with its surroundings.
The results from the plume-in-grid simulation are consistent with our understanding of the chemistry of NOx-rich plumes. It is well known (e.g., Richards et al., Citation1981; Gillani et al., Citation1998; Karamchandani et al., Citation1998, Citation2002; Karamchandani and Seigneur, Citation1999; Godowitch, Citation2004) that the rates of O3 formation and SO2 and NOx oxidation in NOx-rich plumes differ significantly from those in the background atmosphere during the initial stages of the plume because oxidant levels are suppressed in the plume. Karamchandani et al. (Citation1998) defined three stages for chemistry in NOx-rich plumes. In the first stage, the high nitric oxide (NO) concentrations in the plume lead to a depletion of oxidant levels until sufficient plume dilution has taken place. Therefore, in the vicinity of power plants and other elevated NOx sources, there is a decrease in O3 and other oxidant (e.g., OH) levels, even during daytime conditions, due to the titration of O3 by the high levels of NO in the near-field of the plume. In this stage, there is virtually no production of ozone or gas-phase formation of sulfate and nitrate from their precursors due to the depressed oxidant levels in the plume. Further downwind, in the second stage, the plume starts to mix into the background environment and becomes diluted; accordingly, radical concentrations within the plume start to increase and there is some formation of sulfate and nitrate, but the rates of SO2 and NOx oxidation are still lower than the background rates, because of depressed oxidant levels, and ozone production has still not begun. In the last stage, the plume has become sufficiently dispersed that its chemistry is similar to that of the ambient background, and the rates of sulfate and nitrate formation in the plume are comparable to the background rates and ozone production begins. These features of plume chemistry have been noted in helicopter observations of plumes downwind of power plants, such as the Cumberland power plant plume in northwestern Tennessee (Gillani et al., Citation1998), where ozone levels within the plume were below background levels for distances up to 60 to 80 km before there was production of ozone.
In contrast, in the base simulation, the NOx in the plume is rapidly mixed artificially, both horizontally and vertically. This artificial mixing in the base simulation results in quicker downwind photochemical production of ozone, depending on the VOC/NOx ratios downwind of the source.
The results for July 12 are qualitatively similar to those for July 11. The predicted maximum 8-hr ozone that can be attributed to one or more of the power plants is about 8.8 ppb in the PinG simulation, about 4 ppb lower than that predicted in the base simulation. Although the plume directions from the two simulations are comparable, the ozone plumes from the point sources are more intense initially in the base simulation than in the PinG simulation since more ozone is produced in the base simulation than in the PinG simulation near the sources, and slightly more ozone is produced further downwind in the PinG simulation than in the base simulation. As in the July 11 results, plume oxidation rates in the PinG simulation are suppressed initially and the NOx in the plume is transported aloft for longer distances than in the base simulation, resulting in lower ozone production near the sources and higher production further downwind.
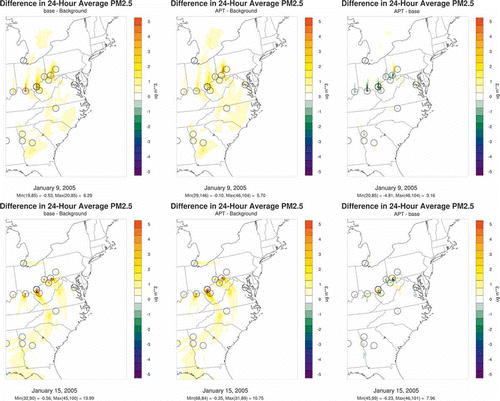
The differences between the two model configurations in their predictions of ozone concentrations downwind of the sources also explain the differences in their predicted PM2.5 and sulfur deposition contributions. The CFPP contributions to 24-hr average PM2.5 concentrations are shown in for two days in January 2005 with the highest predicted contributions during the 15-day period. On January 9, the maximum contribution predicted in the PinG simulation is about 10% lower than the contribution of 6.3 μg/m3 predicted in the base simulation. As in the case of the ozone results, we see lower PM2.5 contributions immediately downwind of the point sources in the PinG simulation as compared to the contributions predicted in the base simulation. Further downwind, the PinG simulation predicts slightly more CFPP contributions to PM2.5 than the base simulation. The results for January 12 are qualitatively similar. The highest CFPP contribution to 24-hr average PM2.5 concentrations is predicted on this day, with a 14-μg/m3 contribution predicted in the base simulation. The corresponding peak contribution from the APT simulation is less than 11 μg/m3, about 30% lower than the contribution from the base simulation.
Figure 5. Predicted source contributions to 24-hr average surface PM2.5 concentrations (μg/m3) in the first model layer (center at about 20 m from ground level) from the base CMAQ (left panel) and CMAQ-APT (middle panel) and differences between the APT and base model predicted PM2.5 concentrations (right panel) for January 9, 2005 (top panels), and January 15, 2005 (bottom panels). The circles in the plots represent the point sources selected for PinG treatment.
shows the CFPP contributions to 24-hr average PM2.5 concentrations for two days in July 2005 with the highest predicted contributions during the 15-day period. These two days are the same as the days with the highest ozone contributions discussed previously. From the top panels in , on July 11 we see generally lower PM2.5 contributions from the PinG simulation than from the base simulation, with small areas of slightly higher PM2.5 contributions. The maximum PM2.5 contribution predicted in the PinG simulation is about 30% lower than the predicted contribution (about 18 μg/m3) from the base simulation. The results for July 12, shown in the bottom panels in , are qualitatively similar.
Figure 6. Predicted source contributions to 24-hr average surface PM2.5 concentrations (μg/m3) in the first model layer (center at about 20 m from ground level) from the base CMAQ (left panel) and CMAQ-APT (middle panel) and differences between the APT and base model predicted PM2.5 concentrations (right panel) for July 11, 2005 (top panels), and July 12, 2005 (bottom panels). The circles in the plots represent the point sources selected for PinG treatment.
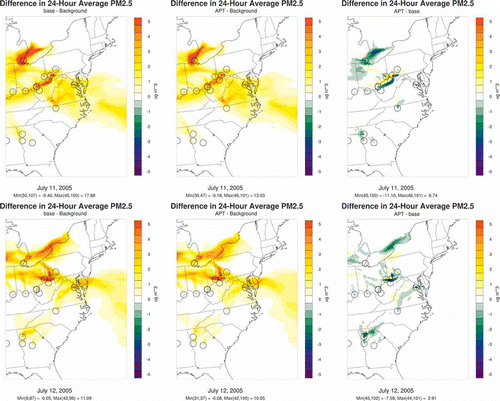
The differences between the APT and base simulations in their predictions of 24-hr average PM2.5 concentrations are more pronounced in summer than in winter. Secondary sulfate is a larger component of PM2.5 in summer than in winter, because of the reduced photochemical activity and lower oxidant levels in winter as compared to summer. As discussed previously, the levels of oxidants, such as the hydroxyl radical, are suppressed initially in an NOx-rich plume as the NOx in the plume scavenges the ozone. The oxidation of SO2 and NOx in the plume only occurs during the second and third stages of the plume, as the plume mixes with its background surroundings. This phenomenon is captured in the PinG simulation but not in the base simulation.
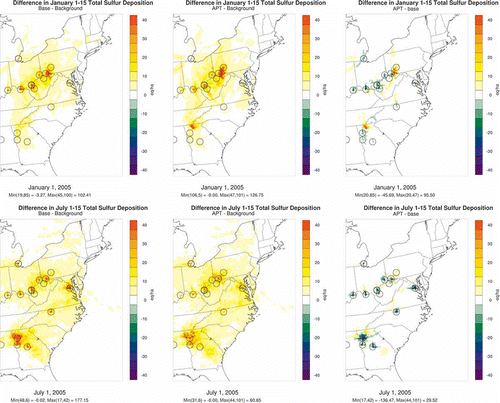
The contributions to total sulfur deposition during the 15-day winter and summer periods in July are shown in the top and bottom panels of , respectively. In both the summer and winter periods, the base simulation predicts higher total sulfur deposition than the PinG simulation in the immediate vicinity of the point sources, while higher deposition is predicted in the PinG simulation at longer downwind distances. However there are some important differences between the two seasons. In the winter period, the maximum contribution to total sulfur deposition predicted in the PinG simulation is about 127 eq/ha, while the maximum contribution in the base simulation is about 102 eq/ha. The maximum PinG contribution occurs about two grid cells downwind of the grid cell where the base model predicts the maximum contribution, suggesting that the maximum deposition contributions from both models are probably associated with the same source. In contrast, the maximum contribution to total sulfur deposition predicted in the PinG simulation during the summer period is nearly 66% lower than the predicted contribution from the base simulation and is associated with a cluster of sources about 800 km to the northeast of the source with the maximum contribution in the base simulation. This large difference is associated both with the sub-grid-scale treatment in the APT simulation and with the differences in the treatment of iron- and manganese-catalyzed oxidation of SO2 in clouds in the base grid model and the plume model, described earlier in this paper.
Figure 7. Predicted source contributions to 15-day total sulfur deposition (eq/ha) from the base CMAQ (left panel) and CMAQ-APT (middle panel) and differences between the APT and base model predicted total sulfur deposition (right panel) for January 2005 (top panels) and July 2005 (bottom panels). The circles in the plots represent the point sources selected for PinG treatment.
Summary
The capability to resolve point-source plumes has been added to the latest version of the EPA grid model, CMAQ 5, by incorporating a plume-in-grid (PinG) treatment in the model. After review by the EPA, the PinG model presented here is expected to be available as an option in the next interim release of CMAQ 5. The PinG capability provides one approach to address the inherent limitations of a traditional grid model in resolving sub-grid features, such as point-source plumes. The PinG treatment captures the observed features of the evolution of chemistry in NOx-rich plumes, such as the delayed formation of sulfate, nitrate, and ozone formation. The operational evaluation of the PinG model using data from routine monitoring networks shows comparable performance to the grid model. However, previous PinG modeling studies where plume measurements have been available for comparison have shown that plume events are captured better in the PinG approach than in the traditional grid approach (e.g., Karamchandani et al., Citation2006). Additional model applications where plume measurement data are available to validate the PinG approach will provide further confidence in the use of this approach. The PinG approach presented here addresses sub-grid-scale plumes and does not account for other sub-grid-scale features, such as sub-grid-scale meteorology. However, this is not an inherent limitation, since the approach could be adapted to make use of such information if available.
Although the results from the PinG model and grid model are generally comparable at the AQS monitoring sites, with the exception of differences of up to 7 to 9 ppb in ozone mixing ratios at a few monitors, the PinG treatment has a significant effect on predicted point-source contributions to ozone, PM2.5, and sulfur deposition at many locations near and downwind of the sources. The maximum 8-hr ozone contributions predicted by the two approaches differ by up to 4 ppb for the two days selected for analysis and tend to occur further downwind in the PinG simulation as compared to the base simulation. Similarly, maximum PM2.5 contributions from the PinG simulation are 3 μg/m3 to 5 μg/m3 lower than the maximum contributions from the base simulation, with smaller differences in winter as compared to summer. These differences between the base model and the PinG model in their predicted impacts are particularly important for source attribution studies, where the incremental impacts of a particular source, or a collection of sources, on existing air quality levels in a protected area are calculated.
Funding
Funding for the study described in this paper was provided by the Electric Power Research Institute (EPRI).
Acknowledgments
The authors gratefully acknowledge the early access provided by the EPA to the beta version of CMAQ 5, and the several useful discussions with EPA scientists from the Atmospheric Modeling and Analysis Division throughout the course of the study. The authors are also grateful to the anonymous reviewers for their valuable suggestions on improving the paper.
Additional information
Notes on contributors
Prakash Karamchandani
Prakash Karamchandani is a senior manager, Jeremiah Johnson is a senior associate, and Greg Yarwood is a principal at ENVIRON International, Novato, CA.
Jeremiah Johnson
Prakash Karamchandani is a senior manager, Jeremiah Johnson is a senior associate, and Greg Yarwood is a principal at ENVIRON International, Novato, CA.
Greg Yarwood
Prakash Karamchandani is a senior manager, Jeremiah Johnson is a senior associate, and Greg Yarwood is a principal at ENVIRON International, Novato, CA.
Eladio Knipping
Eladio Knipping is a senior technical manager at Electric Power Research Institute (EPRI).
References
- Baker, K. 2005. Regulatory modeling system performance in the Upper Midwest for 3 annual simulations at 36 km (PM2.5) and 3 summer seasons at 12 km (8-hr ozone). Paper presented at the 4th Annual CMAS Models-3 Users’ Conference, Chapel Hill, NC, September 26–28.
- Briant, R., and C. Seigneur. 2013. Multi-scale modeling of roadway air quality impacts: Development and evaluation of a Plume-in-Grid model. Atmos. Environ. 68: 162–73. doi:10.1016/j.atmosenv.2012.11.058
- Byun, D., and K.L. Schere, 2006. Review of the governing equations, computational algorithms, and other components of the Models-3 Community Multiscale Air Quality (CMAQ) modeling system. Appl. Mech. Rev. 59: 51–77. doi:10.1115/1.2128636
- Doraiswamy, P., C. Hogrefe, W. Hao, K. Civerolo, J.-Y. Ku, and G. Sistla. 2010. A retrospective comparison of model-based forecasted PM2.5 concentrations with measurements. J. Air Waste Manage. Assoc. 60: 1293–308. doi: 10.3155/1047-3289.60.11.1293
- ENVIRON. 2013. Comprehensive Air Quality Model with Extensions (CAMx) version 6.0 user’s guide. ENVIRON International Corporation, Novato, CA. http://www.camx.com/Files/CamxUsersGuide_v6-00.pdf (accessed August 2013).
- Electric Power Research Institute. 1999. SCICHEM: A new generation plume-in-grid model. EPRI report TR-113097. Electric Power Research Institute, Palo Alto, CA. http://www.epri.com/abstracts/Pages/ProductAbstract.aspx?ProductId=TR-113097 (accessed August 2013).
- Electric Power Research Institute. 2001. Further development and evaluation of Models-3/CMAQ-APT. EPRI report 1005161. Electric Power Research Institute, Palo Alto, CA. http://www.epri.com/abstracts/Pages/ProductAbstract.aspx?ProductId=000000000001005161 (accessed August 2013).
- Gillani, N.V., J.F. Meagher, R.J. Valente, R.E. Imhoff, R.L. Tanner, and M. Luria. 1998. Relative production of ozone and nitrates in urban and rural power plant plumes 1. Composite results based on data from 10 field measurement days, J. Geophys. Res. 103: 22593–615. doi:10.1029/98JD00966
- Godowitch, J. 2004. Simulations of aerosols and photochemical species with the CMAQ plume-in-grid modeling system. Paper presented at the 3rd Annual Models-3 User’s CMAS Conference, Chapel Hill, NC, October 18–20.
- Hogrefe, C., S.T. Rao, P. Kasibhatla, W. Hao, G. Sistla, R. Mathur, and J. McHenry. 2001. Evaluating the performance of regional-scale photochemical modeling systems: Part II—Ozone predictions. Atmos. Environ. 35: 4175–88.
- Ibusuki, T., and K. Takeuchi. 1987. Sulfur dioxide oxidation by oxygen catalyzed by mixtures of manganese(II) and iron(III) in aqueous solutions at environmental reaction conditions. Atmos. Environ. 21: 1555–60.
- Karamchandani, P., A. Koo, and C. Seigneur. 1998. Reduced gas-phase kinetic mechanism for atmospheric plume chemistry, Environ. Sci. Technol. 32: 1709–20. doi:10.1021/es970707u
- Karamchandani, P., and C. Seigneur. 1999. Simulation of sulfate and nitrate chemistry in power plant plumes, J. Air Waste Manage. Assoc. 49: 175–181. doi: 10.1080/10473289.1999.10463885
- Karamchandani, P., L. Santos, I. Sykes, Y. Zhang, C. Tonne, and C. Seigneur. 2000. Development and evaluation of a state-of-the-science reactive plume model. Environ. Sci. Technol. 34: 870–80. doi:10.1021/es990611v
- Karamchandani, P., C. Seigneur, K. Vijayaraghavan, and S.-Y. Wu. 2002. Development and application of a state-of-the-science plume-in-grid model. J. Geophys. Res. 107:4403. doi:10.1029/2002JD002123
- Karamchandani, P., K. Vijayaraghavan, S.-Y. Chen, C. Seigneur, and E.S. Edgerton. 2006. Plume-in-grid modeling for particulate matter. Atmos. Environ. 40: 7280–97. doi:10.1016/j.atmosenv.2006.06.033
- Karamchandani, P., K. Lohman, and C. Seigneur. 2009. Using a sub-grid scale modeling approach to simulate the transport and fate of toxic air pollutants. Environ. Fluid Mech. 9: 59–71. doi:10.1007/s10652-008-9097-0
- Karamchandani, P., K. Vijayaraghavan, S.-Y. Chen, R. Balmori-Bronson, and E.M. Knipping. 2010. Development and application of a parallelized version of the advanced modeling system for transport, emissions, reactions and deposition of atmospheric matter (AMSTERDAM): 1. Model performance evaluation and impacts of plume–in–grid treatment. Atmos. Pollut. Res. 1: 260–70.
- Karamchandani, P., K. Vijayaraghavan, and G. Yarwood. 2011. Sub-grid scale plume modeling. Atmosphere 2: 389–406. doi:10.3390/atmos2030389
- Karamchandani, P., Y. Zhang, and S.-Y. Chen. 2012. Development and initial application of a sub-grid scale plume treatment in a state-of-the-art online multi-scale air quality and weather prediction Model. Atmos. Environ. 63: 125–34. doi:10.1016/j.atmosenv.2012.09.014
- Korsakissok, I., and V. Mallet. 2010a. Subgrid-scale treatment for major point sources in an Eulerian model: A sensitivity study on the European Tracer Experiment (ETEX) and Chernobyl cases. J. Geophys. Res. 115: D03303. doi:10.1029/2009JD012734
- Korsakissok, I., and V. Mallet. 2010b. Development and application of a reactive plume-in-grid model: evaluation over Greater Paris. Atmos. Chem. Phys. 10: 8917–31. doi:10.5194/acp-10-8917-2010
- Kumar, N., and A.G. Russell. 1996. Development of a computationally efficient, reactive subgrid-scale plume model and the impact in the northeastern United States using increasing levels of chemical detail. J. Geophys. Res. 101: 16737–44. doi:10.1029/96JD01372
- Liu, X.-H., Y. Zhang, K.M. Olsen, W.-X. Wang, B.A. Do, and G.M. Bridgers. 2010. Responses of future air quality to emission controls over North Carolina, Part I: Model evaluation for current-year simulations. Atmos. Environ. 44: 2443–56. doi:10.1016/j.atmosenv.2010.04.002
- Martin, L.R., and T.W. Good. 1991. Catalyzed oxidation of sulfur dioxide in solution: The iron–manganese synergism. Atmos. Environ. Part A General Topics 25: 2395–99. doi:10.1016/0960-1686(91)90113-L
- Odman, M.T. and C.L. Ingram. 1996. Multiscale Air Quality Simulation Platform (MAQSIP): Source Code Documentation and Validation. MCNC Report ENV-96TR002-v1.0, MCNC, RTP, NC. http://people.ce.gatech.edu/odman/maqsip.pdf (accessed August 2013).
- Otte, T.L., and J.E. Pleim. 2010. The Meteorology–Chemistry Interface Processor (MCIP) for the CMAQ modeling system: Updates through MCIPv3.4.1. Geosci. Model Dev. 3: 243–56. doi:10.5194/gmd-3-243-2010.
- Reff, A., P.V. Bhave, H. Simon, T.G. Pace, G.A. Pouliot, J.D. Mobley, and M. Houyoux. 2009. Emissions inventory of PM2.5 trace elements across the United States, Environ. Sci. Technol. 43: 5790–96. doi:10.1021/es802930x
- Richards, L.W., J.A. Anderson, D.L. Blumenthal, A.A. Brandt, J.A. McDonald, N. Waters, E.S. Macias, and P.S. Bhardwaja. 1981. The chemistry, aerosol physics, and optical properties of a western coal-fired power plant plume, Atmos. Environ. 15: 2111–34.
- Rissman, J., S. Arunachalam, M. Woody, J.J. West, T. BenDor, and F.S. Binkowski. 2013. A plume-in-grid approach to characterize air quality impacts of aircraft emissions at the Hartsfield-Jackson Atlanta International Airport. Atmos. Chem. Phys. Discuss. 13: 1089–132. doi:10.5194/acpd-13-1089-2013
- Seigneur, C., T.W. Tesche, P.M. Roth, and M.-K. Liu. 1983. On the treatment of point source emissions in urban air quality modeling. Atmos. Environ. 17: 1655–76.
- Sillman, S., J.A. Logan, and S.C. Wofsy. 1990. A regional scale model for ozone in the United States with subgrid representation of urban and power plant plumes. J. Geophys. Res. 95: 5731–48. doi:10.1029/JD095iD05p05731
- Tong, D.Q., and D.L. Mauzerall. 2006. Spatial variability of summertime tropospheric ozone over the continental United States: Implications of an evaluation of the CMAQ model. Atmos. Environ. 40: 3041–56. doi:10.1016/j.atmosenv.2005.11.058
- U.S. Environmental Protection Agency. 2007. Guidance on the use of models and other analyses for demonstrating attainment of air quality goals for ozone, PM2.5, and regional haze. Final report, EPA-454/B-07-002, April. U.S. Environmental Protection Agency, Office of Air and Radiation/Office of Air Quality Planning and Standards, Research Triangle Park, NC. http://www.epa.gov/scram001/guidance/guide/final-03-pm-rh-guidance.pdf (accessed August 2013)).
- Vijayaraghavan, K., P. Karamchandani, and C. Seigneur. 2006. Plume-in-grid modeling of summer air pollution in Central California. Atmos. Environ. 40: 5097–109. doi:10.1016/j.atmosenv.2005.12.050
- Vijayaraghavan, K., P. Karamchandani, C. Seigneur, R. Balmori, and S.-Y. Chen. 2008. Plume-in-grid modeling of atmospheric mercury. J. Geophys. Res. 113: D24305. doi:10.1029/2008JD010580
- Vijayaraghavan, K., Y. Zhang, C. Seigneur, P. Karamchandani, and H.E. Snell. 2009. Export of reactive nitrogen from coal-fired power plants in the U.S.: Estimates from a plume-in-grid modeling study. J. Geophys. Res. 114: D04308. doi:10.1029/2008JD010432
- Whitten, G.Z., G. Heo, Y. Kimura, E. McDonald-Buller, D.T. Allen, W.P.L. Carter, and G. Yarwood. 2010. A new condensed toluene mechanism for Carbon Bond: CB05-TU. Atmos. Environ. 44: 5346–55. doi:10.1016/j.atmosenv.2009.12.029
- Yano, A., F. Garcia-Menendez, Y. Hu, M.T. Odman, D.S. McRae, and G.L. Achtemeier. 2010. Modeling biomass burnings by coupling a sub-grid scale plume model with adaptive grid CMAQ. Paper presented at the 9th Annual CMAS Conference, Chapel Hill, NC, October 11–13.