
Abstract
On-road vehicle emissions of carbon monoxide (CO), nitrogen oxides (NOx), and volatile organic compounds (VOCs) during 1995–2009 in the Atlanta Metropolitan Statistical Area were estimated using the Motor Vehicle Emission Simulator (MOVES) model and data from the National Emissions Inventories and the State of Georgia. Statistically significant downward trends (computed using the nonparametric Theil-Sen method) in annual on-road CO, NOx, and VOC emissions of 6.1%, 3.3%, and 6.0% per year, respectively, are noted during the 1995–2009 period despite an increase in total vehicle distance traveled. The CO and NOx emission trends are correlated with statistically significant downward trends in ambient air concentrations of CO and NOx in Atlanta ranging from 8.0% to 11.8% per year and from 5.8% to 8.7% per year, respectively, during similar time periods. Weather-adjusted summertime ozone concentrations in Atlanta exhibited a statistically significant declining trend of 2.3% per year during 2001–2009. Although this trend coexists with the declining trends in on-road NOx, VOC, and CO emissions, identifying the cause of the downward trend in ozone is complicated by reductions in multiple precursors from different source sectors.
Implications:
Large reductions in on-road vehicle emissions of CO and NOx in Atlanta from the late 1990s to 2009, despite an increase in total vehicle distance traveled, contributed to a significant improvement in air quality through decreases in ambient air concentrations of CO and NOx during this time period. Emissions reductions in motor vehicles and other source sectors resulted in these improvements and the observed declining trend in ozone concentrations over the past decade. Although these historical trends cannot be extrapolated to the future because pollutant concentration contributions due to on-road vehicle emissions will likely become an increasingly smaller fraction of the atmospheric total, they provide an indication of the benefits of past control measures.
Introduction
On-road vehicle emissions contribute to deterioration in ambient air quality, particularly in urban areas. Oxides of nitrogen (NOx) and volatile organic compounds (VOCs) emitted by vehicles are precursors to the photochemical formation of ozone (O3) and particulate matter (PM). NOx is also a contributor to acidic deposition. Additionally, NOx and carbon monoxide (CO) from on-road mobile sources can cause respiratory problems and have other harmful health effects. Large reductions in motor vehicle emissions have been achieved in the United States over the past four decades through regulations and voluntary measures taken by the automobile industry. For example, from 1970 to 2005, nationwide highway vehicle emissions of VOCs decreased by approximately 75% and emissions of PM and NOx decreased by over 50% though the total vehicles miles traveled (VMT) for highway vehicles increased more than 2-fold (Kryak et al., Citation2010).
It is of interest to determine whether there have been statistically significant reductions in urban on-road emissions in the recent past (here, over an approximate 10–15-yr period) and whether such reductions, if present, are associated with statistically significant reductions in atmospheric pollutant concentrations. We focus on the Atlanta Metropolitan Statistical Area (MSA) where on-road emissions constitute a large fraction of the total emissions inventory. Also, substantial improvements in air quality have been achieved in Atlanta, as indicated by the recent proposal by the U.S. Environmental Protection Agency (EPA) to approve the State of Georgia’s request to redesignate 20 counties in metropolitan Atlanta as meeting the federal 8-hr O3 standard of 75 ppb based on monitoring between 2008 and 2010; these counties had been in nonattainment since 1997.
There is a wealth of scientific literature on temporal trends in emissions from mobile and other sources and trends in air quality in the United States (e.g., Bloomer et al., Citation2009; Fujita et al., Citation2013; Gego et al., Citation2007; Parrish et al., Citation2002; EPA, 2012a) and in the southeastern United States in particular (e.g., Blanchard et al., Citation2010a, Citation2010b, 2010c, Citation2013a, Citation2013b). All of these studies use mobile source emission data from the National Emissions Inventory (NEI) (EPA, 2012b) for trends analyses. The NEI emission estimates are made by the EPA at 3-yr intervals, with frequent revision of the estimation procedures in each new version and additional revisions between versions, especially for the on-road inventory. Moreover, the NEI on-road sector emission data through 2005 were calculated using emission factors from the MOBILE6 (Mobile Source Emission Factor Model) vehicle emissions model, which has since been superseded by the Motor Vehicle Emission Simulator (MOVES) model, whereas the 2008 NEI on-road inventory was developed using MOVES. Large differences may arise in vehicle emissions calculated with MOBILE6 and MOVES as noted earlier (e.g., EPA, 2009a; Air Improvement Resource et al., 2010; Fujita et al., Citation2012) and discussed below. Hence, it is useful to examine trends in historical on-road emissions inventories that are developed in a consistent manner across years with the more current MOVES model.
This paper investigates the presence of statistically significant trends in on-road vehicle emissions of CO, NOx, and VOCs modeled using MOVES and observed ambient air concentrations of CO, NOx, and O3 in Atlanta for part or all of the period between 1995 and 2009. 1995 and 2009 were chosen as the start and end years because data were available at most of the stations studied in this analysis during this time period.
Data and Methods
On-road vehicle emissions
On-road emissions were estimated for the 20 counties constituting the Atlanta Metropolitan Statistical Area (MSA) () in January (representing winter) and July (representing summer) of 1995 through 2009 for CO, NOx, and VOCs. The emissions were calculated by multiplying emission factors from version 2010a of MOVES with vehicle-miles traveled (VMT) activity submitted by the state of Georgia for the NEI. NEI data that were used in the calculations include county-level annual VMT by road and vehicle type and county-level fleet descriptions of vehicle age distribution, fuel formulations, and inspection and maintenance (I/M) programs. NEI data were obtained for 1999, 2002, 2005, and 2008. The fleet descriptions in the NEI data, which were in MOBILE6 input format, were converted for MOVES compatibility following technical guidance from the EPA (Citation2010).
Figure 1. Atlanta metropolitan statistical area with counties, major highways, and monitoring stations studied (monitors: filled triangle, AQS CO station ROS; filled star, AQS NOx station GT; open star, AQS NOx station TUC; open square, SEARCH CO and NOx station JST).
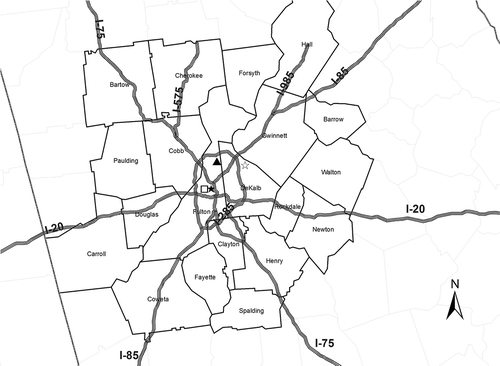
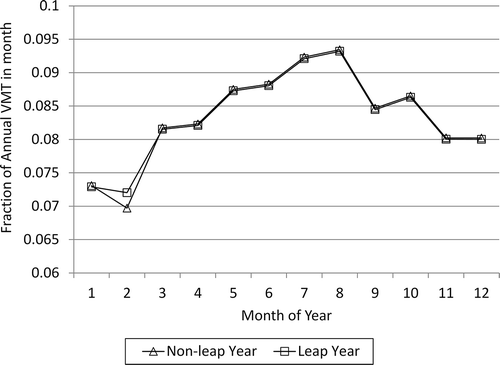
Following standard practice, MOVES was run for representative counties, four in this case: Barrow, Cherokee, Cobb, and Hall, representing the 20 “inventory” counties in the Atlanta MSA. Each inventory county’s VMT was multiplied by the corresponding representative county’s emission factors (by pollutant, year, and season). Annual VMT from the NEI was apportioned to a typical summer and a typical winter month following MOVES default distributions of monthly VMT (), which account for higher driving on a typical summer day than winter day.
Figure 2. MOVES fraction of annual total VMT in each month of the year.
Because NEI data are only available for 4 yr of the 15 yr of interest, we used the data and methods listed in to estimate the inventory in other years (pre-1999, between NEI years 1999/2002/2005/2008, and post-2008). The MOVES model was run for a January and a July month in each of the 15 calendar years except for the 6 yr between NEI years.
Table 1. Summary of on-road inventory development methods by year
Emissions were determined for years between the NEI years by linear interpolation of the two closest NEI years’ MOVES emissions. Outside the NEI range of data availability (i.e., pre-1999 and post-2008), the closest year’s emission factor model inputs for MOVES were used (e.g., a 1995 MOVES run with 1999 fleet descriptions) because those inputs represent the best available understanding of the local vehicle fleets for the historical year. VMT before 1999 and after 2008 was estimated by scaling either 1999 or 2008 VMT to each year. The VMT scaling factors were developed from an analysis of Traffic Volume Trends (TVT) (U.S. Department of Transportation [U.S. DOT], Citation2012). The TVT is a monthly report of hourly traffic count data reported by Georgia to the Federal Highway Administration (FHWA). The seasonal VMT for 1995–1998 and 2009 were estimated as shown in eqs 1 and 2.
Ambient air quality
The annual second highest 8-hr average concentrations (the form of the National Ambient Air Quality Standard [NAAQS]) of CO reported by the EPA were obtained at stations in the Atlanta MSA area (EPA, 2013a). One out of six monitoring stations in the Atlanta MSA has data over at least a 10-yr period (in this case, from 1995 to 2009) and was selected for analysis. This station, Roswell Road (ROS), is in Fulton County and is near a major highway (). In addition, ambient hourly CO concentration data during 1999–2009 at the Jefferson Street (JST) station () in Atlanta in the Southeast Aerosol Research and Characterization (SEARCH) Network were obtained from the SEARCH public archives (Atmospheric Research and Analysis, Citation2012) and processed to determine the annual second highest 8-hr average CO concentrations.
Although NO2 (and not NOx) is a criteria pollutant like CO, it is more appropriate to consider NOx concentrations when examining the relationship between emissions and air quality because reductions in NO emissions may not translate to reductions in concentrations of NO2, particularly, in cases where O3 availability is the limiting factor. Annual average NOx concentration data were obtained from EPA’s Air Quality System (AQS) Data Mart at two monitoring sites in the Atlanta MSA area (EPA, Citation2013b), one (Georgia Tech, GT) in Fulton County with data from 1998–2009 and the second (Tucker, TUC) in DeKalb County with data from 1995–2009 (). In addition, annual average NOx concentrations at the SEARCH JST station were calculated from hourly observations of NO and NO2 during 1998–2009.
Weather-adjusted O3 data for Atlanta averaged for May–September reported by the EPA (Citation2013c) were obtained for each year from 2001 to 2010. The EPA uses a statistical model to account for the weather-related variability of seasonal O3 concentrations (Camalier et al., Citation2007) because variations in meteorological conditions have a strong influence on O3 formation and accumulation and need to be considered when examining trends. For example, below average temperatures and above average humidity typically contribute to less O3 formation, whereas above average temperatures and below average humidity usually contribute to increased O3 formation; the weather adjustment by the EPA compensates for these effects facilitating determination of meteorologically adjusted O3 trends. The data obtained for Atlanta represent an average across the MSA.
Statistical methods for trends analysis
Statistical trends in the emissions and concentrations listed above were computed using the Theil-Sen (TS) method (Sen, Citation1968), which builds upon the method of Theil (1950). The TS method was coupled with a bootstrapping approach (described below) to estimate confidence levels to determine the statistical significance of the trends. The method is nonparametric so the underlying data (of concentrations and emissions) may follow any distribution. The method is also robust and not sensitive to outliers due to instrument error or anomalous conditions. Statistical analyses were performed using the R software (The R Project, 2012).
The nonparametric 95% confidence intervals (CIs) were calculated with a bootstrap method to determine if the TS trend slopes were statistically significant. The method used is a computationally intensive resampling procedure (Efron, Citation1979; Willmott et al., Citation1985; EPA, Citation2009b). Approximately 2000 data pairs consisting of year and concentration or emission values representing the original time series were chosen by random selection with replacement and the TS trend slope calculated for each replicate. The 2000 bootstrap pairwise slopes thus calculated were used to establish the 95% CIs on each distribution and determine if the TS trend was statistically significant with 95% confidence.
The Spearman’s rank correlation coefficient (Spearman, Citation1904) was calculated to describe the association between the trends in ambient air concentrations and on-road emissions of CO; a similar calculation was done for NOx. The Spearman’s coefficient is a nonparametric measure of statistical dependence between two variables (here concentrations and emissions) based on the ranks of the data values of the variables. The coefficient is a value between −1 and 1, indicating the direction and strength of the correlation, with a value closer to −1 or 1 indicating a stronger correlation. The P value associated with the Spearman’s correlation indicates the significance level of the correlation test; a P value less than 0.05 is considered statistically significant in this study. In the case of O3, a secondary pollutant, visual inspections were made of concentration trends and trends in precursor emissions.
provides a summary of the concentration and emission data examined to identify either statistical association or qualitative similarity. The time periods for analysis were chosen for consistency between the concentration and emission data. For example, trends in on-road CO emissions were analyzed for 1995–2009 and 1999–2009 for comparison with CO concentration trends at two sites and for 2001–2009 for comparison with O3 concentration trends.
Table 2. Overview of concentration and emission data in trend analyses
Results and Discussion
Trends in on-road emissions
The modeled Atlanta 20-county winter and summer emissions (in short tons per day, TPD) and the corresponding VMT activity are shown in . Results for NEI years are shown shaded.
Table 3. Atlanta MOVES-based on-road emissions in January and July 1995–2009
Although vehicle mileage is consistently lower in winter than summer, winter emissions exceed those in summer in all years for VOCs and CO and in most years for NOx. The MOVES model applies adjustments to NOx, VOC, and CO start exhaust, with larger increases in colder weather. For both seasons and all pollutants, emissions show a net decrease across years despite increasing VMT. During 1995–2009, NOx emissions were reduced by approximately 40% in the Atlanta MSA, VOC emissions by 54%, and CO emissions by approximately 60%, whereas VMT grew by 18%. Fleet wide emissions tend to decrease over time because MOVES fleet-wide emission factors decrease as older, high-emitting vehicles retire and modern vehicles meeting more stringent emission standards such as the Federal Tier 2 standard penetrate the fleet (for example, see Table S1.1 of Vijayaraghavan et al., Citation2012). EPA’s Regulatory Impact Analysis (RIA) for the Tier 2 Rule (EPA, Citation1999) demonstrated that increasingly large reductions in on-road VOC and NOx emissions are expected as Tier 2–compliant vehicles phase into the national fleet. For example, the Tier 2 NOx emissions standard is lower than the Tier 1 standard by an order of magnitude (). Also, Tier 2–compliant light-duty vehicles (LDVs) make up an increasingly large portion of the fleet each year after 2004. shows the fraction of nationwide LDVs that meet Tier 2 or pre-Tier 2 emission standards during selected years in the span of our study. Measures in the Atlanta Transportation Improvement Program (TIP) approved by the Georgia Regional Transportation Authority (GRTA) also likely helped contain the VMT growth and associated emissions increases in the Atlanta MSA (http://www.grta.org/tip/TIP_Fact_Sheet.pdf).
Table 4. NOx emission standards for Tier 2* and pre-Tier 2** (National Low Emission Vehicle program and Tier 1)
Table 5. Relative fraction of the nationwide light-duty vehicle fleet that complies with Tier 2 emission standards in 1995, 2005, and 2010
On-road emissions modeled with MOVES in the Atlanta MSA are considerably different than when modeled with MOBILE6. For example, during the NEI years (), on-road NOx emissions in Fulton County (one of the largest counties in the MSA in terms of vehicle emissions) are 57–81% higher with MOVES than MOBILE6. VOC and CO emissions are 16–22% and 24–49% higher, respectively, with MOVES. Prior studies have modeled higher emissions from MOVES than MOBILE6. The EPA (Citation2009a) estimated 25–50% higher NOx emissions with MOVES than MOBILE6 in Atlanta, Chicago, and Salt Lake City in 2008. Air Improvement Resource et al. (Citation2010) obtained higher emission rates of hydrocarbon (HC), CO, and NOx from MOVES than MOBILE6 in 2008 in Atlanta. They attribute the reasons for higher exhaust HC, CO, and NOx emissions from light-duty vehicles to the log-linear emissions versus age model for deterioration in MOVES along with high vehicle-specific power (VSP) correction factors. For heavy-duty vehicle HC, CO, and NOx, the increases in emissions are due mainly to the addition of the extended idle operation and tampering and maintenance factors in MOVES.
Table 6. Annual average on-road emissions in Fulton County estimated from MOBILE6 and MOVES
Calculated statistical trends in Atlanta on-road emissions of NOx, VOCs, and CO during 1995–2009 are shown in through 5. The dashed lines in each figure represent the TS slope regression lines. The TS slope is reported as a percent change per year after normalization by the median of the emission data. The sign of the TS slope indicates the direction of the trend. The null hypothesis is that there is no monotonic trend in the data. If the 95% CI does not cross zero, the null hypothesis is rejected and the data display a statistically significant upward or downward trend. The observed trend is not statistically significant if the 95% CI crosses zero.
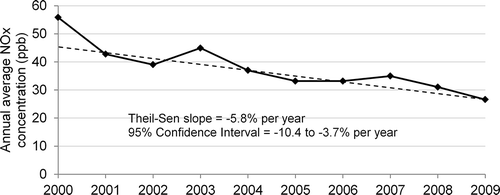
Figure 3. Trend in annual NOx on-road emissions in Atlanta during 1995–2009.
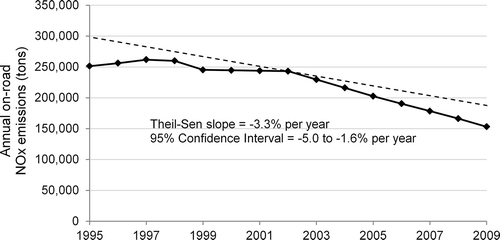
Figure 4. Trend in annual VOC on-road emissions in Atlanta during 1995–2009.
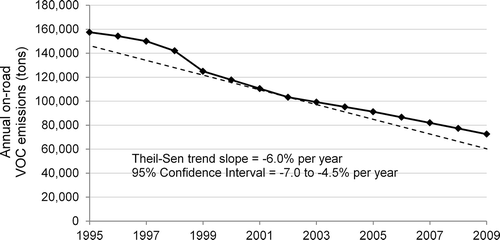
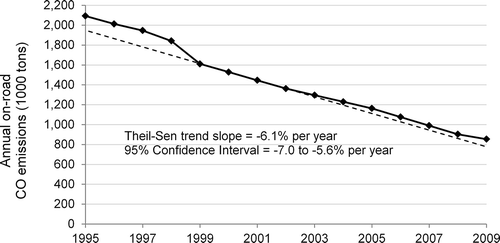
Figure 5. Trend in annual CO on-road emissions in Atlanta during 1995–2009.
The null hypothesis is rejected in the case of all three pollutants. On-road NOx emissions in Atlanta exhibit a statistically significant declining trend during 1995–2009. So do on-road emissions of VOCs and CO. CO exhibits the strongest decline among these three pollutants during this 15-yr period. Unlike CO and VOCs, NOx emissions exhibit an increase from 1995 to 1997 and 1999 to 2002. NOx emission factors (i.e., g/mile) were relatively stable during 1995–2002. So, the increase in VMT over that time period resulted in an increase in NOx emissions. NOx emission factors decreased sharply with the MOVES model run for years 2005 and 2008 due to the introduction of federal emission standards in 2004 for light-duty vehicles and 2007 for heavy-duty vehicles. The reduction in NOx emission factors during 2002–2009 more than compensated for the VMT increase over same period; hence, NOx emissions decrease post-2002.
Trends in air quality and relationship with emission trends
Trends in annual average NOx concentrations were calculated at the AQS monitoring locations in Fulton County (GT) () and DeKalb County (TUC) () and the SEARCH monitoring location in Fulton County (JST) (). The differing time periods shown reflect the earliest year when data were available at each site. The TS slope is normalized with respect to the median of the concentration data. The 95% CI does not cross zero and a statistically significant downward trend is present at all three locations (−8.7% per year at GT during 1998–2009, −3.9% per year at TUC during 1995–2009, and −5.8% per year at JST during 2000–2009). Over the 2000–2009 time period, the rate of decline is most prominent at the GT location (−9.0% per year versus −7.6% per year at TUC and −5.8% per year at JST). The GT site is near a major freeway (I75-I85; ) and hence is likely most influenced by the long-term reductions in on-road NOx emissions discussed above.
Figure 6. Trend in annual average NOx concentrations at the AQS site GT during 1998–2009.
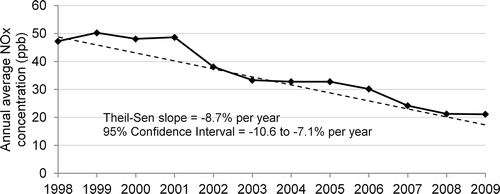
Figure 7. Trend in annual average NOx concentrations at the AQS site TUC during 1995–2009.
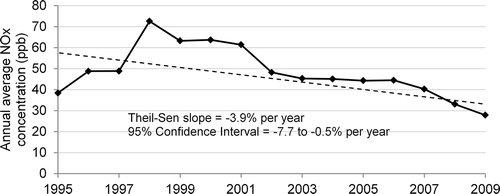
Figure 8. Trend in annual average NOx concentrations at the SEARCH site JST during 2000–2009.
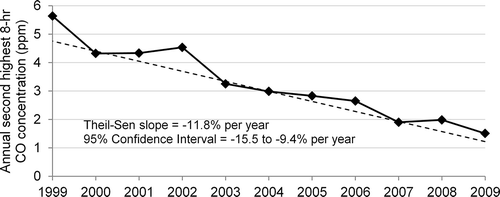
Statistically significant declines in measured CO concentrations occurred from the mid- to late-1990s to 2009 at the two CO monitoring sites (ROS and JST; and ). Blanchard et al. (Citation2013b) report a decline in annual average CO concentrations of 7.2% per year over 1999–2010 at the JST site. The current study finds a decline in the annual second highest 8-hr average concentrations of 11.8% per year over a comparable period at the same location, indicating that the peak concentrations responded faster to historical emission reductions than the average concentration. It is noteworthy that CO design values in downtown Atlanta have been well below the 8-hr NAAQS of 9 ppm from at least 1999 and have decreased by over 70% during the subsequent decade, demonstrating significant improvements in air quality due, in part, to vehicle emission reductions.
Figure 9. Trend in annual second highest 8-hr average CO concentrations at the AQS site ROS during 1995–2009.
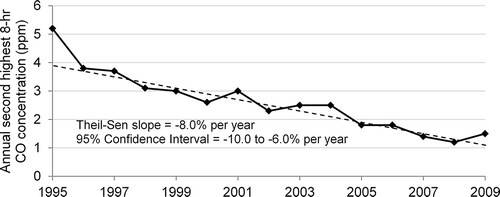
Figure 10. Trend in annual second highest 8-hr average CO concentrations at the SEARCH site JST during 1999–2009.
The Spearman’s rank correlations between the annual Atlanta MSA on-road CO emissions and the annual second highest 8-hr average concentrations of CO and between the annual MSA on-road NOx emissions and the annual average concentrations of NOx at the monitoring sites in Atlanta are shown in . The strong and statistically significant correlations for both pollutants strongly indicate (but do not prove) a cause-effect relationship between reductions in on-road emissions in Atlanta and improvements in air quality over the time period studied. Ambient concentrations of CO in urban areas closely reflect on-road vehicle emissions of CO (e.g., Parrish et al., Citation2006). Results are consistent with those of Blanchard et al. (Citation2010a) who found a qualitative agreement between the trends in CO emissions for Fulton County and average annual ambient CO concentrations at the SEARCH monitor in downtown Atlanta. The strong decline in CO concentrations in Atlanta noted in the current study (8–11.8% per year) and attributable, in large part, to reductions in on-road emissions is also similar to the marked decline in ambient CO concentrations of 11.9% per year during 1998–2008 in Burbank in the Los Angeles Basin, again attributed to reductions in vehicle emissions in that area (Warneke et al., Citation2012). The NOx correlation in the current study is weakest at the station at TUC, suggesting that the proximity of the other two NOx stations to two major highways (I75/I85 and I-20) results in a stronger association between vehicle emissions and ambient concentrations of this short-lived species. Although there is a statistically significant correlation between on-road NOx emissions in the Atlanta MSA and ambient NOx concentrations at each of the monitors studied, ambient NOx concentrations in Fulton County declined at faster rates than did on-road vehicle NOx emissions in the Atlanta MSA (8.7% per year and 5.8% per year in concentrations versus 4.7% per year in on-road emissions; , , nd 9). The greater than proportional response suggests that reductions in on-road vehicle emissions did not solely contribute to the reductions in ambient NOx concentrations. For example, NOx emissions from electric generating units (EGUs) in the southeastern states of Alabama, Florida, Georgia, and Mississippi decreased by 68% from 1999 to 2009 (Blanchard et al., Citation2013a); part of these reductions would have also contributed to the observed improvement in air quality in Atlanta.
Table 7. Correlation between on-road emissions and air concentrations in Atlanta
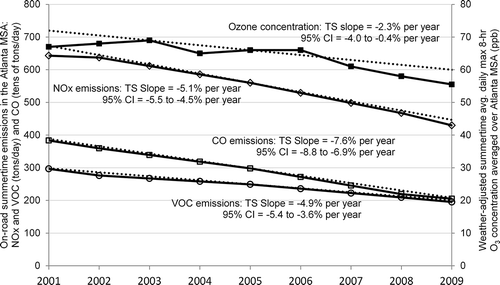
There is a slight declining trend in summertime O3 in Atlanta with a net decrease of 17% between 2001 and 2009 (). The trend is statistically significant with a TS slope of −2.3% per year. The observed downward trend will likely be stronger when excluding the effect of the ambient O3 background; for example, modeled fourth highest daily maximum 8-hr average O3 concentrations due to sources other than North American anthropogenic emissions exceed 40 ppb near Atlanta (Emery et al., Citation2012; Zhang et al., Citation2011). During the 2001–2009 time period, statistically significant downward trends are also observed in Atlanta summertime on-road emissions of NOx, VOCs, and CO. However, because emissions of both of the key O3 precursors, NOx and VOCs, decreased, the downward trends in O3 cannot be attributed to reductions in a specific precursor emission from on-road vehicles. Changes in O3 precursor emissions from other source categories not addressed here further complicate the identification of the primary cause of the O3 trend.
Figure 11. Trends in summertime O3 concentrations and on-road NOx, VOC, and CO emissions in Atlanta during 2001–2009.
Continental background CO concentrations in the Southeast are approximately 100 ppbv (Parrish et al., Citation2002). Over the past 10–15 yr, CO concentrations in Atlanta have decreased by 60–75% and are progressively nearing this background concentration suggesting that additional on-road emission control measures will have less air quality benefit than shown in past trends. On-road NOx emissions in Atlanta have decreased by approximately 40% during 1995–2009. As newer vehicles, in particular, those that meet Tier 2 penetrate the fleet, vehicle emissions will further decease and national on-road NOx emissions will constitute a relatively smaller fraction of the total anthropogenic inventory over the next decade (e.g., Vijayaraghavan et al., Citation2012). Therefore, the results of this study cannot be linearly extrapolated to obtain estimates of future reductions in ambient concentrations due to additional controls on vehicle emissions. However, the results may be used to estimate the benefit of such controls when combined with additional information on the fraction of ambient concentrations attributable to vehicle emissions versus other sources.
Acknowledgment
The authors thank the EPA for NEI and AQS data, Georgia EPD for TVT data, and Eric Edgerton, ARA, for SEARCH data.
Funding
This work was supported by the Coordinating Research Council Atmospheric Impacts Committee.
Additional information
Notes on contributors
Krish Vijayaraghavan
Krish Vijayaraghavan and Chris Lindhjem are senior managers, Allison DenBleyker is a senior associate, Lan Ma is an associate, and Greg Yarwood is a principal at ENVIRON International Corporation in Novato, CA.
References
- Air Improvement Resource, E.H. Pechan and Associates, Inc., and A. Hochhauser. 2010. Review of the 2009 draft Motor Vehicle Emissions Simulator (MOVES) model. Report prepared for the Coordinating Research Council, Inc., Alpharetta, GA. November. http://crcao.org/reports/recentstudies2011/E-68a/Final%20CRC%20E-68a%20Report_V6.pdf (accessed June 2012).
- Atmospheric Research and Analysis. 2012. http://www.atmospheric-research.com/studies/SEARCH/index.html (accessed July 2012).
- Blanchard, C.L., G.M. Hidy, S. Tanenbaum, R. Rasmussen, R. Watkins, and E. Edgerton. 2010a. NMOC, ozone, and organic aerosol in the southeastern states, 1999– 2007:1. Spatial and temporal variations of NMOC concentrations and composition in Atlanta, Georgia. Atmos. Environ. 44:4827–4839. doi:10.1016/j.atmosenv.2010.08.036
- Blanchard, C.L., G.M. Hidy, and S. Tanenbaum. 2010b. NMOC, ozone, and organic aerosol in the southeastern states, 1999– 2007:2. Ozone trends and sensitivity to NMOC emissions in Atlanta, Georgia. Atmos. Environ. 44:4840–4849. doi:10.1016/j.atmosenv.2010.07.030
- Blanchard, C.L., G.M. Hidy, S. Tanenbaum, and E.S. Edgerton. 2010c. NMOC, ozone, and organic aerosol in the southeastern states, 1999– 2007:3. Origins of organic aerosol in Atlanta, Georgia, and surrounding areas. Atmos. Environ. 45:1291–1302. doi:10.1016/j.atmosenv.2010.12.004
- Blanchard, C.L., G.M. Hidy, S. Tanenbaum, E.S. Edgerton, and B.E. Hartsell. 2013a. The Southeastern Aerosol Research and Characterization (SEARCH) study: Temporal trends in gas and PM concentrations and composition, 1999–2010. J. Air Waste Manage. Assoc. 63:247–259. doi:10.1080/10962247.2012.748523
- Blanchard, C.L., G.M. Hidy, S. Tanenbaum, E.S. Edgerton, and B.E. Hartsell. 2013b. The Southeastern Aerosol Research and Characterization (SEARCH) study: Spatial variations and chemical climatology, 1999–2010. J. Air Waste Manage. Assoc. 63:260–275. doi:10.1080/10962247.2012.749816
- Bloomer, B. J., J.W. Stehr, C.A. Piety, R.J. Salawitch, and R.R. Dickerson. 2009. Observed relationships of ozone air pollution with temperature and emissions. Geophys. Res. Lett. 36:L09803. doi:10.1029/2009GL037308
- Camalier, L., C. Cox, and P. Dolwick. 2007. The effects of meteorology and their use in assessing ozone trends. Atmos. Environ. 41:7127–7137. doi:10.1016/j.atmosenv.2007.04.061
- Effron, B. 1979. Bootstrap methods: Another look at the jackknife. Ann. Stat. 7:1–26. doi:10.1214/aos/1176344552
- Emery, C., J. Jung, N. Downey, J. Johnson, M. Jimenez, G. Yarwood, and R. Morris. 2012. Regional and global modeling estimates of policy relevant background ozone over the United States. Atmos. Environ. 47:206–217. doi:10.1016/j.atmosenv.2011.11.012
- Fujita, E.M., D.E. Campbell, W.R. Stockwell, and D.R. Lawson. 2013. Past and future ozone trends in California’s South Coast Air Basin: Reconciliation of ambient measurements with past and projected emission inventories. J. Air Waste Manag. Assoc. 63:54–69. doi:10.1080/10962247.2012.735211
- Fujita, E.M., D.E. Campbell, B. Zielinska, J.C. Chow, C.E. Lindhjem, A. DenBleyker, G.A. Bishop, B.G. Schuchmann, D.H. Stedman, and D.R. Lawson. 2012. Comparison of the MOVES2010a, MOBILE6.2, and EMFAC2007 mobile source emissions models with on-road traffic tunnel and remote sensing measurements. J. Air Waste Manag. Assoc. 62: 1134–1149. doi:10.1080/10962247.2012.699016
- Gego, E., P.S. Porter, A. Gilliland, and S.T. Rao. 2007. Observation-based assessment of the impact of nitrogen oxides emissions reductions on ozone air quality over the eastern United States. J. Appl. Meteorol. Climatol. 46:994e1008. doi:10.1175/JAM2523.1
- Kryak, D., K. Black, R. Cook, M. Constantini, R. Baldauf, A. Vette, and D. Costa. 2010. A source-to-outcome approach to address near-road air pollution. EM November: 34–37.
- Parrish, D.D. 2006. Critical evaluation of U.S. on-road vehicle emission inventories. Atmos. Environ. 40:2288–2300. doi:10.1016/j.atmosenv.2005.11.033
- Parrish, D.D., M. Trainer, D. Hereid, E.J.Williams, K.J. Olszyna, R.A. Harley, J.F. Meagher, and F.C. Fehsenfeld. 2002. Decadal change in carbon monoxide to nitrogen oxide ratio in U.S. vehicular emissions. J. Geophys. Res. 107(D12):4140–4148. doi:10.1029/2001JD000720
- Sen, P.K. 1968. Estimates of the regression coefficient based on Kendall’s tau. J. Am. Stat. Assoc. 63:1379–1389. doi:10.1080/01621459.1968.10480934
- Spearman, C. 1904. The proof and measurement of association between two things. Am. J. Psychol. 15:72–101. doi:10.2307/1412159
- The R Project for Statistical Computing. 2012. http://www.R-project.org (accessed April 2012).
- Thiel, H. 1950. A rank-invariant method of linear and polynomial regression analysis, III. Proc. K. Ned. Akad. Wet. A 53:1397–1412.
- U.S. Department of Transportation. 2012. Traffic volume trends. Office of Highway Policy Information, Federal Highway Administration, U.S. Department of Transportation. http://www.fhwa.dot.gov/policyinformation/travel_monitoring/tvt.cfm (accessed August 2012).
- U.S. Environmental Protection Agency. 1999. Regulatory Impact Analysis—Control of Air Pollution from New Motor Vehicles: Tier 2 Vehicle Emissions Standards and Gasoline Sulfur Control Requirements. EPA 420-R-99-023. Research Triangle Park, NC: U.S. Environmental Protection Agency, Engine Programs and Compliance Division, Office of Mobile Sources, December.
- U.S. Environmental Protection Agency. 2003. National Air Quality and Emissions Trends Report, 2003 Special Studies Edition. Appendix B—Trends Methodology. Research Triangle Park, NC: Office of Air Quality Planning and Standards, U.S. Environmental Protection Agency, September.
- U.S. Environmental Protection Agency. 2009a. Office of Transportation and Air Quality, U.S. Environmental Protection Agency. Air pollution from highway vehicles: What MOVES tells us. Presentation at the International Emission Inventory Conference, Baltimore, MD, April 15, 2009. http://www.epa.gov/ttnchie1/conference/ei18/session6/beardsley_pres.pdf (accessed July 2012).
- U.S. Environmental Protection Agency. 2009b. Statistical Analysis of Groundwater Monitoring Data at RCRA Facilities. Unified Guidance. EPA 530-R-09-007. Research Triangle Park, NC: Office of Resource Conservation and Recovery, U.S. Environmental Protection Agency, March.
- U.S. Environmental Protection Agency. 2010. Technical Guidance on the Use of MOVES2010 for Emission Inventory Preparation in the State Implementation Plans and Transportation Conformity. EPA-420-B-10-023. Research Triangle Park, NC: Transportation and Regional Programs Division, Office of Transportation and Air Quality, U.S. Environmental Protection Agency, April.
- U.S. Environmental Protection Agency. 2012a. Our Nation’s Air—Status and Trends through 2010. EPA-454/R-12-001. Research Triangle Park, NC: Office of Air Quality Planning and Standards, U.S. Environmental Protection Agency, February. http://www.epa.gov/airtrends/2011 (accessed June 2012).
- U.S. Environmental Protection Agency. 2012b. Clearinghouse for emission inventories and emissions factors. http://www.epa.gov/ttnchie1/eiinformation.html (accessed April 2012).
- U.S. Environmental Protection Agency. 2013a. Air trends for carbon monoxide. http://www.epa.gov/airtrends/carbon.html (accessed August 2012).
- U.S. Environmental Protection Agency. 2013b. Air Quality System (AQS) Data Mart. http://www.epa.gov/ttn/airs/aqsdatamart/access.htm (accessed August 2012).
- U.S. Environmental Protection Agency. 2013c. Trends in ozone adjusted for weather conditions. http://www.epa.gov/airtrends/weather.html (accessed August 2012).
- Vijayaraghavan, K., C. Lindhjem, A. DenBleyker, U. Nopmongcol, J. Grant, E. Tai, and G. Yarwood. 2012. Effects of light duty gasoline vehicle emission standards in the United States on ozone and particulate matter. Atmos. Environ. 60:109–120. doi:10.1016/j.atmosenv.2012.05.049
- Warneke, C., J.A. de Gouw, J.S. Holloway, J. Peischl, T.B. Ryerson, E. Atlas, D. Blake, M. Trainer, and D.D. Parrish. 2012. Multiyear trends in volatile organic compounds in Los Angeles, California: Five decades of decreasing emissions. J. Geophys. Res. 117:D00V17. doi:10.1029/2012JD017899
- Willmott, C.J., S.G. Ackleson, R.E. Davis, J.J. Feddema, K.M. Klink, D.R. Legates, J. O’Donnell, and C.M. Rowe. 1985. Statistics for the evaluation and comparison of models. J. Geophys. Res. 90(C5):8995–9005. doi:10.1029/JC090iC05p08995
- Zhang, L., D.J. Jacob, N.V. Downey, D.A. Wood, D. Blewitt, C.C. Carouge, A. van Donkelaar, D.B.A Jones, L.T. Murray, and Y. Wang. 2011. Improved estimate of the policy-relevant background ozone in the United States using the GEOS-Chem global model with 1/2° × 2/3° horizontal resolution over North America. Atmos. Environ. 45:6769–6776. doi:10.1016/j.atmosenv.2011.07.0