
Abstract
Positive matrix factorization (PMF) and effective variance (EV) solutions to the chemical mass balance (CMB) were applied to PM2.5 (particulate matter with an aerodynamic diameter <2.5 μm) mass and chemically speciated measurements for samples taken from 2008 to 2010 at the Atlanta, Georgia, and Birmingham, Alabama, sites. Commonly measured PM2.5 mass, elemental, ionic, and thermal carbon fraction concentrations were supplemented with detailed nonpolar organic speciation by thermal desorption-gas chromatography/mass spectrometry (TD-GC/MS). Source contribution estimates were calculated for motor vehicle exhaust, biomass burning, cooking, coal-fired power plants, road dust, vegetative detritus, and secondary sulfates and nitrates for Atlanta. Similar sources were found for Birmingham, with the addition of an industrial source and the separation of biomass burning into open burning and residential wood combustion. EV-CMB results based on conventional species were qualitatively similar to those estimated by PMF-CMB. Secondary ammonium sulfate was the largest contributor, accounting for 27–38% of PM2.5, followed by biomass burning (21–24%) and motor vehicle exhaust (9–24%) at both sites, with 4–6% of PM2.5 attributed to coal-fired power plants by EV-CMB. Including organic compounds in the EV-CMB reduced the motor vehicle exhaust and biomass burning contributions at both sites, with a 13–23% deficit for PM2.5 mass. The PMF-CMB solution showed mixing of sources within the derived factors, both with and without the addition of speciated organics, as is often the case with complex source mixtures such as those at these urban-scale sites. The nonpolar TD-GC/MS compounds can be obtained from existing filter samples and are a useful complement to the elements, ions, and carbon fractions. However, they should be supplemented with other methods, such as TD-GC/MS on derivitized samples, to obtain a wider range of polar compounds such as sterols, sugars, and organic acids. The PMF and EV solutions to the CMB equations are complementary to, rather than replacements for, each other, as comparisons of their results reveal uncertainties that are not otherwise evident.
Implications: Organic markers can be measured on currently acquired PM2.5 filter samples by thermal methods. These markers can complement element, ion, and carbon fraction measurements from long-term speciation networks. Applying the positive matrix factorization and effective variance solutions for the chemical mass balance equations provides useful information on the accuracy of the source contribution estimates. Nonpolar compounds need to be complemented with polar compounds to better apportion cooking and secondary organic aerosol contributors.
Introduction
Particulate matter (PM) source apportionment by receptor modeling relies on ambient measurements and source profiles for size-specific PM mass and chemical constituents (Watson et al., Citation2008). The chemical mass balance (CMB) receptor model describes the ambient concentration (Cit) of the ith chemical species measured at sample t as the linear sum of contributions from source types, j, with different emission compositions (Watson and Chow, Citation2015):
where Fij is the fractional abundance (source profile) of the ith species in emissions from the jth source, Sjt is the source contribution estimate (SCE) of the jth source for the receptor sample t, and Eit represents the difference between the measured and CMB-calculated (i.e., estimated) receptor concentration of the ith species in sample t. Eit reflects measurement uncertainty and source profile variability.
A solution to eq 1 uses one of several forms of factor analysis (Paatero and Tapper, Citation1994; Roscoe et al., Citation1982; Thurston and Spengler, Citation1985) to obtain source factors from the measured receptor concentrations. These factors are then associated with measured Fij and calculated SCEs (Sjt). The Positive Matrix Factorization (PMF) software (U.S. Environmental Protection Agency [EPA], Citation2014b) is most commonly used for implementing factor analysis solutions (PMF-CMB). Although it has been stated that factor analysis solutions do not require measured source profiles, there is no way to associate the factors with a source type when measured profiles are lacking. Since many receptor concentrations are correlated over time for reasons other than origination from the same emitter, the derived factors may represent mixtures from a variety of source types with this solution. Evaluations of the effects of correlation and uncertainty of input data on the factors (Balachandran et al., Citation2012; Brinkman et al., Citation2006; Chen et al., Citation2010; Christensen and Schauer, Citation2008a, Citation2008b; Habre et al., Citation2011; Hemann et al., Citation2009; Henry and Christensen, Citation2010; Kim and Hopke, Citation2007; Lingwall and Christensen, Citation2007; Lowenthal et al., Citation2010; Miller et al., Citation2002; Reff et al., Citation2007; Zhang et al., Citation2009) indicate that some of the samples in the data set need to be source dominated, i.e., representing single-source profiles. Source-dominated samples are more easily obtained at sampling sites located close to sources (Chen et al., Citation2007, Citation2011; Mooibroek et al., Citation2011) than at urban- to regional-scale monitors that measure complex source mixtures. The effective variance (EV)-CMB solution (Watson et al., Citation1984) to eq 1 uses measured Fij along with the Cit to estimate the Sjt, inversely weighting each species, i, by its variability in both Cit and Fij. This solution has also been implemented as open-source software (EPA, Citation2004). Chen et al. (Citation2007, Citation2011) demonstrate the value of applying both the PMF and EV solutions to a data set in order to reveal excessive deviations from assumptions, and that is the approach taken here.
Any number or type of species, i, can be used as input data, but these are most useful when they are present in some source types and absent in others and when their ratios to PM mass and other species remain reasonably constant within a source type. Early source apportionment studies measured combinations of PM mass, elements, ions, and carbon fractions, typical of those available from long-term speciation networks (Dabek-Zlotorzynska et al., Citation2011; IMPROVE, Citation2015; EPA, Citation2014a; Zhang et al., Citation2012) that contain these markers. However, as pollution controls, fuels and feedstocks, and operating practices have improved, many of these markers, especially elements, have been removed from emission profiles. Primary PM emissions from well-controlled stationary sources, such as power stations and industrial processes, are small, and the detection of their primary Sjt values are more useful for attributing secondary aerosols (Eatough et al., Citation2000; Iyer et al., Citation1987; Watson et al., Citation2002) than to account for ambient PM concentrations. Carbonaceous aerosols constitute an important fraction of PM, and this fraction contains a wide variety of organic source markers (Daisey et al., Citation1986; Hildemann et al., Citation1991; Schauer et al., Citation1996; Chow et al., Citation2007a). Although measuring organic markers once required large sample deposits and complex extractions (Mazurek et al., Citation1987), modern thermal desorption (TD) methods (Chow et al., Citation2007b; Hays and Lavrich, Citation2007; Ho and Yu, Citation2004; Orasche et al., Citation2011) allow such measurements to be made on portions of quartz-fiber filter samples.
The Southeastern Aerosol Research and Characterization (SEARCH) study is a long-term air pollutant monitoring network at eight urban and rural locations in the southeastern United States (Edgerton et al., Citation2005, Citation2006; Hansen et al., Citation2003; Watson et al., Citation2009). Concerns over air quality remediation and health effects prompted studies to identify and quantify atmospheric PM source contributions in this region and track their trends over time (Blanchard et al., Citation2013, Citation2014; Hidy et al., Citation2014; Ke et al., Citation2008; Lee et al., Citation2008; Lee and Russell, Citation2007; Liu et al., Citation2006; Marmur et al., Citation2006; Tian et al., Citation2009; Zheng et al., Citation2002, Citation2006, Citation2007). In addition to PM2.5 (particles with aerodynamic diameters less than 2.5 μm) mass, elements, ions, and thermal carbon fractions, a set of nonpolar organic compounds was measured at the Atlanta, Georgia (JST), and Birmingham, Alabama (BHM), sites from 2008 to 2010. In contrast to previously applied solvent extraction approaches that need to aggregate samples from multiple days, the thermal desorption-gas chromatography/mass spectrometry (TD-GC/MS; Chow et al., Citation2007b) method allows for rapid measurements on every sample. This study examines the utility of the TD-GC/MS measurements for quantitative source apportionment using the PMF and EV solutions to the CMB equations.
Materials and Methods
Ambient PM2.5 chemical speciation
The species measured and concentration summaries are detailed in the Supplemental Material (Tables S-1 to S-4), as are maps (Figure S-1) showing the sampling locations, which are urban-scale monitors (Chow et al., Citation2002a) in commercial/residential areas. Samples for mass, elements, ions, and carbon fractions were collected at the JST and BHM sites with a multichannel, sequential filter-based particle composition monitor (PCM) operated at 16.7 L/min per channel through WINS (well impactor ninety-six; Peters et al., Citation2001) PM2.5 inlets (Edgerton et al., Citation2005) preceded by a URG (Chapel Hill, NC) PM10 cyclone. Acidic and basic annular denuders preceded the Teflon-membrane and nylon-membrane filter channels to remove nitric acid and ammonia gases, respectively. An activated carbon–coated honeycomb denuder preceded the quartz-fiber filter channel to remove adsorbed organic vapors (Chow et al., Citation2010; Watson et al., Citation2009). PM2.5 mass was measured gravimetrically on Teflon-membrane filters prior to elemental analysis by nondispersive X-ray fluorescence (XRF; Watson et al., Citation1999). These filters were then extracted in deionized-distilled water (DDW) to quantify water-soluble metals using inductively coupled plasma mass spectrometry (ICP-MS; EPA, Citation1999). The nylon-membrane filter was extracted in DDW for anion and cation analyses by ion chromatography (IC; Chow and Watson, Citation1999). The IMPROVE_A thermal/optical reflectance (TOR) protocol (Chow et al., Citation2007c, Citation2011) was applied to 0.5-cm2 portions of the quartz-fiber filter to obtain organic and elemental carbon (OC and EC) as well as seven thermally defined carbon fractions.
A separate medium-volume sequential filter sampler (Chow et al., Citation1993; EPA, Citation1989) was collocated at each site equipped with a Bendix 240 PM2.5 cyclone (Chan and Lippmann, Citation1977) and obtained quartz-fiber filter deposits at 20 L/min drawn into a plenum; the remaining 93 L/min was exhausted as makeup air to achieve the PM2.5 cut-point. One hundred and fifteen organic compounds were determined (i.e., 28 each for polycyclic aromatic hydrocarbons [PAHs] and n-alkanes, 18 each for iso/anteisoalkanes and hopanes, 12 steranes, 2 methylalkanes, 3 branched alkanes, 5 cycloalkanes, and 1 alkene) following the TD-GC/MS procedure of Ho et al. (Citation2004, Citation2008, Citation2012). Four PAHs, 1-methylnaphthalene, 2-methylnaphthalene, 2,6-dimethylnaphthalene, and anthraquinone, were below the minimum detectable limits (MDLs) for 995 of 997 samples and were excluded from the data set.
Source profiles
Real-world source profiles should be measured to represent emissions for the study period and region (Wang et al., Citation2012a; Watson et al., Citation2012). Area-source emission profiles were not available for Atlanta or Birmingham, so applicable profiles were sought from other studies, as detailed below; this is consistent with prior source apportionment studies in the region (Zheng et al., Citation2002). A relatively small number of source profiles in the EPA’s (Citation2014c) SPECIATE database contain abundances for organic compounds, and there is an incomplete overlap between the compounds reported and the ones measured by TD-GC/MS. To assure compatibility between the source profile and ambient species, 20 archived (under refrigeration) quartz-fiber filter remnants from prior real-world emission tests were submitted to the same TD-GC/MS analyses applied to the SEARCH samples for (1) roadside motor vehicle exhaust, biomass burning, and cooking emissions collected during the Big Bend Regional Aerosol and Visibility and Observational (BRAVO) study (Chow et al., Citation2004); and (2) biomass burning and roadside emission samples from the Lake Tahoe Source Characterization Study (Kuhns et al., Citation2004). These samples had been previously analyzed for conventional species including elements, ions (i.e., Cl−, SO42−, NO3−, NH4+, Na+, and K+), and carbon (OC and EC and their thermal fractions).
As a complement to this study, primary PM samples were collected from five coal-fired power plant boiler stacks (CFPPs; four in Georgia and one in Alabama) using the heated front filter from EPA (Citation2000) Method 5. The normal glass-fiber filter was substituted with Teflon-membrane (R2PJ047; Pall Corporation, Ann Arbor, MI) and prefired quartz-fiber (Tissuquartz; Pall Corporation) filters. Because hot-stack gases are measured with Method 5, some of the volatile components that would condense upon cooling are underestimated by hot-filter measurements (England et al., Citation2007; Hildemann et al., Citation1989; Sheya et al., Citation2008), especially for semivolatile organic compounds. However, these organics are expected to be a small portion of PM emissions for well-controlled power plants such as those tested and operating in the region. Several samples were obtained from each source after PM and sulfur dioxide (SO2) scrubbers with sample durations ranging from 1 to 6 hr, and Teflon-membrane and quartz-fiber samples were taken sequentially at each source rather than in parallel. Mass and elements were measured on the Teflon-membrane filters, whereas ions, carbon fractions, and organic species were measured on the quartz-fiber filters. The average sum of species to mass ratio was less than about 0.5, lower than for the ambient data set (0.75 ± 0.13). The CFPPOUT profiles (Table S-5) were calculated as the average of all chemical concentrations divided by the corresponding sums of species. A similar approach was taken by Chow et al. (Citation2007a) for source profiles where there was disagreement between measured mass and the sum of species. Wang et al. (Citation2012b) found that much of the missing mass was due to liquid water associated with sulfuric acid in the samples, which is retained at the standard mass equilibration conditions of 35% relative humidity (RH). Composite source profiles were calculated for each source type, e.g., motor vehicle exhaust, biomass combustion, cooking, and coal-fired power plant boiler stack emissions (i.e., coal combustion) and are summarized in Table S-5.
Results
Ambient PM2.5 data
Complete data for mass, elements, ions, carbon, and speciated organics were available for 279 JST samples and 718 BHM samples. Uncertainties for each concentration were estimated as a function of analytical replicates, field blank standard deviations, and sample volume performance tests (Watson et al., Citation2001). More than 75% of concentrations exceeded twice their uncertainties (Chow et al., Citation2007a). This criterion was used to select species for inclusion in the receptor modeling. Since uncertainties are required as input to the PMF-CMB and EV-CMB software, a few zero values found in the ambient data set were replaced by the root-mean-square error (RMSE) of the remaining concentrations for a given species.
Average PM2.5 mass and chemical species concentrations are summarized in Table S-4. Similar averages were found at the JST and BHM sites for mass (12.9 vs. 12.8 µg/m3), SO42− (3.7 vs. 3.1 µg/m3), NO3− (0.20 vs. 0.19 µg/m3), NH4+ (1.26 vs. 1.05 µg/m3), OC (2.8 vs. 3.0 µg/m3), and EC (0.86 vs. 1.17 µg/m3), respectively. Average crustal element concentrations (e.g., Al, Si, Ca, and Fe) were low (≤0.2 µg/m3), but these were up to 3 times higher at BHM compared with JST. Average Se concentrations, a coal combustion marker (Andren et al., Citation1975), were ~1 ng/m3 at both sites. PM2.5 Mn, Zn, As, and Pb were factors of 5.8, 6.6, 2, and 6.8 times higher, respectively, at BHM compared with JST.
The importance of noncrustal sources of trace metals can be evaluated using crustal enrichment factors (EFs) with respect to Si (Duce et al., Citation1975) based on the crustal composition of Mason (Citation1966). Crustal EFs at the JST and BHM sites for average concentrations were 1.5 and 1.2 for Al; 2.5 and 3.7 for Ca; 3.4 and 10.3 for Mn; 407 and 1393 for Zn; 1056 and 1091 for As; and 585 and 2037 for Pb, respectively. PM2.5 Al was not enriched at either site, whereas Ca was weakly enriched at both sites. PM2.5 Mn was weakly enriched (3.4) at JST but moderately enriched (10.3) at BHM, consistent with influence from industrial source(s). PM2.5 Zn, As, and Pb were highly enriched at both sites. EFs for As were similar at the JST and BHM sites, consistent with similar industrial sources for this species. Conversely, EFs for Zn and Pb were 3–4 times higher at BHM than JST, consistent with more industrial emissions of these species at BHM.
The sum of all TD-GC/MS species was 18.3 ng/m3 at JST and 33.7 ng/m3 at BHM, representing only 0.46% and 0.79% of organic mass (OM), respectively (where OM/OC = 1.4 to account for unmeasured H, O, N, and S associated with organic compounds; Malm et al., Citation1994). This difference was mainly due to the PAHs, as the sum of average PAHs was 11.2 times higher at BHM compared with JST. Except for the average alkenes (1-octadecene) of 1.84 and 3.2 ng/m3 at the JST and BHM sites, respectively, average concentrations for other compound classes were similar at both sites.
The CMB model assumes that the composition of source emissions is conserved between source and receptor. This is a reasonable assumption for many species, but not for those formed by gas-to-particle conversion between source and receptor, as is the case for secondary SO42−, secondary NO3−, and secondary organic carbon (SOC). Some PAHs are semivolatile, i.e., they are found in both gas and particle phases in the atmosphere. Phase partitioning for these compounds can change during transport from an emission source to a receptor, and the heavier PAHs with lower volatility are better markers than the light PAHs (Chow et al., Citation2007a).
Source profiles
documents the 10 source profiles applied to EV-CMB, with Table S-5 providing detailed species abundances. Profiles for paved road dust (PVRD), ammonium sulfate (AMSUL), ammonium nitrate (AMNIT), and salt (MAR100) did not have organic compound abundances, so these were set to zero (Chow et al., Citation2007a). This is justified based on the nonexistent or low-OC fractions in these profiles and that their SCEs are sufficiently sensitive to elemental and ion abundances. The average molar ratios of NH4+ to SO42−, corrected for NH4+ associated with NO3− (i.e., 0.29 NO3−), was 1.82 ± 0.33 at JST and 1.74 ± 0.34 at BHM, within 1 standard deviation of 2 molar ratio for pure ammonium sulfate [(NH4)2SO4]. Therefore, only the completely neutralized form of SO42− (i.e., AMSUL; (NH4)2SO4) was used in the EV-CMB solution. Salt (typically from de-icing material at inland sites) is not expected to be an important contributor to PM2.5 at either site, but a pure sea salt profile (MAR) was used to estimate and verify the salt contribution (Chow et al., Citation2007a).
Table 1. Descriptions of source profiles available for effective variance–chemical mass balance (EV-CMB) modeling
Source contributions from the PMF-CMB solution
PMF 3.0 software (EPA, 2010) was applied separately to the entire data sets from the JST and BHM sites, with species showing signal-to-noise ratios (SNRs) <2 excluded from the final PMF-CMB solutions. Additional uncertainties (i.e., a factor of 3) were introduced to species that produced “singlet” factors (i.e., factors consisting of nearly 100% of a single species), as uncertainties of these species were likely underestimated (Chen et al., Citation2010; Green et al., Citation2012). Chen et al. (Citation2010) found that the number of factors should adequately explain the variance of the input data (i.e., R2 > 0.95) for all species with relatively high SNRs. These selections produced converged solutions in all PMF runs. Factor rotations were attempted by adjusting the FPEAK parameter (−1 to 1), but no important changes to the solutions resulted. Source factors and their uncertainties were derived using bootstrapping as the averages and standard deviations of the profiles from 100 runs with different starting points and 5% of samples randomly removed in each run. Consistency of the source factors over 100 runs indicates a stable solution.
As shown in , the PMF-CMB solution resolved 8 and 10 sources for the JST and BHM sites, respectively. PMF 3.0 software does not contain a diagnostic for identifying influential source markers. Marker species for each source in were determined using the source factors from the PMF analysis (Tables S-6 and S-7) as input to the EV-CMB software (EPA, 2004), applying them to the respective average concentrations at each site, and generating the MPIN diagnostics (Tables S-8 and S-9). PMF factors were subjectively associated with source types based on the most prevalent species in the source profiles by comparing the relative abundances of species with measured source types and from the MPIN diagnostics.
Table 2. Average source contributions (µg/m3) to PM2.5 mass estimated with the PMF-CMB solution
The PMF-CMB SCEs accounted for nearly all of the PM2.5 mass at both sites (). For JST, the major contributors to PM2.5 were secondary sulfate (45.1%), motor vehicle exhaust (19.4%), and biomass burning (19.4%). The remaining sources each contributed less than 4%. Marker species for motor vehicle exhaust were Ba, Fe, Cu, and EC. However, the major constituents in the PMF factor associated with motor vehicle exhaust (Table S-6) were SO42− (22 ± 16%), OC (19.8 ± 13.7%), and EC (16.8 ± 9.4%), indicating source mixing within the factor. The relatively high EC/OC ratio is consistent with diesel vehicle emissions, although the EC and OC abundances appear low for real-world diesel- and gasoline-engine profiles (Fujita et al., Citation2007). There is a low correlation (R2 = 0.32) between ambient EC and SO42− concentrations. The abundant (22 ± 16%) SO42− fraction in the PMF-derived motor vehicle exhaust profile represents the majority of uncertainty in the SCE. The loadings of Ba, Cu, and Fe in the MPIN matrix based on EV-CMB (Table S-8) were 1.0, 0.69, and 0.57, respectively, and none of these species’ ambient concentrations were correlated with SO42−. However, the correlations between Ba and Fe with EC were 0.60 and 0.56, respectively. The correlation between EC and OC was 0.83, consistent with a common source. Ba in motor vehicle exhaust along with Cu and Fe may be associated with brake wear or road dust, although Ba has been used as a diesel fuel additive in the past (Truex et al., Citation1980; Turley et al., Citation1973).
Biomass burning markers were K and OC (). Water-soluble K+, the expected marker for biomass burning, had the third largest MPIN loading (0.2), and its correlation with K was 0.91. Vegetative detritus (1.5%) was characterized by n-C29 to n-C35 alkanes (NONCOS to PTRICONT, Table S-3), although two hopanes (HOP6 and HOP10, Table S-3) were also associated with this source. The primary PM coal combustion source contribution was small (0.38 ± 0.74 µg/m3), with MPIN loadings of 1 for Se and 0.83 for As, consistent with expectations. Table S-6 shows that the coal factor is composed mainly of SO42− (65.9 ± 116%) and NH4+ (23.2 ± 53%), again indicating a mixing of primary and secondary contributions. Since the primary contribution to PM2.5 mass was small, its contribution to SO42− was also small. The Se abundance in this profile (0.14 ± 0.29%) was nearly 2 orders of magnitude higher than that in the other PMF factors. A road dust contribution (4.1%) resulted from a factor with Al and Si markers (with abundances of 7.7 ± 2.9% and 16.7 ± 6%, respectively; Table S-6). The salt contribution (3.9%) was influenced by a factor with an 11.4 ± 4.9% Na+ abundance.
The PMF-CMB results for the BHM site were qualitatively and quantitatively similar to those from JST, with 10 instead of 8 source factors. The major contributors to PM2.5 were secondary sulfate (42.7%), motor vehicle exhaust (21%), and biomass burning (17.8%). The MPIN matrix in Table S-7 shows that biomass burning was separated into two source subtypes. Biomass burning 1, associated with open burning, was characterized by potassium (K+ and K), and biomass burning 2, associated with residential wood combustion (RWC), was characterized by retene (Ramdahl, Citation1983; Shen et al., Citation2012). No correlation was found between K and retene in the ambient data, consistent with these coming from different source subtypes. A coal combustion factor was not found for BHM ambient data. None of the PMF source factors contained more than 0.009% Se, and the MPIN matrix did not identify Se as “influential” for any of these factors. A vegetative detritus source contribution (3.8%) was characterized by n-C31 to n-C35 alkanes (HTRICONT to PTRICONT, Table S-3). An industrial dust source contribution (4.1%) was characterized by a factor with Cu and Fe abundances. A source factor that couldn’t be identified (“unknown”) accounted for 0.1% of PM2.5 mass and was characterized in the MPIN by hopanes (HOP3 and HOP6, Table S-3).
No PMF-CMB factor was associated with SOC, which is expected to have loadings on oxygenated compounds such as carboxylic acids, alcohols, and ketones (Couvidat et al., Citation2013; Jaoui et al., Citation2006; van Eijck et al., Citation2013). TD-GC/MS species are mostly hydrocarbons, so there was a dearth of SOC markers available as input data. Since nearly all of the PM2.5 mass was accounted for by the “primary” PMF factors, any SOC present must be spread across the OC abundances in sources associated with them. This does not necessarily mean that the SOC originated from precursors emitted by these sources. As seen in Tables S-6 and S-7, the PMF-derived secondary sulfate source profiles contain 10.2 ± 4 and 8 ± 2% OC for the JST and BHM sites, respectively. The PMF thus apportions 0.60 and 0.43 µg/m3 of OC to this source at the JST and BHM sites, respectively. Note that although SO42− associated with this PMF source may be secondary, this is not necessarily the case for OC.
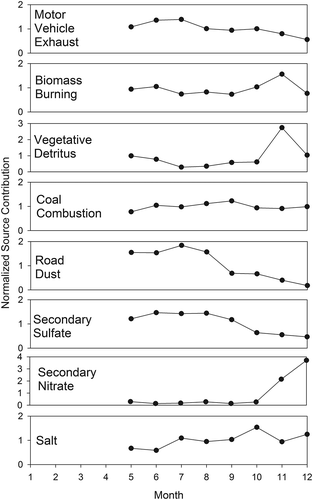
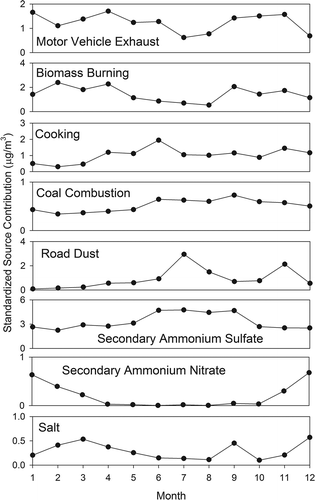
Temporal variation of the monthly averaged PMF-CMB SCEs (standardized to a mean of 1) shown in indicates an increase in motor vehicle exhaust, road dust, and secondary sulfate contributions during the summer months at JST. Both biomass burning and vegetative detritus displayed a maximum in November. Coal combustion appeared relatively constant during the study. Although secondary nitrate contributions were minimal during the summer, they began to increase during the colder months when the thermodynamic equilibrium for ammonium nitrate favors the particle phase (Watson et al., Citation1994).
Figure 1. Monthly average PMF-CMB source contributions for Atlanta, Georgia (JST site). Values are normalized to the average contribution for each source for all samples. Motor vehicle exhaust contributions are dominated by engine exhaust. Complete data were available from January through April on only 26 days. Therefore, averages are presented only for May through December.
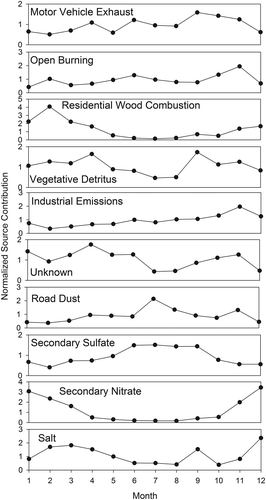
For BHM (), the highest vehicle contributions occurred during late summer and fall. The highest biomass burning contribution was seen in November, as was the case at JST. RWC reached a minimum during summer and was elevated during winter. Dust contributions peaked during summer (similar to JST), whereas salt contribution went through a minimum during summer. This may reflect large-scale meteorological patterns affecting transport from the Gulf of Mexico or the Atlantic Ocean. As seen in JST, secondary sulfate peaked during the warmer months, whereas secondary nitrate peaked during winter.
Figure 2. Monthly average PMF-CMB source contributions for Birmingham, Alabama (BHM site). Values are normalized to the average contribution for each source for all samples. Motor vehicle exhaust is dominated by engine exhaust.
Source contributions from the EV-CMB solution
The EV-CMB applications and validation protocol (Watson, Citation2004) guided this software application. summarizes sensitivity tests conducted on the average concentrations from JST to determine the effect of source profiles and fitting species on the source mix and SCEs. Fitting species included and excluded organic species using the BRVEH, TAVEH, or MXTUN motor vehicle exhaust profiles (). The BRBURN, BRCOOK, and CFPPOUT profiles were found to best represent biomass burning, cooking, and coal combustion emissions, respectively. The thermal carbon fractions were not included, as they were not available for all profiles. Although Zn and Pb were well detected in the ambient samples, the EV solution did not account for their concentrations using the available source profiles, so they were excluded. Both of these metals are enriched in industrial emissions, particularly from municipal incinerators (Sakata et al., Citation2000).
Table 3. Sensitivity tests for EV-CMB source contribution estimatesa for average concentrationsb at Atlanta, Georgia (JST site)
As shown in , SCEs for Case A are based only on elements, ions, and carbon species, whereas Case B represents SCEs with the addition of organic species for the three motor vehicle exhaust profiles (i.e., BRVEH, TAVEH, and MXTUN). The R-square (R2) of ≥0.96 (performance target: 0.8–1) and chi-square (Chi) of ≤1.55 (performance target <4) suggest a good fit to ambient concentrations. The percent of mass (PCT) varied from 78% when organic species were included to 82% without organic markers (performance target: 100 ± 20%). Approximately 20% of PM2.5 mass (~2 µg/m3) was not represented by SCEs. PM2.5 OC was estimated to within 7% in all cases in , with the cooking profile (BRCOOK) constituting 69% of OC, a key marker in MPIN diagnostics, or 97% of OM, assuming OM = OC × 1.4. It is possible that a SOC profile (composed only of OC) could be part of the cooking source contribution.
The average ambient Si concentration at JST was 0.1 µg/m3. Given the Si abundance (28 ± 9%) in the PVRD (road dust) profile, it is unlikely that geological dust accounts for >0.5 µg/m3 of PM2.5. According to the MPIN diagnostic, Si and Al are the key marker species for the road dust profile. While no industrial source profiles other than coal combustion were included, such sources are not expected to significantly impact PM2.5 mass, although they do emit trace elements such as Zn and Pb. Because the chemical species concentrations are fit well by the model, the 20% underprediction of mass is probably associated with systematic errors (bias) in the source profiles.
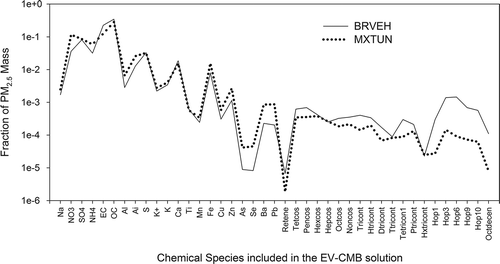
Including organic species, Case 1B () shows a 35-fold decrease in the motor vehicle exhaust SCE, from 2.1 to 0.06 µg/m3. This is also found for Case 3B, although the decrease (from 1.85 to 1.03 µg/m3) is much smaller. Including organic species, the motor vehicle exhaust SCE using the MXTUN profile is 17 times higher than that of the BRVEH profile. In both cases, the MPIN diagnostic indicates that hopanes, i.e., α,β-norhopane (C29; HOP3) and α,β-hopane (C30; HOP6) are the key markers for motor vehicle exhaust. compares all fitting species in both source profiles. The lower BRVEH contribution is due to differences in the abundances of these two hopane species in the source profiles. Table S-5 shows that the abundances of HOP3 and HOP6 are factors of 10 and 16 higher, respectively, in the BRVEH than the MXTUN profiles. On average, all of the hopanes, as well as 1-octadecene, are 11 ± 3 times higher in the BRVEH than the MXTUN profiles. Using BRVEH as the motor vehicle exhaust profile, SCEs from the EV-CMB (0.06 ± 0.05 µg/m3 for Case 1B in ) are not consistent with the PMF-CMB motor vehicle exhaust SCE for JST (2.45 ± 1 µg/m3). Although the SCE with organic species using the MXTUN profile is lower (1.03 ± 0.46 µg/m3), the source mix for Case 3B appears to represent the best solution, given the available source profiles.
Figure 3. Comparson of the BRVEH and MXTUN motor vehicle exhaust source profiles. (See for profile descriptions and Tables S-2 and S-3 for species descriptions.)
Overall, the biomass burning and cooking SCEs are relatively consistent, given their uncertainties. This is also the case for the SCE of ~0.55 µg/m3 for coal combustion. The MPIN diagnostic indicates that Se is the key marker species for primary PM from coal combustion, as expected (e.g., Thurston and Spengler, Citation1985). The MPIN marker species for BRBURN (biomass burning) are K+ and K with conventional species (Case 3A) and HTRICONT and DTRICONT (n-C31 and n-C32, respectively, in Table S-3) as well as K+ and K with conventional plus organic species (Case 3B). The MPIN marker species for cooking is OC with or without organic speciation. The largest contribution is from secondary ammonium sulfate (4.4 ± 0.4 µg/m3). Road dust, secondary ammonium nitrate, and salt contributions are each less than 0.2 µg/m3. The differences between the results for Cases 3A and 3B indicate the general effect of the organic species on EV-CMB source apportionment, which lowers the motor vehicle exhaust (MXTUN) and biomass burning (BRBURN) contributions.
The EV-CMB solution was applied to individual samples using the source profile mix from Case 3 (), and average SCEs for the JST and BHM sites are shown in . The addition of organic species reduced the percent mass explained by 13–23%. R2 of 0.70–0.78 and chi-square of 12–17 also fell off the performance target criteria. The performance measures for CMB SCEs from average PM2.5 concentrations are expected to be better than average SCEs from the individual samples. This may be due to the large uncertainties in TD-GC/MS concentrations on a sample-to-sample basis that are smoothed out in the average of all samples. Average SCEs from the individual samples () agree qualitatively with SCEs derived from the average of all samples (). Contributions from the combustion sources (i.e., motor vehicle exhaust, biomass burning, and cooking) are systematically lower when the organic species are included. Had the fractional abundances of the organic species in the source profiles been half as large, the average motor vehicle exhaust (MXTUN) and vegetative burning (BRBURN) SCEs at JST would have increased from 0.81 to 1.6 µg/m3 and from 1.44 to 3.1 µg/m3, respectively. Average cooking (BRCOOK) SCEs would not have changed (1.6 vs. 1.59 µg/m3), confirming that OC, not any of the organic species, is the key marker for this source. Note that although corrections were made for the positive OC sampling artifact in the ambient samples, this was not the case for the source samples. This could also contribute to unrealistically high organic species concentrations in the combustion source profiles.
Table 4. Average source contribution estimates (SCEs) from EV-CMB solutions for individual samples with and without organic compounds
The PMF and EV solutions to the CMB equations are qualitatively similar. Both analyses indicate important contributions from combustion (vehicle exhaust and biomass burning) sources. The average primary coal combustion SCE was ~0.4–0.5 µg/m3, although this source wasn’t identified by the PMF solution at BHM. An industrial source SCE (0.51 ± 0.27 µg/m3) identified at BHM is reasonable, as many such sources exist there. Since industrial source profiles with organic species were not available, these were excluded from the EV solution. The PMF solution did not produce a factor that could be associated with cooking. In the EV-CMB, the cooking source profile (BRCOOK) was mainly comprised of OC. Without an organic marker such as cholesterol, the association of a source factor with cooking is not definitive. and show that average monthly motor vehicle exhaust SCEs with the EV solution did not vary systematically. This is also the case for the coal combustion SCEs at both sites. Monthly averaged coal combustion SCEs by PMF-CMB at JST () also show no annual pattern. Biomass burning SCEs peaked in November at JST with less variation at BHM. Cooking contributions peaked during the summer months at JST, which could suggest that this factor is more associated with SOC. The temporal patterns in SCEs for dust, ammonium sulfate (or secondary sulfate), ammonium nitrate (or secondary nitrate), and salt by the PMF and EV solutions were similar at both sites.
Figure 4. Monthly average EV-CMB source contributions (µg/m3) for Atlanta, Georgia (JST site), using conventional plus organic species. (Complete data were available from January through April on only 26 days. Therefore, averages are presented only for May through December.)
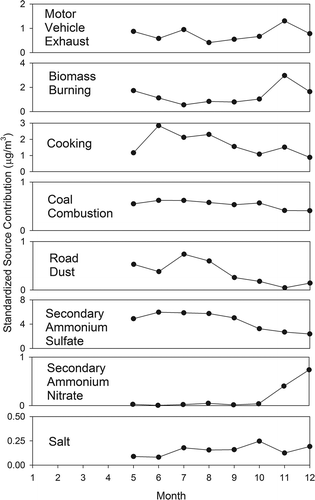
Figure 5. Monthly average EV-CMB source contributions (µg/m3) for Birmingham, Alabama (BHM site), using conventional and organic species.
EV-CMB results from this study are compared in with those of Zheng et al. (Citation2007) for the Atlanta (JST) site during summer (June–August) of 2001. There are not enough sample days during winter for a quantitative comparison. Zheng et al. (Citation2007) applied the EV-CMB solution using mainly organic compounds, including cholesterol and levoglucosan, determined by solvent extraction followed by GC/MS. The source profiles in Zheng et al. (Citation2007) were normalized to OC rather than PM2.5 mass. Source contributions to PM2.5 were estimated from SCEs to OC and the ratios of OC to PM2.5 mass in the source samples. With a source referred to as “unidentified” OM, Zheng et al. (Citation2007) found the sum of model-calculated SCEs accounted for 83% of measured PM2.5 mass during summer. The motor vehicle exhaust SCE (6.8%) of Zheng et al. (Citation2007) agrees with estimates in this study (5.5% and 6.5% with and without organic species, respectively). The cooking contribution in this study (21–22%) was about twice that estimated by Zheng et al. (Citation2007). The largest difference is for the biomass burning contribution: 0.44% in Zheng et al. (Citation2007) versus 7.8% and 17.8% (with and without organic species, respectively) in this study. Note that n-C31 and n-C32 alkanes along with K+ and K were marker species for biomass burning when organic species were included in EV solution. The negligible biomass burning contribution estimated by Zheng et al. (Citation2007) is inconsistent with prescribed burns and wildfires occurring during summer in the region (Christopher et al., Citation2009; Lee et al., Citation2005). Soluble K+ is a recognized marker species for biomass burning (Chow et al., Citation2007a). Table S-5 indicates that the K+/K ratio is low (0.054) in the paved road dust (PVRD) profile compared with ~1 in the biomass burning (BRBURN) profile. The average K+/K ratio in JST PM2.5 samples was 0.47 ± 0.2 during summer, exceeding the expected ratio from a geological source and suggesting an impact from biomass burning contribution. Zheng et al. (Citation2007) reported 23% unaccounted-for OM, and attributed it to SOC. As noted above, OC was accounted for within 7% of its average measured value in this study. SOC could have been accounted for, at least in part, by the cooking contribution, which constituted 69 ± 6% of OC. The sum of the combustion source contributions (42%, including SOC for Zheng et al., Citation2007) agree reasonably well (35–45%) with this study.
Table 5. Comparison of EV-CMB source contribution estimates for combustion sources in Atlanta, Georgia (JST site), during summer 2008–2010 with those of Zheng et al. (Citation2007) during summer 2001
Discussion
The application of two CMB solutions to commonly acquired and enhanced source and receptor data sets reveals powers and deficiencies of the receptor modeling approach. The PMF solution makes full use of the available ambient data, but there is a clear mixing of different source types in the derived source factors. The EV solution allows for several measured source profiles to be included, but it is apparent that some are missing, as evidenced by excesses and deficiencies in some elemental and organic species concentrations that cannot be explained. Few source profiles from other studies contain the regional and time period applicability needed for widespread applications, and this can result in systematic biases that may over- or underestimate PM2.5 mass and chemical components.
The addition of TD-GC/MS organic compounds is a useful adjunct to the more commonly available element, ion, and carbon fraction concentrations. This approach can be routinely applied to a small punch from the commonly available quartz-fiber filter used for thermal/optical carbon analysis for OC and EC. It is feasible to couple more specific organic compound detection to these analyzers (Diab et al., Citation2014; Grabowsky et al., Citation2011), though this is not yet practical. TD-GC/MS makes many more source markers available for both the PMF and EV solutions. However, the individual compounds are present in small abundances, much less than 1% of the mass in source and receptor samples. This allows them to be highly variable within a given source type. Their production, especially for the PAHs, is highly dependent on fuels and combustion conditions. The lack of oxygenated compounds, such as sugars, sterols, terpenoids, and organic acids, limits the ability of either solution to distinguish cooking and SOC sources from each other or from the other carbon-containing sources. Many of these nonpolar organic compounds can now be quantified by TD-GC/MS on a separate quartz-fiber filter punch after derivitization (Orasche et al., Citation2011), and this would be another useful adjunct to analysis of new and archived filters. Multiwavelength optical information that can be acquired along with the thermal/optical carbon analysis could also enhance the resolution of different source contributions (Chen et al., Citation2015).
Source apportionment by receptor modeling is only one part of a weight-of-evidence approach (EPA, Citation2007) to justifying air quality management plans. Reconciliation of source contribution estimates with emission inventories and source-oriented modeling is the next step toward improving the application of emission reduction strategies and evaluating their long-term effectiveness.
Summary and Conclusion
Daily PM2.5 concentrations were compiled for the Southeastern Research and Characterization (SEARCH) sites in Atlanta, Georgia (JST), and Birmingham, Alabama (BHM), from 2008–2010. Samples were analyzed for conventional species (i.e., mass, elements, ions, organic and elemental carbon and their thermal fractions) and 115 organic compounds (i.e., polycyclic aromatic hydrocarbons [PAHs], alkanes, alkenes, hopanes, and steranes) analyzed by thermal desorption-gas chromatography/mass spectrometry (TD-GC/MS).
The PMF-CMB solution found eight sources contributing to PM2.5 at the JST site, with secondary sulfate being the largest (average of 45% of PM2.5). Motor vehicle exhaust and biomass burning each contributed 19.4%. Coal combustion, road dust, secondary nitrate, and salt each contributed 4% or less. At the BHM site, the PMF-CMB solution attributed 43% to secondary sulfate, 21% to motor vehicle exhaust, 17.8% to biomass burning (including 11.3% to open burning and 6.5% to residential wood combustion [RWC]). Vegetative detritus contribution at BHM was 3.8%, higher than the 1.5% at JST. Road dust, industrial emissions, secondary nitrate, and salt contributed 6.2, 4.1, 2.2 and 0.8%, respectively. Coal combustion was not identified by PMF at the BHM site.
Based on the EV-CMB solution for individual samples, average motor vehicle exhaust contributions at JST were 0.81 ± 0.18 and 1.03 ± 0.49 µg/m3 with and without organic species, respectively. Corresponding contributions were 1.44 ± 0.19 and 2.6 ± 0.9 µg/m3 for biomass burning and 1.60 ± 0.23 and 2.0 ± 0.5 µg/m3 for cooking, respectively. For BHM, estimated motor vehicle exhaust, biomass burning, and cooking contributions were nearly a factor of 2 lower when organic species were included in the model.
The EV-CMB results indicate that the abundances of organic species were elevated in the source profiles compared with actual source emissions affecting the JST and BHM samples. Nonetheless, comparison with a previous source apportionment study in Atlanta showed similar motor vehicle exhaust contributions to PM2.5 mass, with a factor of 2 higher cooking contribution, and a higher biomass burning contribution found in the current study.
Acknowledgment
The authors wish to thank Iris Saltus of the Desert Research Institute for manuscript preparation and editing.
Funding
This research was sponsored by the Electric Power Research Institute, Palo Alto, CA, Contract Number EP-P41625/C18286.
Supplemental Material
Supplemental data for this article can be accessed on the publisher’s website.
Supplemental Material
Download Zip (973.5 KB)Additional information
Funding
Notes on contributors
John G. Watson
John G. Watson, Judith C. Chow, and Douglas H. Lowenthal are Research Professors at the Desert Research Institute (DRI), part of the Nevada System of Higher Education.
Judith C. Chow
John G. Watson, Judith C. Chow, and Douglas H. Lowenthal are Research Professors at the Desert Research Institute (DRI), part of the Nevada System of Higher Education.
Douglas H. Lowenthal
John G. Watson, Judith C. Chow, and Douglas H. Lowenthal are Research Professors at the Desert Research Institute (DRI), part of the Nevada System of Higher Education.
L.-W. Antony Chen
L.-W. Antony Chen is an Assistant Professor at the University of Nevada, Las Vegas, and a DRI Affiliate Professor.
Stephanie Shaw
Stephanie Shaw is a Senior Technical Leader at the Electric Power Research Institute.
Eric S. Edgerton
Eric. S. Edgerton is President of Atmospheric Research & Analysis, Inc.
Charles L. Blanchard
Charles L. Blanchard is a Principal of Envair Corporation.
Related Research Data
References
- Andren, A.W., D.H. Klein, and K. Talmi. 1975. Selenium in coal-fired steam plant emissions. Environ. Sci. Technol. 9:856–858. doi:10.1021/es60107a002
- Balachandran, S., J.E. Pachon, Y.T. Hu, D. Lee, J.A. Mulholland, and A.G. Russell. 2012. Ensemble-trained source apportionment of fine particulate matter and method uncertainty analysis. Atmos. Environ. 61:387–394. doi:10.1016/j.atmosenv.2012.07.031
- Blanchard, C.L., J.C. Chow, E.S. Edgerton, J.G. Watson, G.M. Hidy, and S. Shaw. 2014. Organic aerosols in the southeastern United States: Speciated particulate carbon measurements from the SEARCH network, 2006 to 2010. Atmos. Environ. 95:327–333. doi:10.1016/j.atmosenv.2014.06.050
- Blanchard, C.L., S. Tanenbaum, and G.M. Hidy. 2013. Source attribution of air pollutant concentrations and trends in the Southeastern Aerosol Research and Characterization (SEARCH) network. Environ. Sci. Technol. 47:13536–13545. doi:10.1021/es402876s
- Brinkman, G., G. Vance, M.P. Hannigan, and J.B. Milford. 2006. Use of synthetic data to evaluate positive matrix factorization as a source apportionment tool for PM2.5 exposure data. Environ. Sci. Technol. 40:1892–1901. doi:10.1021/es051712y
- Chan, T., and M. Lippmann. 1977. Particle collection efficiencies of sampling cyclones: An empirical theory. Environ. Sci. Technol. 11:377–386. doi:10.1021/es60127a003
- Chen, L.-W.A., J.C. Chow, X.L. Wang, J.A. Robles, B.J. Sumlin, D.H. Lowenthal, and J.G. Watson. 2015. Multi-wavelength optical measurement to enhance thermal/optical analysis for carbonaceous aerosol. Atmos. Meas. Tech. 8:451–461. doi:10.5194/amt-8-451-2015
- Chen, L.-W.A., D.H. Lowenthal, J.G. Watson, D. Koracin, N. Kumar, E.M. Knipping, N. Wheeler, K. Craig, and S. Reid. 2010. Toward effective source apportionment using positive matrix factorization: Experiments with simulated PM2.5 data. J. Air Waste Manage. Assoc. 60:43–54. doi:10.3155/1047-3289.60.1.43
- Chen, L.-W.A., J.G. Watson, J.C. Chow, D.W. DuBois, and L. Herschberger. 2011. PM2.5 source apportionment: Reconciling receptor models for U.S. non-urban and urban long-term networks. J. Air Waste Manage. Assoc. 61:1204–1217. doi:10.1080/10473289.2011.619082
- Chen, L.-W.A., J.G. Watson, J.C. Chow, and K.L. Magliano. 2007. Quantifying PM2.5 source contributions for the San Joaquin Valley with multivariate receptor models. Environ. Sci. Technol. 41:2818–2826. doi:10.1021/es0525105
- Chow, J.C., J.P. Engelbrecht, J.G. Watson, W.E. Wilson, N.H. Frank, and T. Zhu. 2002a. Designing monitoring networks to represent outdoor human exposure. Chemosphere 49:961–978. doi:10.1016/S0045-6535(02)00239-4
- Chow, J.C., and J.G. Watson. 1999. Ion chromatography in elemental analysis of airborne particles. Elemental Analysis of Airborne Particles, vol. 1, 97–137. Amsterdam: Gordon and Breach Science.
- Chow, J.C., J.G. Watson, J.L. Bowen, C.A. Frazier, A.W. Gertler, K.K. Fung, D. Landis, and L.L. Ashbaugh. 1993. A sampling system for reactive species in the western United States. Sampling and Analysis of Airborne Pollutants, 209–228. Ann Arbor, MI: Lewis Publishers.
- Chow, J.C., J.G. Watson, L.-W.A. Chen, M.-C.O. Chang, N.F. Robinson, D.L. Trimble, and S.D. Kohl. 2007c. The IMPROVE_A temperature protocol for thermal/optical carbon analysis: Maintaining consistency with a long-term database. J. Air Waste Manage. Assoc. 57:1014–1023. doi:10.3155/1047-3289.57.9.1014
- Chow, J.C., J.G. Watson, L.-W.A. Chen, J. Rice, and N.H. Frank. 2010. Quantification of PM2.5 organic carbon sampling artifacts in US networks. Atmos. Chem. Phys. 10:5223–5239. doi:10.5194/acp-10-5223-2010
- Chow, J.C., J.G. Watson, S.A. Edgerton, and E. Vega. 2002b. Chemical composition of PM10 and PM2.5 in Mexico City during winter 1997. Sci. Total Environ. 287:177–201. doi:10.1016/S0048-9697(01)00982-2
- Chow, J.C., J.G. Watson, H.D. Kuhns, V.R. Etyemezian, D.H. Lowenthal, D.J. Crow, S.D. Kohl, J.P. Engelbrecht, and M.C. Green. 2004. Source profiles for industrial, mobile, and area sources in the Big Bend Regional Aerosol Visibility and Observational (BRAVO) Study. Chemosphere 54:185–208. doi:10.1016/j.chemosphere.2003.07.004
- Chow, J.C., J.G. Watson, D.H. Lowenthal, L.-W.A. Chen, B. Zielinska, L.R. Mazzoleni, and K.L. Magliano. 2007a. Evaluation of organic markers for chemical mass balance source apportionment at the Fresno supersite. Atmos. Chem. Phys. 7:1741–1754. doi:10.5194/acp-7-1741-2007
- Chow, J.C., J.G. Watson, J. Robles, X.L. Wang, L.-W.A. Chen, D.L. Trimble, S.D. Kohl, R.J. Tropp, and K.K. Fung. 2011. Quality assurance and quality control for thermal/optical analysis of aerosol samples for organic and elemental carbon. Anal. Bioanal. Chem. 401:3141–3152.
- Chow, J.C., J.Z. Yu, J.G. Watson, S.S.H. Ho, T.L. Bohannan, M.D. Hays, and K.K. Fung. 2007b. The application of thermal methods for determining chemical composition of carbonaceous aerosols: A review. J. Environ. Sci. Health A 42:1521–1541. doi:10.1080/10934520701513365
- Christensen, W.F., and J.J. Schauer. 2008a. Impact of species uncertainty perturbation on the solution stability of positive matrix factorization of atmospheric particulate matter data. Environ. Sci. Technol. 42:6015–6021. doi:10.1021/es800085t
- Christensen, W.F., and J.J. Schauer. 2008b. Quantifying and manipulating species influence in positive matrix factorization. Chemometr. Intell. Lab. Syst. 94:140–148. doi:10.1016/j.chemolab.2008.07.004
- Christopher, S.A., P. Gupta, U. Nair, T.A. Jones, S. Kondragunta, Y.L. Wu, J.L. Hand, and X.Y. Zhang. 2009. Satellite remote sensing and mesoscale modeling of the 2007 Georgia/Florida fires. IEEE J. Selected Topics Appl. Earth Observ. Remote Sens. 2:163–175. doi:10.1109/JSTARS.2009.2026626
- Couvidat, F., K. Sartelet, and C. Seigneur. 2013. Investigating the impact of aqueous-phase chemistry and wet deposition on organic aerosol formation using a molecular surrogate modeling approach. Environ. Sci. Technol. 47:914–922. doi:10.1021/es3034318
- Dabek-Zlotorzynska, E., T.F. Dann, P.K. Martinelango, V. Celo, J.R. Brook, D. Mathieu, L.Y. Ding, and C.C. Austin. 2011. Canadian National Air Pollution Surveillance (NAPS) PM2.5 speciation program: Methodology and PM2.5 chemical composition for the years 2003–2008. Atmos. Environ. 45:673–686. doi:10.1016/j.atmosenv.2010.10.024
- Daisey, J.M., J.L. Cheney, and P.J. Lioy. 1986. Profiles of organic particulate emissions from air pollution sources: Status and needs for receptor source apportionment modeling. J. Air Pollut. Control Assoc. 36:17–33. doi:10.1080/00022470.1986.10466041
- Diab, J., T. Streibel, F. Cavalli, S.C. Lee, H. Saathoff, T. Mamakos, J.C. Chow, L.-W.A. Chen, J.G. Watson, O. Sippula, and R. Zimmermann. 2014. Hyphenation of a EC/OC thermal-optical carbon analyzer to photo ionization time-of-flight mass spectrometry: A new off-line aerosol mass spectrometric approach for characterization of primary and secondary particulate matter. Atmos. Meas. Tech. Discuss. In press. doi:10.5194/amtd-8-269-2015
- Duce, R.A., G.L. Hoffman, and W.H. Zoller. 1975. Atmospheric trace metals at remote Northern and Southern Hemisphere sites: Pollution or natural? Science 187:59–61. doi:10.1126/science.187.4171.59
- Eatough, D.J., R.J. Farber, and J.G. Watson. 2000. Second-generation chemical mass balance source apportionment of sulfur oxides and sulfate at the Grand Canyon during the Project MOHAVE summer intensive. J. Air Waste Manage. Assoc. 50:759–774. doi:10.1080/10473289.2000.10464113
- Edgerton, E.S., B.E. Hartsell, R.D. Saylor, J.J. Jansen, D.A. Hansen, and G.M. Hidy. 2005. The Southeastern Aerosol Research and Characterization Study part II: Filter-based measurements of fine and coarse particulate matter mass and composition. J. Air Waste Manage. Assoc. 55:1527–1542. doi:10.1080/10473289.2005.10464744
- Edgerton, E.S., B.E. Hartsell, R.D. Saylor, J.J. Jansen, D.A. Hansen, and G.M. Hidy. 2006. The Southeastern Aerosol Research and Characterization Study, part 3: Continuous measurements of fine particulate matter mass and composition. J. Air Waste Manage. Assoc. 56:1325–1341. doi:10.1080/10473289.2006.10464585
- England, G.C., J.G. Watson, J.C. Chow, B. Zielinska, M.-C.O. Chang, K.R. Loos, and G.M. Hidy. 2007. Dilution-based emissions sampling from stationary sources: Part 1. Compact sampler, methodology and performance. J. Air Waste Manage. Assoc. 57:65–78. doi:10.1080/10473289.2007.10465291
- Fujita, E.M., D.E. Campbell, W.P. Arnott, J.C. Chow, and B. Zielinska. 2007. Evaluations of the chemical mass balance method for determining contributions of gasoline and diesel exhaust to ambient carbonaceous aerosols. J. Air Waste Manage. Assoc. 57:721–740. doi:10.3155/1047-3289.57.6.721
- Grabowsky, J., T. Streibel, M. Sklorz, J.C. Chow, A. Mamakos, and R. Zimmermann. 2011. Hyphenation of a carbon analyzer to photo-ionization mass spectrometry to unravel the organic composition of particulate matter on a molecular level. Anal. Bioanal. Chem. 401:3153–3164. doi:10.1007/s00216-011-5425-1
- Green, M.C., L-W.A. Chen, D.W. DuBois, and J.V. Molenar. 2012. Fine particulate matter and visibility in the Lake Tahoe Basin: Chemical characterization, trends, and source apportionment. J. Air Waste Manage. Assoc. 62:953–965. doi:10.1080/10962247.2012.690362
- Habre, R., B. Coull, and P. Koutrakis. 2011. Impact of source collinearity in simulated PM(2.5) data on the PMF receptor model solution. Atmos. Environ. 45:6938–6946. doi:10.1016/j.atmosenv.2011.09.034
- Hansen, D.A., E.S. Edgerton, B.E. Hartsell, J.J. Jansen, N. Kandasamy, G.M. Hidy, and C.L. Blanchard. 2003. The Southeastern Aerosol Research and Characterization Study: Part 1—Overview. J. Air Waste Manage. Assoc. 53:1460–1471. doi:10.1080/10473289.2003.10466318
- Hays, M.D., and R.J. Lavrich. 2007. Developments in direct thermal extraction gas chromatography-mass spectrometry of fine aerosols. Trends Anal. Chem. 26:88–102. doi:10.1016/j.trac.2006.08.007
- Hemann, J.G., G.L. Brinkman, S.J. Dutton, M.P. Hannigan, J.B. Milford, and S.L. Miller. 2009. Assessing positive matrix factorization model fit: A new method to estimate uncertainty and bias in factor contributions at the measurement time scale. Atmos. Chem. Phys. 9:497–513. doi:10.5194/acp-9-497-2009
- Henry, R.C., and E.R. Christensen. 2010. Selecting an appropriate multivariate source apportionment model result. Environ. Sci. Technol. 44:2474–2481. doi:10.1021/es9018095
- Hidy, G.M., C.L. Blanchard, K. Baumann, E. Edgerton, S. Tannenbaum, S. Shaw, E. Knipping, I. Tombach, J. Jansen, and J. Walters. 2014. Chemical climatology of the southeastern United States, 1999–2013. Atmos. Chem. Phys. 14:11893–11914. doi:10.5194/acp-14-11893-2014
- Hildemann, L.M., G.R. Cass, and G.R. Markowski. 1989. A dilution stack sampler for collection of organic aerosol emissions: Design, characterization and field tests. Aerosol Sci. Technol. 10:193–204. doi:10.1080/02786828908959234
- Hildemann, L.M., G.R. Markowski, and G.R. Cass. 1991. Chemical composition of emissions from urban sources of fine organic aerosol. Environ. Sci. Technol. 25:744–759. doi:10.1021/es00016a021
- Ho, S.S.H., K.F. Ho, S.X. Liu, W.D. Liu, S.C. Lee, K.K. Fung, J.J. Cao, R.J. Zhang, Y. Huang, N.S.Y. Feng, and Y. Cheng. 2012. Quantification of carbonate carbon in aerosol filter samples using a modified thermal/optical carbon analyzer (M-TOCA). Anal. Methods 4:2578–2584.
- Ho, S.S.H., and J.Z. Yu. 2004. In-injection port thermal desorption and subsequent gas chromatography-mass spectrometric analysis of polycyclic aromatic hydrocarbons and n-alkanes in atmospheric aerosol samples. J. Chromatogr. A 1059:121–129. doi:10.1016/j.chroma.2004.10.013
- Ho, S.S.H., J.Z. Yu, J.C. Chow, B. Zielinska, J.G. Watson, E.H.L. Sit, and J.J. Schauer. 2008. Evaluation of an in-injection port thermal desorption-gas chromatography/mass spectrometry method for analysis of non-polar organic compounds in ambient aerosol samples. J. Chromatogr. A 1200:217–227. doi:10.1016/j.chroma.2008.05.056
- IMPROVE. 2015. Interagency Monitoring of Protected Visual Environments. http://vista.cira.colostate.edu/IMPROVE (accessed July 14, 2015).
- Iyer, H.K., W.C. Malm, and R.A. Ahlbrandt. 1987. A mass balance method for estimating the fractional contributions of pollutants from various sources to a receptor site. Transactions, Visibility Protection: Research and Policy Aspects, 861–871. Pittsburgh, PA: Air Pollution Control Association.
- Jaoui, M., E. Corse, T.E. Kleindienst, J.H. Offenberg, M. Lewandowski, and E.O. Edney. 2006. Analysis of secondary organic aerosol compounds from the photooxidation of d-limonene in the presence of NOx and their detection in ambient PM2.5. Environ. Sci. Technol. 40:3819–3828. doi:10.1021/es052566z
- Ke, L., W. Liu, Y. Wang, A.G. Russell, E.S. Edgerton, and M. Zheng. 2008. Comparison of PM2.5 source apportionment using positive matrix factorization and molecular marker-based chemical mass balance. Sci. Total Environ. 394:290–302. doi:10.1016/j.scitotenv.2008.01.030
- Kim, E., and P.K. Hopke. 2007. Comparison between sample-species specific uncertainties and estimated uncertainties for the source apportionment of the speciation trends network data. Atmos. Environ. 41:567–575. doi:10.1016/j.atmosenv.2006.08.023
- Kuhns, H.D., M.-C.O.Chang, J.C. Chow, V.R. Etyemezian, L.-W.A. Chen, N.J. Nussbaum, S.K. Nathagoundenpalayam, T.C. Trimble, S.D. Kohl, M. MacLaren, M. Abu-Allaban, J.A. Gillies, and A.W. Gertler. 2004. Lake Tahoe Source Characterization Study, Desert Research Institute, Reno, NV.
- Lee, S., K. Baumann, J.J. Schauer, R.J. Sheesley, L.P. Naeher, S. Meinardi, D.R. Blake, E.S. Edgerton, A.G. Russell, and M. Clements. 2005. Gaseous and particulate emissions from prescribed burning in Georgia. Environ. Sci. Technol. 39:9049–9056. doi:10.1021/es051583l
- Lee, S., W. Liu, Y.H. Wang, A.G. Russell, and E.S. Edgerton. 2008. Source apportionment of PM2.5: Comparing PMF and CMB results for four ambient monitoring sites in the southeastern United States. Atmos. Environ. 42:4126–4137. doi:10.1016/j.atmosenv.2008.01.025
- Lee, S., and A.G. Russell. 2007. Estimating uncertainties and uncertainty contributors of CMB PM2.5 source apportionment results. Atmos. Environ. 41:9616–9624. doi:10.1016/j.atmosenv.2007.08.022
- Lingwall, J.W., and W.F. Christensen. 2007. Pollution source apportionment using a priori information and positive matrix factorization. Chemometr. Intell. Lab. Syst. 87:281–294. doi:10.1016/j.chemolab.2007.03.007
- Liu, W., Y.H. Wang, A. Russell, and E.S. Edgerton. 2006. Enhanced source identification of southeast aerosols using temperature-resolved carbon fractions and gas phase components. Atmos. Environ. 40(Suppl. 2):S445–S466. doi:10.1016/j.atmosenv.2005.11.079
- Lowenthal, D.H., J.G. Watson, D. Koracin, L.-W.A. Chen, D.W. DuBois, R. Vellore, N. Kumar, E.M. Knipping, N. Wheeler, K. Craig, and S. Reid. 2010. Evaluation of regional scale receptor modeling. J. Air Waste Manage. Assoc. 60:26–42. doi:10.3155/1047-3289.60.1.26
- Malm, W.C., J.F. Sisler, D. Huffman, R.A. Eldred, and T.A. Cahill. 1994. Spatial and seasonal trends in particle concentration and optical extinction in the United States. J. Geophys. Res. 99(D1):1347–1370. doi:10.1029/93JD02916
- Marmur, A., S.K. Park, J.A. Mulholland, P.E. Tolbert, and A.G. Russell. 2006. Source apportionment of PM2.5 in the southeastern United States using receptor and emissions-based models: Conceptual differences and implications for time-series health studies. Atmos. Environ. 40:2533–2551. doi:10.1016/j.atmosenv.2005.12.019
- Mason, B. 1966. Principles of Geochemistry, 3rd ed. New York: Wiley.
- Mazurek, M.A., B.R.T. Simoneit, G.R. Cass, and H.A. Gray. 1987. Quantitative high-resolution gas chromatography and high-resolution gas chromatography/mass spectrometry analyses of carbonaceous fine aerosol particles. Int. J. Environ. Anal. Chem. 29:119–139. doi:10.1080/03067318708078415
- Miller, S.L., M.J. Anderson, E.P. Daly, and J.B. Milford. 2002. Source apportionment of exposures to volatile organic compounds. I. Evaluation of receptor models using simulated exposure data. Atmos. Environ. 36:3629–3641. doi:10.1016/S1352-2310(02)00279-0
- Mooibroek, D., M. Schaap, E.P. Weijers, and R. Hoogerbrugge. 2011. Source apportionment and spatial variability of PM(2.5) using measurements at five sites in The Netherlands. Atmos. Environ. 45:4180–4191. doi:10.1016/j.atmosenv.2011.05.017
- Orasche, J., J. Schnelle-Kreis, G. Abbaszade, and R. Zimmermann. 2011. Technical Note: In-situ derivatization thermal desorption GC-TOFMS for direct analysis of particle-bound non-polar and polar organic species. Atmos. Chem. Phys. 11:8977–8993. doi:10.5194/acp-11-8977-2011
- Paatero, P., and U. Tapper. 1994. Positive matrix factorization: A non-negative factor model with optimal utilization of error estimates of data values. Environmetrics 5:111–126. doi:10.1002/env.3170050203
- Peters, T.M., R.W. Vanderpool, and R.W. Wiener. 2001. Design and calibration of the EPA PM2.5 well impactor ninety-six (WINS). Aerosol Sci. Technol. 34:389–397. doi:10.1080/027868201750172752
- Ramdahl, T. 1983. Retene-A molecular marker of wood combustion in ambient air. Nature 306:580–582. doi:10.1038/306580a0
- Reff, A., S.I. Eberly, and P.V. Bhave. 2007. Receptor modeling of ambient particulate matter data using positive matrix factorization: Review of existing methods. J. Air Waste Manage. Assoc. 57:146–154. doi:10.1080/10473289.2007.10465319
- Roscoe, B.A., P.K. Hopke, S.L. Dattner, and J.M. Jenks. 1982. The use of principal component factor analysis to interpret particulate compositional data sets. J. Air Pollut. Control Assoc. 32:637–642. doi:10.1080/00022470.1982.10465439
- Sakata, M., M. Kurata, and N. Tanaka. 2000. Estimating contribution from municipal solid waste incineration to trace metal concentrations in Japanese urban atmosphere using lead as a marker element. Geochem. J. 34:23–32. doi:10.2343/geochemj.34.23
- Schauer, J.J., W.F. Rogge, M.A. Mazurek, L.M. Hildemann, G.R. Cass, and B.R.T. Simoneit. 1996. Source apportionment of airborne particulate matter using organic compounds as tracers. Atmos. Environ. 30:3837–3855. doi:10.1016/1352-2310(96)00085-4
- Shen, G.F., S. Tao, S.Y. Wei, Y.Y. Zhang, R. Wang, B. Wang, W. Li, H.Z. Shen, Y. Huang, Y.F. Yang, W. Wang, X.L. Wang, and S.L.M. Simonich. 2012. Retene emission from residential solid fuels in China and evaluation of retene as a unique marker for soft wood combustion. Environ. Sci. Technol. 46:4666–4672. doi:10.1021/es300144m
- Sheya, S.A., C. Glowacki, M.-C.O. Chang, J.C. Chow, and J.G. Watson. 2008. Hot filter/impinger and dilution sampling for fine particulate matter characterization from ferrous metal casting processes. J. Air Waste Manage. Assoc. 58:553–561. doi:10.3155/1047-3289.58.4.553
- Thurston, G.D., and J.D. Spengler. 1985. A quantitative assessment of source contributions to inhalable particulate matter pollution in metropolitan Boston. Atmos. Environ. 19:9–25. doi:10.1016/0004-6981(85)90132-5
- Tian, D., Y.T. Hu, Y.H. Wang, J.W. Boylan, M. Zheng, and A.G. Russell. 2009. Assessment of biomass burning emissions and their impacts on urban and regional PM2.5: A Georgia case study. Environ. Sci. Technol. 43:299–305. doi:10.1021/es801827s
- Truex, T.J., W.R. Pierson, D.E. McKee, M. Shelef, and R.E. Baker. 1980. Effects of barium fuel additive and fuel sulfur level on diesel particulate emissions. Environ. Sci. Technol. 14:1121–1124. doi:10.1021/es60169a018
- Turley, C.D., D.L. Brenchley, and R.R. Landolt. 1973. Barium additives as diesel smoke suppressants. J. Air Pollut. Control Assoc. 23:783–787. doi:10.1080/00022470.1973.10469844
- U.S. Environmental Protection Agency. 1989. Ambient air monitoring reference and equivalent methods; Reference method designation. Fed. Regist. 54:12273.
- U.S. Environmental Protection Agency. 1999. Compendium Method IO-3.5: Determination of metals in ambient particulate matter using inductively coupled plasma/mass spectrometry (ICP/MS). EPA/625/R-96/010a. http://www.epa.gov/ttn/amtic/files/ambient/inorganic/mthd-3-5.pdf.
- U.S. Environmental Protection Agency. 2000. Method 5. Particulate matter (PM), Determination of particulate matter emissions from stationary sources. http://www.epa.gov/ttn/emc/promgate/m-05.pdf (accessed July 14, 2015).
- U.S. Environmental Protection Agency. 2004. Chemical Mass Balance (CMB) Model. http://www.epa.gov/ttn/scram/receptor_cmb.htm (accessed July 14, 2015).
- U.S. Environmental Protection Agency. 2007. Guidance on the use of models and other analyses for demonstrating attainment of air quality goals for ozone, PM2.5, and regional haze. EPA-454/B-07-002. http://www.epa.gov/ttn/scram/guidance/guide/final-03-pm-rh-guidance.pdf (accessed July 14, 2015).
- U.S. Environmental Protection Agency. 2010. EPA Positive Matrix Factorization (PMF) 3.0 model. http://www.epa.gov/heasd/products/pmf/pmf.html (accessed July 14, 2015).
- U.S. Environmental Protection Agency. 2014a. Chemical speciation. http://www.epa.gov/ttn/amtic/speciepg.html (accessed July 14, 2015).
- U.S. Environmental Protection Agency. 2014b. EPA Positive Matrix Factorization (PMF) 5.0 model. http://www.epa.gov/heasd/research/pmf.html (accessed July 14, 2015).
- U.S. Environmental Protection Agency. 2014c. SPECIATE version 4.4. http://www.epa.gov/ttn/chief/software/speciate/index.html (accessed July 14, 2015).
- van Eijck, A., T. Opatz, D. Taraborrelli, R. Sander, and T. Hoffmann. 2013. New tracer compounds for secondary organic aerosol formation from beta-caryophyllene oxidation. Atmos. Environ. 80:122–130. doi:10.1016/j.atmosenv.2013.07.060
- Wang, X.L., J.G. Watson, J.C. Chow, S. Gronstal, and S.D. Kohl. 2012a. An efficient multipollutant system for measuring real-world emissions from stationary and mobile sources. Aerosol Air Qual Res. 12:145–160. doi:10.4209/aaqr.2011.11.0187
- Wang, X.L., J.G. Watson, J.C. Chow, S.D. Kohl, L.-W.A. Chen, D.A. Sodeman, A.H. Legge, and K.E. Percy. 2012b. Measurement of real-world stack emissions with a dilution sampling system. Alberta Oil Sands: Energy, Industry, and the Environment, 171–192. Amsterdam, The Netherlands: Elsevier Press.
- Watson, J.G. 2004. Protocol for applying and validating the CMB model for PM2.5 and VOC. EPA-451/R-04-001. www.epa.gov/scram001/models/receptor/CMB_Protocol.pdf (accessed July 14, 2015).
- Watson, J.G., L.-W.A. Chen, J.C. Chow, D.H. Lowenthal, and P. Doraiswamy. 2008. Source apportionment: Findings from the U.S. Supersite Program. J. Air Waste Manage. Assoc. 58:265–288. doi:10.3155/1047-3289.58.2.265
- Watson, J.G., and J.C. Chow. 2015. Receptor models and measurements for identifying and quantifying air pollution sources. Introduction to Environmental Forensics, 3rd edition, 677–706. Amsterdam, The Netherlands: Elsevier.
- Watson, J.G., J.C. Chow, L.-W.A. Chen, and N.H. Frank. 2009. Methods to assess carbonaceous aerosol sampling artifacts for IMPROVE and other long-term networks. J. Air Waste Manage. Assoc. 59:898–911. doi:10.3155/1047-3289.59.8.898
- Watson, J.G., J.C. Chow, and C.A. Frazier. 1999. X-ray fluorescence analysis of ambient air samples. Elemental Analysis of Airborne Particles, vol. 1, 67–96. Amsterdam, The Netherlands: Gordon and Breach Science.
- Watson, J.G., J.C. Chow, D.H. Lowenthal, N.F. Robinson, C.F. Cahill, and D.L. Blumenthal. 2002. Simulating changes in source profiles from coal-fired power stations: Use in chemical mass balance of PM2.5 in the Mt. Zirkel Wilderness. Energy Fuels 16:311–324. doi:10.1021/ef010202w
- Watson, J.G., J.C. Chow, F.W. Lurmann, and S. Musarra. 1994. Ammonium nitrate, nitric acid, and ammonia equilibrium in wintertime Phoenix, Arizona. J. Air Waste Manage. Assoc. 44:405–412. doi:10.1080/10473289.1999.10463837
- Watson, J.G., J.C. Chow, X.L. Wang, S.D. Kohl, L.-W.A. Chen, and V.R. Etyemezian. 2012. Overview of real-world emission characterization methods. Alberta Oil Sands: Energy, Industry, and the Environment, 145–170. Amsterdam, The Netherlands: Elsevier Press.
- Watson, J.G., J.A. Cooper, and J.J. Huntzicker. 1984. The effective variance weighting for least squares calculations applied to the mass balance receptor model. Atmos. Environ. 18:1347–1355. doi:10.1016/0004-6981(84)90043-X
- Watson, J.G., B.J. Turpin, and J.C. Chow. 2001. The measurement process: Precision, accuracy, and validity. Air Sampling Instruments for Evaluation of Atmospheric Contaminants, ninth edition, 201–216. Cincinnati, OH: American Conference of Governmental Industrial Hygienists.
- Zhang, X.Y., Y.Q. Wang, T. Niu, X.C. Zhang, S.L. Gong, Y.M. Zhang, and J.Y. Sun. 2012. Atmospheric aerosol compositions in China: Spatial/temporal variability, chemical signature, regional haze distribution and comparisons with global aerosols. Atmos. Chem. Phys. 12:779–799. doi:10.5194/acp-12-779-2012
- Zhang, Y.X., R.J. Sheesley, M.S. Bae, and J.J. Schauer. 2009. Sensitivity of a molecular marker based positive matrix factorization model to the number of receptor observations. Atmos. Environ. 43:4951–4958. doi:10.1016/j.atmosenv.2009.07.009
- Zheng, M., G.R. Cass, L. Ke, F. Wang, J.J. Schauer, E.S. Edgerton, and A.G. Russell. 2007. Source apportionment of daily fine particulate matter at Jefferson street, Atlanta, GA, during summer and winter. J. Air Waste Manage. Assoc. 57:228–242. doi:10.1080/10473289.2007.10465322
- Zheng, M., G.R. Cass, J.J. Schauer, and E.S. Edgerton. 2002. Source apportionment of PM2.5 in the southeastern United States using solvent-extractable organic compounds as tracers. Environ. Sci. Technol. 36:2361–2371. doi:10.1021/es011275x
- Zheng, M., L. Ke, E.S. Edgerton, J.J. Schauer, M.Y. Dong, and A.G. Russell. 2006. Spatial distribution of carbonaceous aerosol in the southeastern United States using molecular markers and carbon isotope data. J.Geophys Res. Atmos. 111(D10):D10S06. doi:10.1029/2005JD006777