
ABSTRACT
Most homes in the Navajo Nation use wood as their primary heating fuel, often in combination with locally mined coal. Previous studies observed health effects linked to this solid-fuel use in several Navajo communities. Emission factors (EFs) for common fuels used by the Navajo have not been reported using a relevant stove type. In this study, two softwoods (ponderosa pine and Utah juniper) and two high-volatile bituminous coals (Black Mesa and Fruitland) were tested with an in-use residential conventional wood stove (homestove) using a modified American Society for Testing and Materials/U.S. Environmental Protection Agency (ASTM/EPA) protocol. Filter sampling quantified PM2.5 (particulate matter with an aerodynamic diameter ≤2.5 μm) and organic (OC) and elemental (EC) carbon in the emissions. Real-time monitoring quantified carbon monoxide (CO), carbon dioxide (CO2), and total suspended particles (TSP). EFs for these air pollutants were developed and normalized to both fuel mass and energy consumed. In general, coal had significantly higher mass EFs than wood for all pollutants studied. In particular, coal emitted, on average, 10 times more PM2.5 than wood on a mass basis, and 2.4 times more on an energy basis. The EFs developed here were based on fuel types, stove design, and operating protocols relevant to the Navajo Nation, but they could be useful to other Native Nations with similar practices, such as the nearby Hopi Nation.
Implications: Indoor wood and coal combustion is an important contributor to public health burdens in the Navajo Nation. Currently, there exist no emission factors representative of Navajo homestoves, fuels, and practices. This study developed emission factors for PM2.5, OC, EC, CO, and CO2 using a representative Navajo homestove. These emission factors may be utilized in regional-, national-, and global-scale health and environmental models. Additionally, the protocols developed and results presented here may inform on-going stove design of the first EPA-certified wood and coal combination stove.
Introduction
Household air pollution (HAP) is the leading environmental health risk factor worldwide (World Health Organization, Citation2016) and is responsible for 2.8 million premature deaths each year (Forouzanfar et al., Citation2015). Residential solid fuel combustion is the primary contributor to HAP (Smith et al., Citation2014) and the second largest contributor to ambient black carbon, an important climate forcer (Bond et al., Citation2013). Solid fuels range from agricultural and animal waste to fossil fuels such as coal. Their use in the United States is closely linked to socioeconomic status and the “energy ladder” model, which suggests that households transition from biomass to cleaner-burning fuels as income increases (Hosier and Dowd, Citation1987; Smith, Citation1990). Acute and chronic exposures to wood and coal smoke are associated with adverse health impacts through a significant body of epidemiologic and toxicologic evidence (Naeher et al., Citation2007). Use of unprocessed coal in homes has been strongly discouraged by the World Health Organization (Citation2014), citing evidence of links to lung cancer (International Agency for Research on Cancer, Citation2010).
Between 500,000 and 600,000 low-income Americans are exposed to HAP from solid-fuel use (Rogalsky et al., Citation2014), 12–15% of whom reside in the Navajo Nation (NN) (U.S. Census Bureau, Citation2014, Citation2015). Wood is the most common heating fuel in the NN, used in 62% of all Navajo homes and 89% of those in rural areas (Arizona Rural Policy Institute, Citation2010; U.S. Census Bureau, Citation2015). Wood is affordable, widely available within the reservation, and culturally significant to the Navajo (Champion et al., Citation2017). High-volatile bituminous coal (Kirschbaum and Biewick, Citation2000) is provided at no cost to residents near mines (Hickmott et al., Citation1997; Bunnell et al., Citation2010). Many Navajo homes burn wood and coal in combination using homestoves (i.e., residential noncatalytic wood stoves) that are old and/or leaky (Bunnell et al., Citation2010), impacting indoor air quality in many Navajo homes.
Bunnell et al. (Citation2010) found that 19 coal-burning homes in Shiprock, New Mexico, had a mean indoor 24-hr fine particulate matter (aerodynamic diameter ≤2.5 μm; PM2.5) concentration much higher than one propane-burning home studied (38 vs. 0.29 µg/m3). Previously, Robin et al. (Citation1996) reported higher median PM10 concentrations in wood-burning Navajo homes compared with homes that used gas or electric heating (101 vs. 22 µg/m3). Their reported sampling period was overnight (15 hr).
Studies in Tuba City, Arizona (Morris et al., Citation1990), and Ft. Defiance, Arizona (Robin et al., Citation1996), found homestove use to correlate with higher odds of acute lower respiratory illness (ALRI) among Navajo children below the age of 2. Similarly, Bunnell et al. (Citation2010) found higher hospitalization rates for respiratory illness in the winter compared with other seasons, likely due to indoor heating practices.
Wood and coal combustion in a homestove produces a complex mixture of health-damaging pollutants, including carbon monoxide (CO) and PM2.5 (Chen et al., Citation2005; Bäfver et al., Citation2011). This PM2.5 is composed mostly (>60% by mass) of organic and elemental carbon (OC and EC, respectively) (Obaidullah et al., Citation2014; Shen et al., Citation2014; Chen et al., Citation2016).
Emission factors (EFs) of these pollutants are used to model environmental and health benefits from modifications in residential wood combustion practices in ambient regional- (Reddy and Venkataraman, Citation2002) and global- (Junker and Liousse, Citation2006) scale applications. Reported EFs of particulate matter (PM) from conventional homestoves sold in the United States vary greatly among stove and fuel types, ranging from 3 to 30 g/kg for wood (Houck et al., Citation2008). Data from bituminous coal combustion for residential heating are limited, but previous studies reported EFs for PM from coal stoves between 2 and 15 g/kg (Butcher and Ellenbecker, Citation1982; Zhi et al., Citation2008; Shen et al., Citation2014; Chen et al., Citation2016).
Improved indoor air quality in Native American homes using U.S. Environmental Protection Agency (EPA)-certified homestoves has been measured in Idaho, where 24–48-hr mean indoor PM2.5 concentrations decreased from 39 to 19 μg/m3 following a stove change-out program (Ward et al., Citation2011). Controlled emission testing was not performed on the homestoves evaluated in that study; therefore, EFs for representative stoves in that Native American community are unavailable. Currently, there are no published EFs for in-use homestoves in Native Nations, including the NN.
Variability in EFs of PM from homestoves and cookstoves (i.e., cooking stoves) has been the primary source of uncertainty in emission inventories from these units (Streets et al., Citation2003; Bond et al., Citation2004). Homestove age (Houck et al., Citation2008), design (EPA, 1986), and operation (e.g., burn rate) (Jordan and Seen, Citation2005) strongly affect PM emissions. Older conventional homestoves are less efficient, larger homestoves emit more PM, and lower burn rates increase emissions. Many homestoves in the NN are old (Bunnell et al., Citation2010) or self-fabricated (Hickmott et al., Citation1997), and their emissions (from the practice of combined wood and coal combustion) are largely uncharacterized.
In this study, EFs for two wood types and two coal types commonly used in the NN were determined using an in-use Navajo homestove. Experiments were conducted at the University of Colorado emission standardization and testing (CUEST) facility. To the authors’ best knowledge, there are no published EFs for these fuels using a representative Navajo homestove.
Materials and methods
Homestove
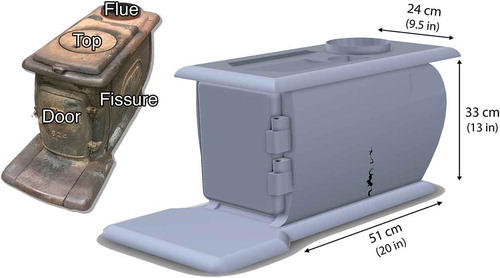
A residential wood homestove (King Martin Stove and Range Company, Florence, AL) was used in this study (). This cast iron unit was designed for wood combustion but had been used in Navajo homes to burn both wood and coal. This particular homestove unit was primarily used for heating, although some Navajo homes use wood and coal for both heating and cooking (Robin et al., Citation1996). The firebox is 33 cm (13 in) tall, 51 cm (20 in) long, 24 cm (9.5 in) wide, and had an internal firebox volume of 40 L (1.4 ft3). The homestove weighs 45 kg (99 lbs). Fissures are visible on the sidewalls (labeled in ) and likely affect its efficiency. A schematic of the homestove showing combustion air and flue gas flows is provided in Figure S1 in Supplemental Materials.
Figure 1. Navajo homestove with firebox dimensions.
Solid fuels
A total of four fuels commonly used in the NN were included in this study. Two softwood types that are easily available to Navajo residents (Robin et al., Citation1996) were tested: ponderosa pine (Pinus ponderosa) and Utah juniper (Juniperus osteosperma). Notably, some types of juniper are referred to as “cedar” according to local growing and harvesting customs. In addition, two high-volatile bituminous coal types commonly distributed by coal mines in the NN (Brown et al., Citation1996; Hickmott et al., Citation1997) were tested: Black Mesa (Grade C) and Fruitland (Grades B and C). Fuels were obtained from roadside vendors or delivery services in the NN. Characterization information about the fuels reported in the literature is presented in .
Table 1. Reported characterization and heating values of fuels tested (% dry-basis and BTU/lb).
Wood logs were cut into approximately 40 × 8 × 5 cm pieces. The average dry-basis wood moisture content (MC) was determined with a resistance-type moisture meter 15 min prior to each test. The average MC for ponderosa pine was 12% (SD = 3.5) and for Utah juniper was 5.7% (SD = 0.1). Coal was sorted into 5–10 cm in each dimension, and the MC values were assumed from the literature: 11.5% for Black Mesa (Affolter, Citation2000) and 8.3% for Fruitland (Arizona Bureau of Mines, Citation1977).
Experimental setup
The CUEST facility () was designed for total-capture emission testing of solid fuels. The closed test chamber was built with aluminum and glass and sealed with high-temperature resistant silicone (Rutland Fire Clay Company, Rutland, VA). Stove plus fuel weight was measured throughout the test with an Accu-weigh scale (301TDX/A-54; Metro Equipment Corporation, Sunnyvale, CA) to determine the beginning and end of testing phases. In-line isokinetic sampling was accomplished through three sampling ports located 241 cm (95 in) downstream of the test chamber, following EPA (1984) guidelines and allowing for a residence time of approximately 2.5 sec. Sampling lines were 0.64 cm (0.25 in) inside diameter (ID) Tygon tubing (Courbevoie, France). Lines leading to filter holders were 31 cm (12 in) long. A line leading to a portable emission monitoring system (PEMS) (Aprovecho Research Center, Cottage Grove, OR) was 305 cm (120 in); the additional length of sampling line was needed to allow the PEMS to be securely positioned and connected to a computer. Temperatures in the firebox (labeled T1 in ) and stove flue (T2) were measured with K-type thermocouples, and in the exhaust flue (T3) with an internal PEMS thermocouple. The PEMS was initially developed for field testing of cookstoves, where generally higher magnitude and variability in emission data are reported compared with laboratory results (Roden et al., Citation2009). It has also been used to determine EFs from laboratory settings (MacCarty et al., Citation2010; Medina et al., 2016), where high-emission episodes found in the field may not be reproduced well.
Figure 2. Schematic of CUEST experimental facility.
Sampling
PM2.5 was sampled with personal impactor filter packs (2000-25F-4-2.5; URG, Chapel Hill, NC) loaded with 25 mm filters. One pack (labeled “A” in ) contained a Zeflour polytetrafluoroethylene (PTFE) filter (Pall, Port Washington, NY) (0.5 μm pore size), selected for gravimetric and elemental analyses as well as in vitro studies (results not included here). Two packs in-series (labeled “B1” and “B2” in ) each contained single TissuQuartz quartz fiber filters (QFFs) (Pall), selected for analysis of OC and EC. Filter B2 was used to quantify positive artifacts from adsorption of semivolatile and volatile organics. Filter flow rate (4.0 liters per minute [lpm]) was maintained with MOA diaphragm vacuum pumps (Gast, Benton Harbor, MI) and measured with FL-series rotameters (OMEGA, Stamford, CT); adjustments to filter flow rate were made every 5 min if necessary. Following sampling, filters were transported in PTFE-sealed acid-washed Petri dishes on ice in a cooler and then stored at −20 °C until analyses.
Mean air dilution ratios (by mass) were 869:1 (SD = 231:1) for wood and 1680:1 (SD = 339:1) for coal during homestove testing, and sampling temperatures were near ambient conditions (Table S1). Lipsky and Robinson (Citation2006) determined that a dilution ratio of 100:1 was sufficient to reduce homestove exhaust temperatures to ambient conditions but may condense semivolatile organics and overestimate OC emissions (Pankow, Citation1994). A previous cookstove study used dilution ratios as low as 24:1 (Roden et al., Citation2009), below the expected real-world conditions for combustion systems (Zhang and Wexler, Citation2004). Kortelainen et al. (Citation2015) tested a wood chip burner at dilution ratios as high as 2000:1. High dilution ratio can affect air velocities near the combustion chamber of the stove and impact its performance, with higher velocities promoting convection but potentially increasing ignition time (Bilbao et al., Citation2001). In this study, homestove testing utilized a closed door to minimize this effect.
Monitoring was conducted at 4.8 lpm using the PEMS for real-time (0.5 Hz) concentrations of CO, carbon dioxide (CO2), and total suspended particles (TSP). PEMS sensor types are electrochemical for CO, nondispersive infrared (NDIR) for CO2, and optical light-scattering for TSP (MacCarty et al., Citation2010). Room CO2 concentration was measured continuously (1 Hz) with a TelAire 7001 NDIR monitor (GE, Billerica, MA) correlated to the PEMS CO2 sensor. Co-integration (i.e., ability of one time-series data set to predict another data set) was determined with the Engle-Granger test (Engle and Granger, Citation1987).
It is important to note that although flue oxygen (O2) concentration is useful for comparing concentrations observed in emission studies, flue O2 was not monitored in this study. McDonald et al. (Citation2000) assumed 19% O2 concentration for fireplace and homestove emission testing, with dilution ratios ranging from 20 to 70. The dilution ratios in this study were much higher (summarized in Table S1); therefore, O2 concentrations would be expected to be closer to ambient conditions (i.e., 20.9% v/v).
Prior to each test, filter packs and sampling lines were washed for organics analysis. PTFE filters and Petri dishes were washed for trace metals analysis (Majestic et al., Citation2012). Calibrations for filter flow rates, gas sensors, and thermocouples were performed every 10 tests. Washing and calibration protocols are provided in Supplemental Materials.
Filter analyses
Gravimetric analysis (PM2.5) was performed on the PTFE filters following conditioning for 24–36 hr at 75–81 °F and 25–50% relative humidity (RH) based on published protocols (Dutton et al., Citation2009). PM2.5 mass was determined using a LabServe microbalance with 10 μg precision (model BP210D; Sartorius Corporation, Göttingen, Germany).
Organic and elemental carbon contents in PM2.5 samples were determined using a Dual Optics OCEC Lab Instrument (Sunset Lab, Tigard, OR). Punches (1.5 cm2) of QFFs were analyzed using National Institute for Occupational Safety and Health (NIOSH) method 870 (Karanasiou et al., Citation2015), which is based on Birch and Cary (Citation1996). OC is reported as the sum of five distinct values (OC1, OC2, OC3, OC4, and OCp), corresponding to temperature steps of 310, 475, 615, and 870 °C and the pyrolized portion of OC, respectively. EC is reported as the sum of six distinct values measured at 550, 625, 700, 775, 850, and 870 °C. PTFE filters were used to prepare aqueous extracts of the sampled PM2.5 for each fuel. These extracts were analyzed for soluble metals using an inductively coupled plasma mass spectrometry (ICP-MS) (model 7700; Agilent Corp., Santa Clara, CA) and following published protocols (Cartledge and Majestic, Citation2015).
Test protocols
The homestove test protocol was based on the Cordwood Annex from the American Society for Testing and Materials (ASTM) E-2780 Standard Test Method for Determining Particulate Matter Emissions from Wood Heaters (ASTM, 2010). The ASTM test was based on EPA method 28 using cribwood (i.e., standardized test loads of 2–4 in × 4 in nominal lumber nailed into a rectangular prism approximately 5/6 the length of the firebox) (EPA, 1988); however, the ASTM test also includes an annex for testing cordwood, or split logs. The use of cordwood is considered more representative of real-world practices compared with cribwood. Consequently, the EPA is presently developing regulatory test methods based on the ASTM Cordwood Annex to be promulgated in 2018 (EPA, 2016a). Currently, there exist no standardized protocols for testing coal in homestoves.
shows the homestove testing phases utilized. In both ASTM and EPA methods, newspaper and kindling is used to ignite a Pre-burn load to bring the stove to operating temperature and establish a hot charcoal bed. In this study, a propane torch was used for 30 sec instead of a butane lighter for ignition of the Pre-burn load. Coal testing used ponderosa pine as the Pre-burn fuel for two reasons: (a) test protocols under development for current wood/coal combination stoves use a wood Pre-burn load (Bob Ferguson, personal communication), and (b) establishing a wood charcoal bed prior to coal addition is common practice in the NN (Bunnell et al., Citation2010).
Figure 3. Overview of phases and equations for mEFi and eEFi, where i = PM2.5, OC, EC, CO, and CO2.
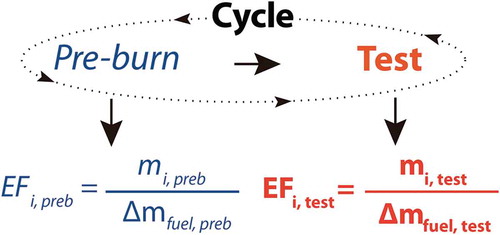
The Pre-burn was directly followed by the Test, wherein a Test load was added onto the hot charcoal bed and allowed to ignite with air controls fully open (5.0 min). The Test phase continued when air controls are lowered to maintain a fuel burn rate within a specified range (low = 0.60–1.15, medium = 1.16–1.75, or maximum >1.75 kg dry fuel/hr). Emissions from different burn rates are averaged to report EFs, unless burn rate cannot be controlled. The Test phase ended when the mass of the Test load was consumed (determined gravimetrically).
The Cycle shown in combined the Pre-burn and Test phases and is intended to represent one wood ignition and burn event with a wood or coal addition to the hot charcoal bed. This protocol is similar to European standards for homestove testing (EN 13240:2001), wherein emissions are determined for a Cycle including both Pre-burn and Test phases (Ozgen et al., Citation2014).
Test phase conditions are listed in . Five individual Pre-burn and Test phases (i.e., five Cycles) were conducted for ponderosa pine, and four (n = 4) for Utah juniper, Black Mesa, and Fruitland. Mean mass fuel loading for the Test phase was 1.3 kg for wood and 0.65 kg for coal. This corresponds to 20% and 10% of the fuel loading as specified by the ASTM Cordwood Annex (defined as 162 kg per 1 m3 of firebox volume). This load reduction was due primarily to limitations of CUEST facility to evacuate emissions at full loading. Tissari et al. (Citation2007) tested residential wood stove emissions using fuel loads similar to this study (20–30% of maximum firebox capacity, compared with 10–20% in this study).
Table 2. Test phase conditions.
The mean Test phase duration was 35 min (SD = 11) for wood and 87 min (SD = 21) for coal. The measured firebox volume of the homestove (0.04 m3; 1.4 ft3) equated to a nominal heat load (i.e., input) of 4.1 kW (14,000 BTU/hr) based on a relationship by Kreider and Kreith (Citation1982). Dividing the heat load by the heat content (lower heating value [LHV]) of ponderosa pine, this is equivalent to a nominal fuel burn rate of 2.2 kg/hr for this homestove.
The stove flue temperature (Tflue), measured at the flue exit, was significantly higher for wood (424 °C, SD = 94) compared with coal (184 °C, SD = 41). Coal Tflue remained above the recommended value of 120 °C to prevent formation of creosote (i.e., semivolatile product of incomplete combustion) (Baker, Citation1993). The Test phase was deemed complete when two rearrangements of the charcoal bed and coal (each 10 min apart) produced negligible fuel consumption (as defined in the Cordwood Annex). The Test load for wood was completely consumed, while approximately half remained for coal tests ().
Emission factors
The “hood method” (Butcher et al., Citation1984; Ballard-Tremeer and Jawurek, Citation1999) was used in this study because it is common for controlled emission testing; Jetter et al. (Citation2012) reported 14 studies using it. In addition, this method does not require measuring methane and nonmethane hydrocarbons to fulfill the “carbon balance” assumption (Zhang et al., Citation2000; Roden et al., Citation2006). shows the overall equations used to determine EFs.
First, the flue volumetric flow rate (Qflue) was multiplied by the mass concentration measured for each pollutant to determine an average mass flow rate of the pollutant (ṁi). This mass flow rate was then multiplied by the duration of the phase (e.g., Pre-burn or Test) to determine the mass of pollutant emitted during that phase. This mass was then divided by (a) mass of fuel consumed during the Test phase or (b) the amount of energy in the fuel (based on LHV) consumed during the Cycle. These values are reported as mass EFs or mEFs (g/kg) and energy EFs or eEFs (mg/MJ), respectively.
The parameter mEF is useful for comparison with previous studies and has been used to determine emission limits by many entities, including tribal agencies (EPA, 2016b). All EFs reported include ignition and wait periods and were blank-corrected for PM2.5, OC, and EC and background-corrected for PM2.5, OC, EC, and CO based on 45-min background sampling periods prior to each test. EFs for CO2 were corrected using real-time background measurements. EFs were compared between fuel types (i.e., wood vs. coal) using a one-tailed Student’s t test at a significance level (α) of 0.05.
Carbon balance
Carbon balances (Cbal = Cfuel/Cemissions) were conducted for each trial as indicators of quality control. Detailed information about these analyses is included in Supplemental Materials (Figures S2, S3, and S4). Carbon balances were approximately normally distributed, and no trials were eliminated. The carbon contents of the fuels studied were estimated using published values (Table S2); however, it is likely that the actual values varied from those in the literature. Additionally, methane and nonmethane hydrocarbons were not measured and may account for roughly 3% of the carbon balance uncertainty (Smith et al., Citation1993).
Results and discussion
Mass emission factors
The homestove tested was leaky and burned wood at 2.2 kg dry fuel/hr (SD = 0.61) and coal at 0.26 kg dry fuel/hr (SD = 0.055) regardless of air control settings; therefore, only “maximum” rates are reported here. Mass emission factors (mEFs) were determined for both the Pre-burn and the Test phases. Those from the Pre-burn phase are presented here for completeness, but they are not usually reported.
Pre-burn phase mEFPM2.5 were 1.7 g/kg (SD = 0.7) and 3.1 g/kg (SD = 0.5) for ponderosa pine and Utah juniper, respectively. Pre-burn phase mEFCO were 26.5 g/kg (SD = 8.8) and 39.6 g/kg (SD = 15) for the two fuels, respectively. This suggests that for these two wood types, ponderosa pine provided a hot charcoal bed (for further fuel addition) with significantly lower PM2.5 and CO emissions. Pre-burn EFs were not reported for coal tests because ponderosa pine was used as the Pre-burn fuel load.
Mass EFs (mEFs) from the Test phase for PM2.5, OC, EC, CO, and CO2 are presented in . Wood types had significantly lower mEFs compared with coal for all pollutants. Fine particulate matter mEFs (mEFPM2.5) ranged from 1.09 to 1.68 g/kg for wood compared with 13.3 to 14.1 g/kg for coal. Shen et al. (Citation2014) found bituminous coal mEFPM2.5 to be 7-fold higher compared with cordwood using similar residential stoves, agreeing closely with this study.
Table 3. Mass emission factors, mEFi (in g/kg), for PM and other compounds emitted during the test phase.
Previously, mEFPM2.5 from combustion in homestoves, ranging from 2.0 to 13 g/kg, were reported for loblolly pine (Fine et al., Citation2004) and maritime pine (Alves et al., Citation2011; Gonçalves et al., Citation2011). McDonald et al. (Citation2000) reported mEFPM2.5 ranging from 4.7 to 5.8 g/kg for ponderosa pine combustion in a fireplace, which is less efficient and expected to emit more pollutants compared with a homestove. mEFPM2.5 for juniper combustion in a homestove is unavailable, but a value of 4.6 g/kg was reported for controlled open burning (i.e., without a stove) (McMeeking et al., Citation2009). Table S3 summarizes published mEFs for fuels tested in this study. Generally, the mEFPM2.5 for wood types determined in the present study were lower compared with published values.
The lower mEFPM2.5 for wood observed in this study are likely due to several factors. First, different pine species can vary in their chemical composition and emissions. Second, cutting the wood into smaller pieces would likely improve combustion, leading to lower emissions. Lastly, this study used less wood (1.3 kg) compared with those studies (3–6 kg), thereby reducing compaction and increasing airflow to the fuel surface. Moisture contents ranged from 8% to 9% in previous studies (Fine et al., Citation2004; Alves et al., Citation2011; Gonçalves et al., Citation2011) and 6% to 12% in the present study; therefore, differences in moisture content are not expected to be a contributing factor to the lower mEFPM2.5 observed here. Increased moisture content of a solid fuel increases time of ignition, cools devolatilization and combustion gases, and generally increases homestove emissions.
The homestove utilized in the present study was old and not designed for coal combustion; therefore, the coal combustion process in this unit was likely not optimized. However, mEFPM2.5 for coal reported here agree with values reported by previous studies on combustion in residential coal stoves (Shen et al., Citation2014; Chen et al., Citation2016).
The mEFPM2.5 variability observed in this study is common in homestove testing and within the ranges of previous published work. For residential coal stove testing, for example, Chen et al. (Citation2016) reported high variability (i.e., SD >mean) for mEFs of PM2.5, OC, and EC. Similarly, an assessment of the EPA Accredited Laboratory Proficiency Test Program found that reported PM emission rates varied up to ±112% among laboratories due to the “random nature of burning wood” (Curkeet and Ferguson, Citation2010).
Here, the PM2.5 emissions from each fuel were also extracted in cell-grade water and analyzed for soluble metals. A summary of the results of the elemental analysis is included in Table S4. This elemental analysis determined that potassium (K) was the most abundant soluble metal for both wood (0.37% w/w) and coal (0.42% w/w). These extracts were also used to determine oxidative stress and inflammatory responses in a separate study.
also includes mass EFs of fine particulate OC and EC (mEFOC and mEFEC, respectively). In the present study, mEFOC ranged from 0.54 to 1.0 g/kg for wood and 7.1 to 9.3 g/kg for coal. Coal had 11-fold higher mEFOC compared with wood, similar to Shen et al. (Citation2014), who found bituminous coal to have 7-fold higher mEFOC than wood in residential stoves. Previously, pine mEFOC from homestoves were reported to range from 0.87 to 6.8 g/kg (Fine et al., Citation2004; Alves et al., Citation2011). Those studies found that OC constituted between 44% and 49% of pine PM2.5, closely agreeing with the value of 50% for ponderosa pine in this study. For bituminous coal combustion in residential coal stoves, published mean mEFOC range from 3.0 to 5.9 g/kg (Zhang et al., Citation2008; Shen et al., Citation2014). Those studies found that OC constituted between 40% and 47% of PM2.5, compared with 61% for the coal types tested here. The higher fraction of OC in the PM2.5 here may be due to design differences between wood and coal stoves (i.e., less air above the fuel to promote combustion of devolatilized OC). Also, the smoldering that occurred during the testing likely contributed to the higher emissions (discussed in more detail below).
In the present study, mEFEC ranged from 0.18 to 0.21 g/kg for wood and 0.45 to 0.47 g/kg for coal. On average, mEFEC for coal were 3-fold higher than wood; Shen et al. (Citation2014) found coal to have 8-fold higher mEFEC than wood. EC is primarily produced by flaming combustion (Frenklach, Citation2002), which occurred more frequently during the testing of wood compared with coal here and may explain this discrepancy. Pine and bituminous coal mEFEC from residential wood and coal stoves previously reported ranged from 0.3 to 0.7 g/kg (Fine et al., Citation2004; Alves et al., Citation2011) and 0.5 to 2.8 g/kg (Zhang et al., Citation2008; Shen et al., Citation2014), respectively. Therefore, mEFEC for wood and coal in this study agreed well with previous studies.
In the present study, mEFCO ranged from 27 to 40 g/kg for wood and 204 to 226 g/kg for coal. Previously reported mean mEFCO for combined pine, birch, and spruce combustion in homestoves ranged from 21 to 137 g/kg (Pettersson et al., Citation2011). Residential coal combustion data are limited, but Butcher and Ellenbecker (Citation1982) measured a lower mEFCO (116 g/kg) for bituminous coal in a residential coal stove. That stove was designed with high over-fire airflow to promote mixing and combustion of volatile compounds, thereby resulting in the lower observed mEF for CO compared with the present study.
mEFCO2 ranged from 1470 to 1540 g/kg for wood and 2424 to 2484 g/kg for coal in this study. Chen et al. (Citation2007) measured mEFCO2 at 1760 g/kg from controlled open combustion of ponderosa pine. The higher mEFCO2 for coal compared with wood is in agreement with coal’s higher carbon content (Table S2).
Energy emission factors
Energy emission factors are often used to compare fuels with different energy contents on a more equal basis. Energy EFs (eEFs) for PM2.5, OC, EC, CO, and CO2 from the Cycle () are presented in . Wood types compared with coal had significantly lower eEFs for all pollutants expect EC, which may be explained by higher prevalence of flaming conditions during wood tests compared with coal, since EC is produced in the flame (Fitzpatrick et al., Citation2008).
Table 4. Energy emission factors, eEFi (in mg/MJ) for cycle.
In the present study, eEFPM2.5 for wood ranged from 105 to 163 mg/MJ and 320 to 323 mg/MJ for coal. There are fewer published homestove eEFs compared with mEFs for PM2.5 for the fuel types tested; therefore, published mEFs summarized in Table S3 were converted to eEFs and are presented in Table S5. Alves et al. (Citation2011), however, reported an eEFPM2.5 for maritime pine of 906 mg/MJ and cited four references with values for different wood types between 50 and 2110 mg/MJ of PM of varying particle size. The International Energy Agency reported a standard PM10 eEF of 400 mg/MJ for homestoves (Nussbaumer et al., Citation2008). For bituminous coal, Chen et al. (Citation2016) reported an eEFPM2.5 of 290 mg/MJ (SD = 290).
In the present study, eEFCO ranged from 2108 to 2849 mg/MJ for wood and 5123 to 5195 mg/MJ for coal. Previously reported homestove eEFCO were 1800–3200 mg/MJ for cordwood (Bäfver et al., Citation2011) and 3600 mg/MJ (SD = 720) for bituminous coal. Generally, the eEFs for PM2.5, OC, and CO in this study agreed well with those in Table S5.
Correlation of PM2.5 and CO emission factors
In a review of stove intervention programs in low- and middle-income countries, CO was the most commonly measured pollutant (Thomas et al., Citation2015). Statistically significant correlations of indoor PM2.5 and CO concentrations have been observed in homes using wood-burning cookstoves (Naeher et al., Citation2001; Siddiqui et al., Citation2009; Northcross et al., Citation2010). Studies have not explored CO concentrations as a proxy for PM2.5 concentrations from homestoves. In this study, correlations between the mass and energy emission factors of PM2.5 and CO were determined and are presented in and , respectively. These relationships may be useful to relate PM2.5 and CO emissions in studies of homestoves burning wood and coal.
Figure 4. PM2.5 and CO EFs for (a) Test phase with natural log–transform and linear fit for mEFs, and (b) Pre-burn and Test phases combined (Cycle) with linear fit for eEFs. The shaded region in (a) is EPA-suggested PM10 and CO mass emission factors for a conventional residential wood stove (EPA, 1996). The vertical dashed lines represent mEFs and eEFs previously reported for these fuels and summarized in Tables S3 and S5.
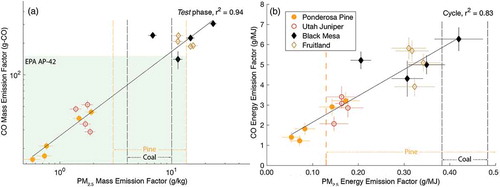
The natural log–transformed linear relationship for mEFPM2.5 versus mEFCO (calculated as mEFPM2.5 = e(ln(EFCO) × 1.17 − 3.74)) is plotted in and shows a strong positive correlation (r2 = 0.94). Previous studies found similar correlations for natural log–transformed linear (McCracken et al., Citation2013) and linear relationships (Naeher et al., Citation2001; Pollard et al., Citation2014) of indoor PM2.5 and CO concentrations. Other studies, however, have found low correlations for these factors (Yamamoto et al., Citation2014; Klasen et al., Citation2015), especially at lower concentrations. Although the relationship between PM2.5 and CO developed in this study may allow the prediction of mEFPM2.5 using mEFCO, it is likely limited to the specific stove and fuel types tested here.
also shows the EPA-suggested mEFs for PM10 and CO for a representative U.S. homestove as the shaded region (EPA, 1996). In this study, wood types had mEFs below these suggested values, whereas all but one of the coal tests exceeded these values. also shows the range of mEFPM2.5 reported from previous homestove emission studies of these fuel types as vertical dashed lines, which are also summarized in Table S3 for comparison purposes.
shows the linear relationship for eEFPM2.5 versus eEFCO (calculated as eEFPM2.5 = 0.063 × eEFCO − 0.014; r2 = 0.83). The eEFPM2.5 and eEFCO were about 2.5 times higher for coal compared with wood; however, on a mass basis, this difference was 10-fold higher for coal versus wood. This difference may be explained by two factors. First, coal types have 25% higher energy content compared with wood (). Second, the eEFs reported here include a Pre-burn phase using ponderosa pine, which is a cleaner-burning fuel compared with coal, effectively lowering the total Cycle emissions.
Carbon profiles
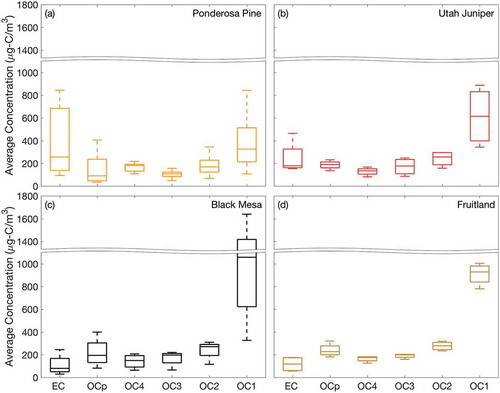
shows the OC volatility profiles for each fuel during the Test phase. High-volatile organics (OC1) were the largest OC fraction in all fuels: 37%, 45%, 55%, and 51% for ponderosa pine, Utah juniper, Black Mesa, and Fruitland, respectively. OC1 includes compounds that are less polar, less oxidized, and have generally lower molecular weights compared with the other OC fractions. Emissions from wood and coal combustion have been characterized by their OC1 fraction previously (Chen et al., Citation2007; Jeong et al., Citation2008). In this study, the emissions were sampled directly during combustion; therefore, the OC had less time to age compared with other studies (Lim et al., Citation2012) and would be expected to be more volatile than compounds with lower molecular weights.
Figure 5. Elemental and organic carbon profiles during Test phase for (a) ponderosa pine, (b) Utah juniper, (c) Black Mesa, and (d) Fruitland.
Real-time parameters
Real-time CO and TSP concentrations and modified combustion efficiency (MCE) for the Test phase are plotted in . MCE is defined as ΔCO2/(ΔCO2 + ΔCO), where ΔCO2 and ΔCO are the increases in concentrations (ppm) of CO2 and CO above background levels. The means and standard deviations are presented for these data (i.e., minutes elapsed following fuel addition) for all trials of each fuel. No standard deviations are reported for single trials. Data were not normalized because Test phase durations had low variability (shown in ).
Figure 6. Real-time Test phase (a, b) CO and (c, d) TSP concentrations and (e, f) MCE: mean concentration (solid line) or percent efficiency (dashed line). Standard deviation of all Test phases for each fuel is plotted as shaded region. Dotted line in each MCE plot represents transition from flaming to smoldering combustion (90%).
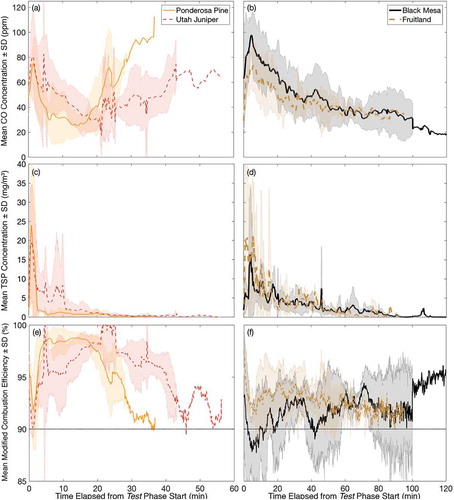
All fuels showed an immediate increase in CO concentration following fuel addition. CO concentrations from ponderosa pine and Utah juniper also increased towards the end of the Test phase. This is typical of wood smoldering (Andreae and Merlet, Citation2001) when remaining char is incompletely oxidized (Turns, Citation1996); increasing CO as smoldering proceeds has been observed for wood (Roden et al., Citation2006; Vicente et al., Citation2015) and wood chip (Kortelainen et al., Citation2015) combustion. Ponderosa pine and Utah juniper showed no significant co-integration for real-time CO concentration during the Test phase, suggesting the wood types emit CO at different levels as combustion proceeds.
The decay in CO concentration was modeled for Black Mesa (COppm = 83.5e−0.0121·t; r2 = 0.93; t = min following fuel addition) and Fruitland (COppm = 61.8e−0.00785·t; r2 = 0.77; t = min following fuel addition). CO concentration for all coals peaked following fuel addition and then declined until the end of the Test phase, differing from wood. This trend was observed by Shen et al. (Citation2010) for coal combustion in residential stoves. The two coal types showed a strong co-integration (P = 0.0001) for real-time CO concentration, suggesting that CO emission rates may not vary significantly between the two coal types during combustion.
Similar to CO, all fuels exhibited a peak in TSP concentration following fuel addition. Butcher and Sorenson (Citation1979) also observed TSP concentration to increase rapidly following fuel ignition from eastern white pine combustion in a homestove. Zhi et al. (Citation2008) observed real-time concentrations of black carbon peaked within 5–15 min following addition of bituminous coal in residential coal stoves. All these studies suggest that exposures are highest immediately following coal addition to a hot charcoal bed.
During the Test phase, the MCE was the lowest immediately following fuel addition, corresponding to temporary fuel-rich conditions and lower combustion temperatures. When MCE is greater than 90%, combustion is considered to be predominantly flaming (Lee et al., Citation2010), as indicated by the dotted horizontal line in . In this study, the Test phase MCE averaged 97.8% for wood and 92.0% for coal, and combustion was predominantly flaming for over 80% of the time. Wood combustion was more efficient overall compared with coal.
Conclusions
Four solid fuels commonly used for residential heating in the NN were tested using a representative Navajo homestove. Of these fuels, ponderosa pine had the lowest mEFs and eEFs for PM2.5, OC, CO, and CO2 during the Test phase. Ponderosa pine also produced about 50% fewer PM2.5 emissions than Utah juniper during the Pre-burn phase; therefore, it is recommended for their use indoors.
Overall, coal compared with wood produced significantly higher emissions on both mass and energy bases. Black Mesa coal had the highest mEFs and eEFs for PM2.5, OC, and CO. It is recommended, therefore, that the use of coal be discouraged, in agreement with the call by the World Health Organization (Citation2014). More recently, the World Health Organization (Citation2016) also acknowledged that household heating interventions “must take the whole picture into account.” By using a representative stove and relevant fuels and practices, this study provided the first direct comparison of emissions from the combustion of wood and coal types relevant to the Navajo Nation.
This study also determined that CO may be used as a proxy for PM2.5 emissions for these specific fuels using a representative homestove. Therefore, current PM2.5 emissions may be estimated using low-cost CO monitors. Additionally, all fuels emitted the highest concentrations of CO and TSP directly following fuel addition to the hot charcoal bed. This suggests that for a stove that is leaky or lacking proper exhaust, the minutes following fuel addition represent the highest risk exposure to these residents.
The pollutants measured in this study have been linked to negative health effects (Naeher et al., Citation2007; International Agency for Research on Cancer, Citation2010). Both homestove and home characteristics play important roles in minimizing these exposures. Fissures in the stove or flue may result in leaks into the home and higher exposures for the residents. A nonweatherized home with high infiltration rate, as is typical on the NN, requires more heating (and more fuel use) but may allow the pollutants to escape to the outdoors. Therefore, assessment of current exposures affecting Navajo residents requires an understanding of their burning practices, fuel preferences, and home characteristics. Since most Navajo homes burn solid fuels indoors, further investigation into these topics is recommended.
Supplemental Information
Download MS Word (625.7 KB)Acknowledgment
We thank the Mortenson Center for Engineering in Developing Communities for their assistance with facility funding. We are very grateful to Royce Brady and his family for providing the homestove and to Perry Charley and Dr. Donald Robinson for providing fuels used in this study.
Funding
This work was partially supported by the National Science Foundation (award 0946502), as well as the Discovery Learning Apprenticeship (DLA) and the Department of Civil, Environment, and Architectural Engineering’s Dissertation Completion Fellowship at the University of Colorado Boulder.
Supplemental data
Supplemental data for this article can be accessed on the publisher’s website.
Additional information
Funding
Notes on contributors
Wyatt M. Champion
Wyatt M. Champion, Ph.D., is a graduate student, Lea Connors is an undergraduate student, and Lupita D. Montoya, Ph.D., is an assistant professor at the Department of Civil, Environmental, and Architectural Engineering, University of Colorado Boulder, Boulder, CO, USA.
References
- Affolter, R.H. 2000. Quality characterization of cretaceous coal from the Colorado Plateau Coal Assessent Area. In M.A. Kirschbaum, L.N.R. Roberts, and L.R.H. Biewick (Eds.), Geologic Assessment of Coal in the Colorado Plateau: Arizona, Colorado, New Mexico, and Utah, Vol. 1, G1–G136. Denver, CO: U.S. Geological Survey. https://pubs.usgs.gov/pp/p1625b/ (accessed March 24, 2016).
- Alves, C., C. Gonçalves, A.P. Fernandes, L. Tarelho, and C. Pio. 2011. Fireplace and woodstove fine particle emissions from combustion of western Mediterranean wood types. Atmos. Res. 101:692–700. doi: 10.1016/j.atmosres.2011.04.015.
- American Society for Testing and Materials. 2010. Standard Test Method for Determining Particulate Matter Emissions from Wood Heaters. E2780-10 ASTM International: 1–13]. West Conshohocken, PA: American Society for Testing and Materials. doi: 10.1520/E2780-10.2.
- Andreae, M.O., and P. Merlet. 2001. Emission of trace gases and aerosols from biomass burning. Glob. Biogeochem. Cycles 15:955–66. doi: 10.1029/2000GB001382.
- Arizona Bureau of Mines. 1977. Chemical Analyses of Coal Samples from the Black Mesa Field, Arizona. http://repository.azgs.az.gov/uri_gin/azgs/dlio/1067 (accessed March 24, 2016).
- Arizona Rural Policy Institute. 2010. Demographic Analysis of the Navajo Nation Using 2010 Census and 2010 American Community Survey Estimates. http://gotr.azgovernor.gov/sites/default/files/navajo_nation_0.pdf (accessed September 3, 2015).
- Bäfver, L.S., B. Leckner, C. Tullin, and M. Berntsen. 2011. Particle emissions from pellets stoves and modern and old-type wood stoves. Biomass Bioenergy 35:3648–55. doi: 10.1016/j.biombioe.2011.05.027.
- Baker, D.E. 1993. Wood Stove Maintenance and Operation. University of Missouri Extension Web site. http://extension.missouri.edu/p/G1731 (accessed April 10, 2017).
- Ballard-Tremeer, G., and H.H. Jawurek. 1999. The “hood method” of measuring emissions of rural cooking devices. Biomass Bioenergy 16:341–5. doi: 10.1016/S0961-9534(99)00012-4.
- Bilbao, R., J.F. Mastral, M.E. Aldea, J. Ceamanos, M. Betrán, and J.A. Lana. 2001. Experimental and theoretical study of the ignition and smoldering of wood including convective effects. Combust. Flame 126:1363–72. doi: 10.1016/S0010-2180(01)00251-6.
- Birch, M.E., and R.A. Cary. 1996. Elemental carbon-based method for monitoring occupational exposures to particulate diesel exhaust. Aerosol Sci. Technol. 25:221–41. doi: 10.1080/02786829608965393.
- Bond, T.C., S.J. Doherty, D.W. Fahey, P.M. Forster, T. Berntsen, B.J. DeAngelo, M.G. Flanner, S. Ghan, B. Kärcher, D. Koch, S. Kinne, Y. Kondo, P.K. Quinn, M.C. Sarofim, M.G. Schultz, M. Schulz, C. Venkataraman, H. Zhang, S. Zhang, N. Bellouin, S. K. Guttikunda, P.K. Hopke, M.Z. Jacobson, J.W. Kaiser, Z. Klimont, U. Lohmann, J. P. Schwarz, D. Shindell, T. Storelvmo, S.G. Warren, and C.S. Zender. 2013. Bounding the role of black carbon in the climate system: A scientific assessment. J. Geophys. Res. Atmos. 118:5380–552. doi: 10.1002/jgrd.50171.
- Bond, T.C., D.G. Streets, K.F. Yarber, S.M. Nelson, J.H. Woo, and Z. Klimont. 2004. A technology-based global inventory of black and organic carbon emissions from combustion. J. Geophys. Res. D Atmos. 109:D14203. doi: 10.1029/2003JD003697.
- Brown, L.F., D.D. Hickmott, R.P. Currier, S.C. Semken, T. Lameman, S. Martin, and S. Yazzie. 1996. Reducing Adverse Health Effects and Improving Performance of Stoves on the Navajo Reservation—A Plan for Action. Los Alamos, NM: Los Alamos National Laboratory.
- Bunnell, J.E., L.V Garcia, J.M. Furst, H. Lerch, R.A. Olea, S.E. Suitt, and A. Kolker. 2010. Navajo coal combustion and respiratory health near Shiprock, New Mexico. J. Environ. Public Health 2010:260525. doi: 10.1155/2010/260525.
- Butcher, S.S., and M.J. Ellenbecker. 1982. Particulate emission factors for small wood and coal stoves. J. Air Pollut. Control Assoc. 32:380–4. doi: 10.1080/00022470.1982.10465413.
- Butcher, S.S., U. Rao, K.R. Smith, J.F. Osborn, P. Azuma, and H. Fields. 1984. Emission factors and efficiencies for small-scale open biomass combustion: Towards standard measurement techniques. Abstr. Pap. Am. Chem. Soc. 188:122–8.
- Butcher, S.S., and E.M. Sorenson. 1979. A study of wood stove particulate emissions. J. Air Pollut. Control Assoc. 29:724–8. doi: 10.1080/00022470.1979.10470854.
- Cartledge, B.T., and B.J. Majestic. 2015. Metal concentrations and soluble iron speciation in fine particulate matter from light rail activity in the Denver-metropolitan area. Atmos. Pollut. Res. 6:495–502. doi: 10.5094/APR.2015.055.
- Champion, W.M., P.H. Charley, B. Klein, K. Stewart, P.A. Solomon, and L.D. Montoya. 2017. Perception, cultural, and technical assessment of heating alternatives to improve indoor air quality in the Navajo Nation. Sci. Total Environ. 580:297–306. doi: 10.1016/j.scitotenv.2016.11.053.
- Chen, L.W.A., H. Moosmüller, W.P. Arnott, J.C. Chow, J.G. Watson, R.A. Susott, R.E. Babbitt, C.E. Wold, E.N. Lincoln, and M.H. Wei. 2007. Emissions from laboratory combustion of wildland fuels: Emission factors and source profiles. Environ. Sci. Technol. 41:4317–25. doi: 10.1021/es062364i.
- Chen, W., K. Annamalai, R.J. Ansley, and M. Mirik. 2012. Updraft fixed bed gasification of mesquite and juniper wood samples. Energy 41:454–61. doi: 10.1016/j.energy.2012.02.052.
- Chen, Y., G. Shen, W. Liu, W. Du, S. Su, Y. Duan, N. Lin, S. Zhuo, X. Wang, B. Xing, and S. Tao. 2016. Field measurement and estimate of gaseous and particle pollutant emissions from cooking and space heating processes in rural households, northern China. Atmos. Environ. 125:265–71. doi: 10.1016/j.atmosenv.2015.11.032.
- Chen, Y., G. Sheng, X. Bi, Y. Feng, B. Mai, and J. Fu. 2005. Emission factors for carbonaceous particles and polycyclic aromatic hydrocarbons from residential coal combustion in China. Environ. Sci. Technol. 39:1861–7. doi: 10.1021/es0493650.
- Curkeet, R., and R. Ferguson. 2010. EPA Wood Heater Test Method Variability Study: Analysis of Uncertainty, Repeatability and Reproducibility Based on the EPA Accredited Laboratory Proficiency Test Database, 1–43. http://www.hpba.org/government-affairs/nsps-members/Wood-Heater-Emission-Test-Method-Variability-Paper.pdf/at_download/file&usg=AFQjCNElr1GG5j (accessed April 4, 2016).
- Dutton, S.J., J.J. Schauer, S. Vedal, and M.P. Hannigan. 2009. PM2.5 characterization for time series studies: Pointwise uncertainty estimation and bulk speciation methods applied in Denver. Atmos. Environ. 43:1136–46. doi: 10.1016/j.atmosenv.2008.10.003.PM.
- Engle, R.F., and C.W.J. Granger. 1987. Co-integration and error correction: Representation, estimation, and testing. Econometrica 55:251–76. doi: 10.2307/1913236.
- Fine, P.M., G.R. Cass, and B.R.T. Simoneit. 2004. Chemical characterization of fine particle emissions from the wood stove combustion of prevalent united states tree species. Environ. Eng. Sci. 21:705–21. doi: 10.1089/ees.2004.21.705.
- Fitzpatrick, E.M., J.M. Jones, M. Pourkashanian, A.B. Ross, A. Williams, and K.D. Bartle. 2008. Mechanistic aspects of soot formation from the combustion of pine wood. Energy Fuels 22:3771–8.
- Forouzanfar, M.H., L. Alexander, H.R. Anderson, V.F. Bachman, S. Biryukov, M. Brauer, R. Burnett, D. Casey, M.M. Coates, A. Cohen, et al., 2015. Global, regional, and national comparative risk assessment of 79 behavioural, environmental and occupational, and metabolic risks or clusters of risks in 188 countries, 1990–2013: A systematic analysis for the global burden of disease study 2013. Lancet 386:2287–323. doi: 10.1016/S0140-6736(15)00128-2.
- Frenklach, M. 2002. Reaction mechanism of soot formation in flames. Physical Chemistry Chemical Physics 4:2028–37. doi: 10.1039/b110045a.
- Gaur, S., and T. B. Reed. 1998. Thermal Data for Natural and Synthetic Fuels. New York, NY: Marcel Dekker. http://drtlud.com/BEF/proximat.htm (accessed March 1, 2016).
- Gonçalves, C., C. Alves, A. P. Fernandes, C. Monteiro, L. Tarelho, M. Evtyugina, and C. Pio. 2011. Organic compounds in PM2.5 emitted from fireplace and woodstove combustion of typical Portuguese wood species. Atmos. Environ. 45:4533–45. doi: 10.1016/j.atmosenv.2011.05.071.
- Hickmott, D.D., L.F. Brown, R.P. Currier, S.C. Semken, T. Lameman, M. Suzette, and S. Yazzie. 1997. Environmentally Conscious Coal Combustion. Los Alamos, NM: Los Alamos National Laboratory. http://www.osti.gov/scitech/servlets/purl/516052 (accessed August 1, 2016).
- Hosier, R.H., and J. Dowd. 1987. Household fuel choice in Zimbabwe. Resour. Energy 9:347–61. doi: 10.1016/0165-0572(87)90003-X.
- Houck, J.E., L.Y. Pitzman, and P. Tiegs. 2008. Emission Factors for Aged Uncertified Residential Cordwood Heaters. Proceedings of the 17th International Emission Inventory Conference, Inventory Evaluation—Portal to Improved Air Quality. http://search.proquest.com/docview/19587803?accountid=171201 ( accessed June 2, 2016).
- Intergovernmental Panel on Climate Change. 2006. Guidelines for National Greenhouse Gas Inventories. http://www.ipcc-nggip.iges.or.jp/public/2006gl/index.html (accessed July 24, 2016).
- International Agency for Research on Cancer. 2010. Household Use of Solid Fuels and High-Temperature Frying. IARC Monographs on the Evaluation of Carcinogenic Risks to Humans, Vol. 95. Lyon, France: International Agency for Research on Cancer, World Health Organization. http://monographs.iarc.fr/ENG/Monographs/vol95/mono95.pdf (accessed November 10, 2015).
- Jeong, C., G.J. Evans, T. Dann, M. Graham, D. Herod, E. Dabek-zlotorzynska, D. Mathieu, L. Ding, and D. Wang. 2008. Influence of biomass burning on wintertime fine particulate matter: Source contribution at a valley site in rural British Columbia Atmospheric Environment 42:3684–99. doi: 10.1016/j.atmosenv.2008.01.006.
- Jetter, J., Y. Zhao, K.R. Smith, B. Khan, T. Yelverton, P. Decarlo, and M.D. Hays. 2012. Pollutant emissions and energy efficiency under controlled conditions for household biomass cookstoves and implications for metrics useful in setting international test standards. Environ. Sci. Technol. 46:10827–34. doi: 10.1021/es301693f.
- Jordan, T.B., and A.J. Seen. 2005. Effect of airflow setting on the organic composition of woodheater emissions. Environ. Sci. Technol. 39:3601–10. doi: 10.1021/es0487628.
- Junker, C., and C. Liousse. 2006. A global emission inventory of carbonaceous aerosol from historic records of fossil fuel and biofuel consumption for the period 1860–1997. Atmos. Chem. Phys. Discuss. 6:4897–927. doi: 10.5194/acpd-6-4897-2006.
- Karanasiou, A., M.C. Minguillón, M. Viana, A. Alastuey, J.-P. Putaud, W. Maenhaut, P. Panteliadis, G. Močnik, O. Favez, and T.A.J. Kuhlbusch. 2015. Thermal-optical analysis for the measurement of elemental carbon (EC) and organic carbon (OC) in ambient air a literature review. Atmos. Meas. Tech. Discuss 8:9649–712. doi: 10.5194/amtd-8-9649-2015.
- Kirschbaum, B.M.A., and L.R.H. Biewick. 2000. A Summary of the Coal Deposits in the Colorado Plateau: Arizona, Colorado, New Mexico, and Utah. U.S. Geological Survey Professional Paper 1625-B. Boulder, CO: U.S. Geological Survey.
- Klasen, E.M., B. Wills, N. Naithani, R.H. Gilman, J.M. Tielsch, M. Chiang, S. Khatry, P.N. Breysse, D. Menya, C. Apaka, E.J. Carter, C.B. Sherman, J.J. Miranda, W. Checkley, L. Grajeda, D. Haustein, A. Huaman, S. Kimaiyo, S. LeClerq, M. Levano, S. Levy, P. Mosol, F. Ogaro, E. Rhodes, and R.A. Wise. 2015. Low correlation between household carbon monoxide and particulate matter concentrations from biomass-related pollution in three resource-poor settings. Environ. Res. 142:424–31. doi: 10.1016/j.envres.2015.07.012.
- Kortelainen, A., J. Joutsensaari, L. Hao, J. Leskinen, P. Tiitta, A. Jaatinen, P. Miettinen, O. Sippula, T. Torvela, J. Tissari, J. Jokiniemi, D.R. Worsnop, J.N. Smith, A. Laaksonen, and A. Virtanen. 2015. Real-time chemical composition analysis of particulate emissions from woodchip combustion. Energy Fuels 29:1143–50. doi: 10.1021/ef5019548.
- Kreider, J. F., and F. Kreith. 1982. Solar Heating and Cooling: Active and Passive Design. Boca Raton, FL: CRC Press.
- Lee, T., A.P. Sullivan, L. Mack, J.L. Jimenez, S.M. Kreidenweis, T.B. Onasch, D.R. Worsnop, W. Malm, C.E. Wold, W.M. Hao, and J.L. Collett. 2010. Chemical smoke marker emissions during flaming and smoldering phases of laboratory open burning of wildland fuels. Aerosol Sci. Technol. 44:i–v. doi: 10.1080/02786826.2010.499884.
- Lim, S., M. Lee, G. Lee, S. Kim, S. Yoon, and K. Kang. 2012. Ionic and carbonaceous compositions of PM10, PM2.5 and PM1.0 at Gosan ABC Superstation and their ratios as source signature. Atmos. Chem. Phys. 12:2007–24. doi: 10.5194/acp-12-2007-2012.
- Lipsky, E.M., and A.L. Robinson. 2006. Effects of dilution on fine particle mass and partitioning of semivolatile organics in diesel exhaust and wood smoke. Environ. Sci. Technol. 40:155–62. doi: 10.1021/es050319p.
- MacCarty, N., D. Still, and D. Ogle. 2010. Fuel use and emissions performance of fifty cooking stoves in the laboratory and related benchmarks of performance. Energy Sustain. Dev. 14:161–71. doi: 10.1016/j.esd.2010.06.002.
- Majestic, B.J., J.A. Turner, and A.R. Marcotte. 2012. Respirable antimony and other trace-elements inside and outside an elementary school in Flagstaff, AZ, USA. Sci. Total Environ. 435–436:253–61. doi: 10.1016/j.scitotenv.2012.07.020.
- McCracken, J.P., J. Schwartz, A. Diaz, N. Bruce, and K.R. Smith. 2013. Longitudinal relationship between personal CO and personal PM2.5 among women cooking with woodfired cookstoves in Guatemala. PLoS ONE 8:e55670. doi: 10.1371/journal.pone.0055670.
- McDonald, J., B. Zielinska, E.M. Fujita, J.C. Sagebiel, J.C. Chow, and J.G. Watson. 2000. Fine particle and gaseous emission rates from residential wood combustion. Environ. Sci. Technol. 775:2080–91. doi: 10.1021/es9909632.
- McMeeking, G.R., S.M. Kreidenweis, S. Baker, C.M. Carrico, J.C. Chow, J.L. Collett, W.M. Hao, A.S. Holden, T.W. Kirchstetter, W. C. Malm, H. Moosmüller, A.P. Sullivan, and W. Cyle. 2009. Emissions of trace gases and aerosols during the open combustion of biomass in the laboratory. J. Geophys. Res. Atmos. 114:D19210. doi: 10.1029/2009JD011836.
- Morris, K., M. Morganlander, J. L. Coulehan, S. Gahagen, and V. C. Arena. 1990. Wood-burning stoves and lower respiratory tract infection in American Indian children. Am. J. Dis. Child. 144:105–8. doi: 10.1001/archpedi.1990.02150250117047.
- Naeher, L.P., M. Brauer, M. Lipsett, J.T. Zelikoff, C.D. Simpson, J.Q. Koenig, and K.R. Smith. 2007. Woodsmoke health effects: A review. Inhal. Toxicol. 19:67–106. doi: 10.1080/08958370600985875.
- Naeher, L.P., K.R. Smith, B.P. Leaderer, L. Neufeld, and D.T. Mage. 2001. Carbon monoxide as a tracer for assessing exposures to particulate matter in wood and gas cookstove households of highland Guatemala. Environ. Sci. Technol. 35:575–81. doi: 10.1021/es991225g.
- Northcross, A., Z. Chowdhury, J. McCracken, E. Canuz, and K.R. Smith. 2010. Estimating personal PM2.5 exposures using CO measurements in Guatemalan households cooking with wood fuel. J. Environ. Monit. 12:873–8. doi: 10.1039/b916068j.
- Nussbaumer, T., C. Czasch, N. Klippel, L. Johansson, and C. Tullin. 2008. Particulate Emissions from Biomass Combustion in IEA Countries. Zurich, Switzerland: Swiss Federal Office of Energy, Zurich, Switzerland. http://www.ieabcc.nl/publications/Nussbaumer_et_al_IEA_Report_PM10_Jan_2008.pdf (accessed April 30, 2017).
- Obaidullah, M., I.V. Dyakov, J.D. Thomassin, T. Duquesne, S. Bram, F. Contino, and J. De Ruyck. 2014. CO Emission measurements and performance analysis of 10 kW and 20 kW wood stoves. Energy Proc. 61:2301–6. doi: 10.1016/j.egypro.2014.12.443.
- Overend, R.P., T. Milne, and L. Mudge. 2012. Fundamentals of Thermochemical Biomass Conversion. New York, NY: Springer Science & Business Media.
- Ozgen, S., S. Caserini, S. Galante, M. Giugliano, E. Angelino, A. Marongiu, F. Hugony, G. Migliavacca, and C. Morreale. 2014. Emission factors from small scale appliances burning wood and pellets. Atmos. Environ. 94:144–53. doi: 10.1016/j.atmosenv.2014.05.032.
- Pankow, J.F. 1994. An absorption model of gas/particle partitioning of organic compounds in the atmosphere. Atmos. Environ. 28:185–8. doi: 10.1016/1352-2310(94)90093-0.
- Pettersson, E., C. Boman, R. Westerholm, D. Boström, and A. Nordin. 2011. Stove performance and emission characteristics in residential wood log and pellet combustion, Part 2: Wood stove. Energy Fuels 25:315–23. doi: 10.1021/ef1007787.
- Pollard, S.L., D.L. Williams, P.N. Breysse, P.A. Baron, L.M. Grajeda, R.H. Gilman, J.J. Miranda, and W. Checkley. 2014. A cross-sectional study of determinants of indoor environmental exposures in households with and without chronic exposure to biomass fuel smoke. Environ. Health 13:21. doi: 10.1186/1476-069X-13-21.
- Reddy, M.S., and C. Venkataraman. 2002. Inventory of aerosol and sulphur dioxide emissions from India: I—Fossil fuel combustion. Atmos. Environ. 36:677–97. doi: 10.1016/S1352-2310(01)00463-0.
- Robin, L.F., P.S.J. Lees, M. Winget, M. Steinhoff, L.H. Moulton, M. Santosham, and A. Correa. 1996. Word-burning stoves and lower respiratory illnessess in Navajo children. Pediatr. Infect. Dis. J. 15:859–65. doi: 10.1097/00006454-199610000-00006.
- Roden, C.A., T.C. Bond, S. Conway, and A.B. Osorto Pinel. 2006. Emission factors and real-time optical properties of particles emitted from traditional wood burning cookstoves. Environ. Sci. Technol. 40:6750–7. doi: 10.1021/es052080i.
- Roden, C.A., T.C. Bond, S. Conway, A.B. Osorto Pinel, N. MacCarty, and D. Still. 2009. Laboratory and field investigations of particulate and carbon monoxide emissions from traditional and improved cookstoves. Atmos. Environ. 43:1170–81. doi: 10.1016/j.atmosenv.2008.05.041.
- Rogalsky, D.K., P. Mendola, T.A. Metts, and W.J. Martin. 2014. Estimating the number of low-income americans exposed to household air pollution from burning solid fuels. Environ. Health Perspect. 122:806–10. doi: 10.1289/ehp.1306709.
- Shen, G., M. Xue, Y. Chen, C. Yang, W. Li, H. Shen, Y. Huang, Y. Zhang, H. Chen, Y. Zhu, H. Wu, A. Ding, and S. Tao. 2014. Comparison of carbonaceous particulate matter emission factors among different solid fuels burned in residential stoves. Atmos. Environ. 89:337–45. doi: 10.1016/j.atmosenv.2014.01.033.
- Shen, G., Y. Yang, W. Wang, S. Tao, C. Zhu, Y. Min, M. Xue, J. Ding, B. Wang, R. Wang, H. Shen, W. Li, X. Wang, and A.G. Russell. 2010. Emission factors of particulate matter and elemental carbon for crop residues and coals burned in typical household stoves in China. Environ. Sci. Technol. 44:7157–62. doi: 10.1021/es101313y.
- Siddiqui, A.R., K. Lee, D. Bennett, X. Yang, K.H. Brown, Z.A. Bhutta, and E.B. Gold. 2009. Indoor carbon monoxide and PM2.5 concentrations by cooking fuels in Pakistan. Indoor Air 19:75–82. doi: 10.1111/j.1600-0668.2008.00563.x.
- Smith, K.R. 1990. Indoor air quality and the pollution transition. In Indoor Air Quality, ed. H. Kasuga, 448–56. Berlin, Germany: Springer-Verlag.
- Smith, K.R., N. Bruce, K. Balakrishnan, H. Adair-Rohani, J. Balmes, Z. Chafe, M. Dherani, H.D. Hosgood, S. Mehta, D. Pope, and E. Rehfuess. 2014. Millions dead: How do we know and what does it mean? methods used in the comparative risk assessment of household air pollution. Annu. Rev. Public Health 35:185–206. doi: 10.1146/annurev-publhealth-032013-182356.
- Smith, K.R., M.A.K. Khalil, R.A. Rasmussen, S.A. Thorneloe, F. Manegdeg, and M. Apte. 1993. Greenhouse gases from biomass and fossil-fuel stoves in developing-countries—A Manila pilot-study. Chemosphere 26:479–505. doi: 10.1016/0045-6535(93)90440-G.
- Streets, D.G., T.C. Bond, G.R. Carmichael, S.D. Fernandes, Q. Fu, D. He, Z. Klimont, S.M. Nelson, N.Y. Tsai, M.Q. Wang, J.-H. Woo, and K.F. Yarber. 2003. An inventory of gaseous and primary aerosol emissions in Asia in the year 2000. J. Geophys. Res. 108(D21):8809. doi: 10.1029/2002JD003093.
- Thomas, E., K. Wickramasinghe, S. Mendis, N. Roberts, and C. Foster. 2015. Improved stove interventions to reduce household air pollution in low and middle income countries: A descriptive systematic review. BMC Public Health 15:650. doi: 10.1186/s12889-015-2024-7.
- Tissari, J., K. Hytönen, J. Lyyränen, and J. Jokiniemi. 2007. A novel field measurement method for determining fine particle and gas emissions from residential wood combustion. Atmos. Environ. 41:8330–44. doi: 10.1016/j.atmosenv.2007.06.018.
- Turns, S. 1996. An Introduction to Combustion: Concepts and Applications. New York, NY: McGraw-Hill.
- U.S. Census Bureau. 2014. American Community Survey Navajo Nation Demographic and Housing. https://factfinder.census.gov/bkmk/table/1.0/en/ACS/14_5YR/DP05/2500000US2430 (accessed March 2, 2015).
- U.S. Census Bureau. 2015. Navajo Nation House Heating Fuel 2011–2015 American Community Survey Estimate. https://factfinder.census.gov/bkmk/table/1.0/en/ACS/15_5YR/B25040/2500000US2430 (accessed January 12, 2016).
- U.S. Environmental Protection Agency. 1984. Guidelines on Preferred Location and Design of Measurement Ports for Air Pollution Control. https://nepis.epa.gov/Exe/ZyPURL.cgi?Dockey=50000KW3.TXT (accessed December 10, 2014).
- U.S. Environmental Protection Agency. 1986. Effects of Design Factors on Emissions from Non-Catalytic Residential Wood Combustion Appliances. http://nepis.epa.gov/Exe/ZyPURL.cgi?Dockey=9100J6Q5.TXT (accessed March 11, 2015).
- U.S. Environmental Protection Agency. 1988. Method 28—Certification and Auditing of Wood Heaters, 1–15. https://www.epa.gov/sites/production/files/2016-06/documents/m-28.pdf (accessed October 11, 2015).
- U.S. Environmental Protection Agency. 1996. AP-42, Fifth Edition, Chapter 1: External Combustion Sources, Residential Wood Stoves 1(10):1–10. http://www.epa.gov/ttn/chief/ap42/ch01/index.html (accessed September 1, 2014).
- U.S. Environmental Protection Agency. 2016a. Process for Developing Improved Cordwood Test Methods for Wood Heaters. https://www.epa.gov/sites/production/files/2016-03/documents/discussion_paper_-_process_for_dev_imp_cwtm_030916.pdf (accessed March 12, 2015).
- U.S. Environmental Protection Agency. 2016b. Basic Information of Air Emissions Factors and Quantification. https://www.epa.gov/air-emissions-factors-and-quantification/basic-information-air-emissions-factors-and-quantification (accessed September 15, 2014).
- Vicente, E.D., M.A. Duarte, A.I. Calvo, T.F. Nunes, L. Tarelho, and C.A. Alves. 2015. Emission of carbon monoxide, total hydrocarbons and particulate matter during wood combustion in a stove operating under distinct conditions. Fuel Process. Technol. 131:182–92. doi: 10.1016/j.fuproc.2014.11.021.
- Ward, T., J. Boulafentis, J. Simpson, C. Hester, T. Moliga, K. Warden, and C. Noonan. 2011. Lessons learned from a woodstove changeout on the Nez Perce Reservation. Sci. Total Environ. 409:664–70. doi: 10.1016/j.scitotenv.2010.11.006.
- World Health Organization. 2014. WHO Guidelines for Indoor Air Quality: Household Fuel Combustion. http://www.who.int/indoorair/guidelines/hhfc/en (accessed February 1, 2015)
- World Health Organization. 2016. Burning Opportunity: Clean Household Energy for Health, Sustainable Development, and Wellbeing of Women and Children. http://apps.who.int/iris/bitstream/10665/204717/1/9789241565233_eng.pdf?ua=1 (accessed December 10, 2016).
- Yamamoto, S. S., V. R. Louis, A. Sié, and R. Sauerborn. 2014. Biomass smoke in Burkina Faso: What is the relationship between particulate matter, carbon monoxide, and kitchen characteristics? Environ. Sci. Pollut. Res. 21:2581–91. doi: 10.1007/s11356-013-2062-6.
- Zhang, J., K. Smith, Y. Ma, S. Ye, F. Jiang, W. Qi, P. Liu, M.A. Khalil, R. Rasmussen, and S. Thorneloe. 2000. Greenhouse gases and other airborne pollutants from household stoves in China: A database for emission factors. Atmos. Environ. 34:4537–49. doi: 10.1016/S1352-2310(99)00450-1.
- Zhang, K.M., and A.S. Wexler. 2004. Evolution of particle number distribution near roadways—Part I: Analysis of aerosol dynamics and its implications for engine emission measurement. Atmos. Environ. 38:6643–53. doi: 10.1016/j.atmosenv.2004.06.043.
- Zhang, Y., J. J. Schauer, Y. Zhang, L. Zeng, Y. Wei, Y. Liu, and M. Shao. 2008. Characteristics of particulate carbon emissions from real-world Chinese coal combustion. Environ. Sci. Technol. 42:5068–5073. doi: 10.1021/es7022576.
- Zhi, G., Y. Chen, Y. Feng, S. Xiong, L.I. Jun, G.A.N. Zhang, G. Sheng, and J. Fu. 2008. Emission characteristics of carbonaceous particles from various residential coal-stoves in China. Environ. Sci. Technol. 42:3310–5. doi: 10.1021/es702247q.